ShengdongTrendTheory
現在、コンテンツはありません
ShengdongTrendTheory
$BTC 3.19 Early Morning Bitcoin and Ethereum Market Analysis and Trading Suggestions
From the current chart structure, Bitcoin's daily timeframe has already shown clear weakening signals. After the price pulled back from previous highs under pressure, it experienced another sharp decline with increased volume yesterday, nearly giving back all gains from the previous three trading days. Currently, the price has returned to near the center of the previous consolidation range, indicating that the previous breakout attempt has failed.
From the daily indicators' perspective, the current technical
BTC-3.42%
- 報酬
- いいね
- コメント
- リポスト
- 共有
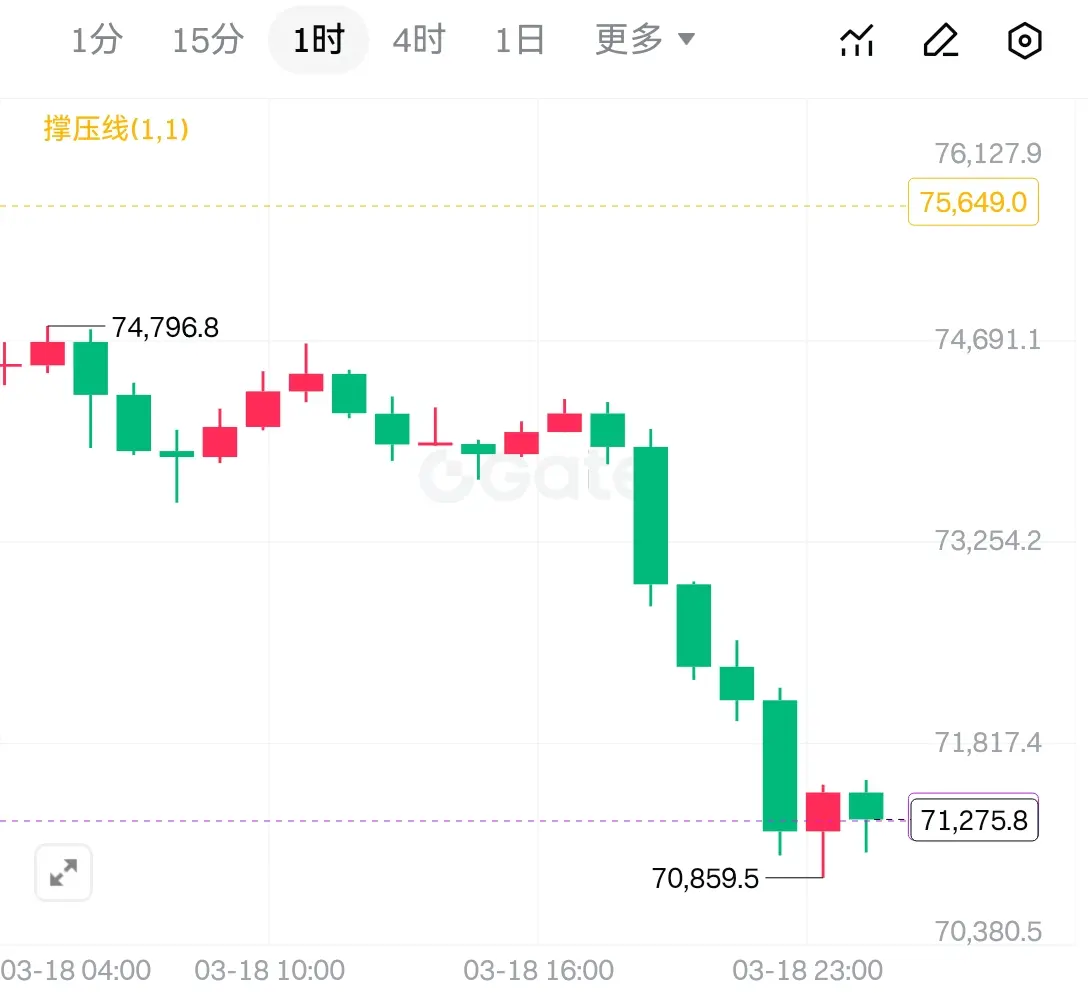
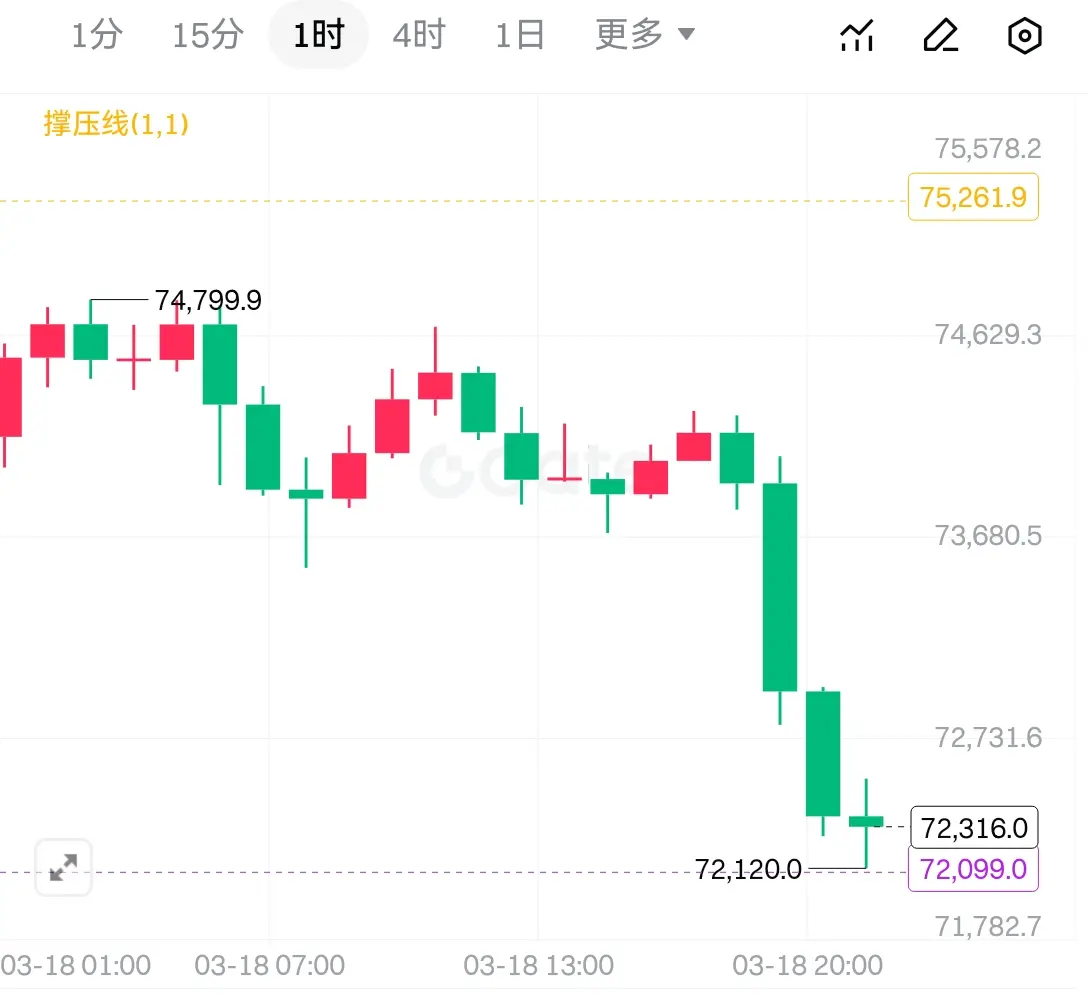
$BTC 3.18夜間ビットコイン・イーサリアム相場分析と取引提案
ビットコインは本日の震荡下落の中で、以前の買いと売りの争奪の重要な心理的価格水準である73000ドルを正式に下回りました。現在の最安値は72085ドル付近に達しており、この動きは顕著な技術的意義を持ちます。73000ドルのラインは、過去の密集取引エリアの下限であるだけでなく、短期的な買い手の最後の防衛ラインでもあります。この重要な位置の喪失により、下方の技術的サポートは実質的に「圧倒」され、元のサポートラインは今後の強い抵抗エリアへと変化します。
同時に、イーサリアムの動きもビットコインと全く同じであり、両者は高度に同期し、弱気の共振パターンを示しています。現在、コイン価格は中央線に近づきつつあり、BOLLチャネルの形状を観察すると、三本のラインが拡大から収縮へと変化する兆候を示しており、価格は中軌道の下方を沿って推移しています。これは市場の短期的な勢いが衰退していることを示し、チャート上ではさらに下部の軌道に向かってサポートを求める傾向があります。
重要なサポートラインを割り込んだ以上、上方の圧力は増加し、BOLL指標も縮小下行の兆候を示しているため、夜間の取引戦略は反発を狙ったショートを中心に考えるべきです。73000~73200ドル付近(すなわち割り込んだサポートラインがレジスタンスに変わるかどうかに注目し
BTC-3.42%
- 報酬
- いいね
- コメント
- リポスト
- 共有
$BTC 3.18 Evening Bitcoin and Ethereum Market Analysis and Trading Recommendations
From the four-hour cycle perspective, although the price pulled back with four consecutive bearish candlesticks after the surge, this is merely a technical correction for the excessively rapid previous rally. Subsequently, the K-line pattern clearly shows that the downside momentum is exhausting. The market has entered a consolidation stage composed of alternating small bearish and small bullish candles. While the battle between bulls and bears appears fierce, the bulls' defense line is actually solid and the b
From the four-hour cycle perspective, although the price pulled back with four consecutive bearish candlesticks after the surge, this is merely a technical correction for the excessively rapid previous rally. Subsequently, the K-line pattern clearly shows that the downside momentum is exhausting. The market has entered a consolidation stage composed of alternating small bearish and small bullish candles. While the battle between bulls and bears appears fierce, the bulls' defense line is actually solid and the b
BTC-3.42%
- 報酬
- 1
- コメント
- リポスト
- 共有
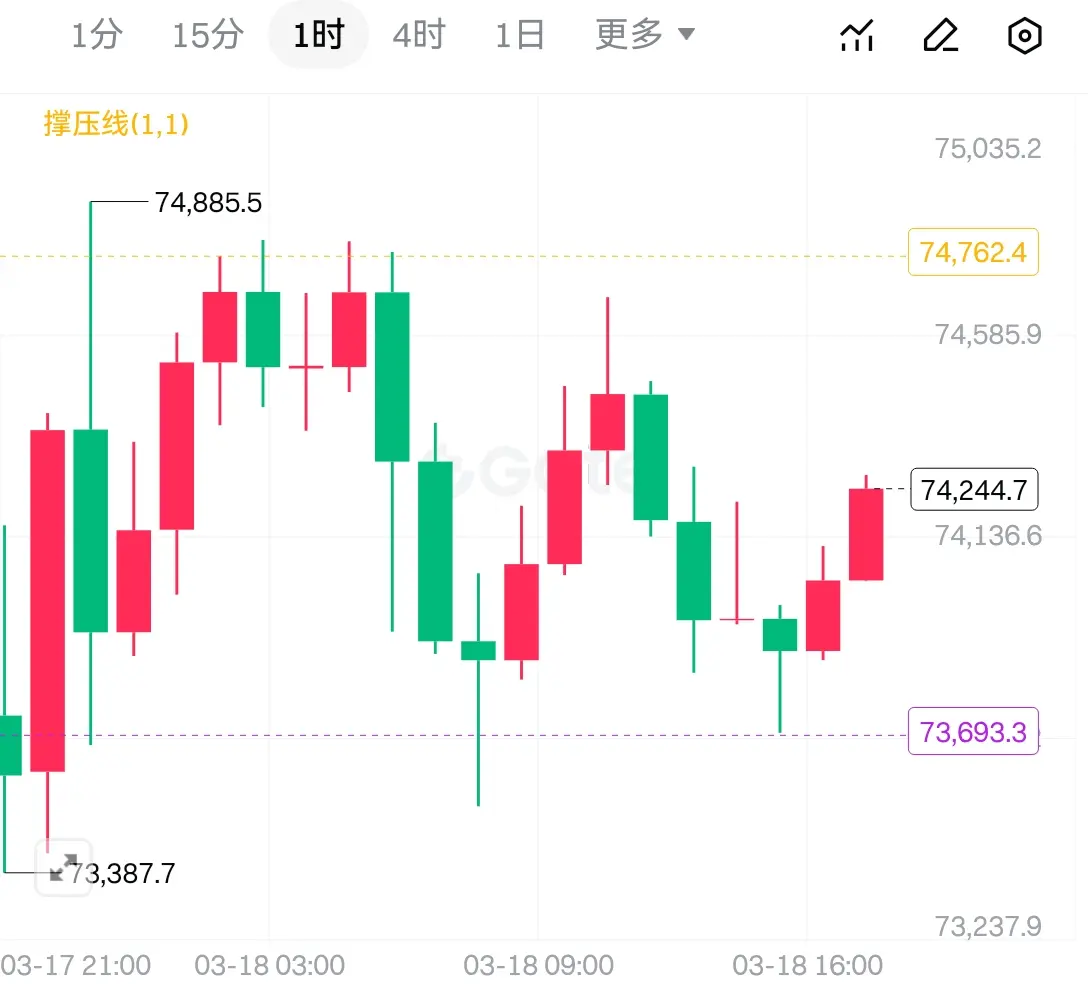
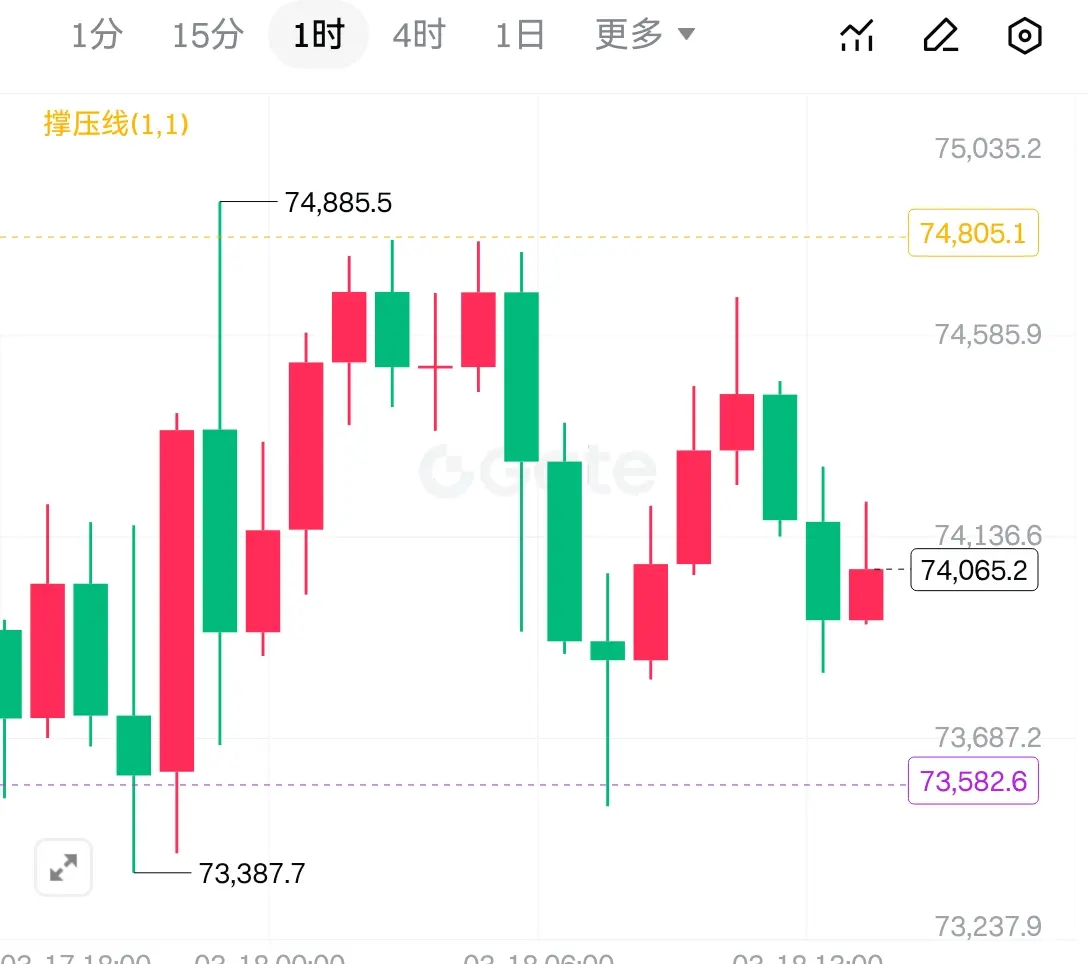
$BTC 3.18午後のビットコイン・イーサリアム相場分析と操作提案
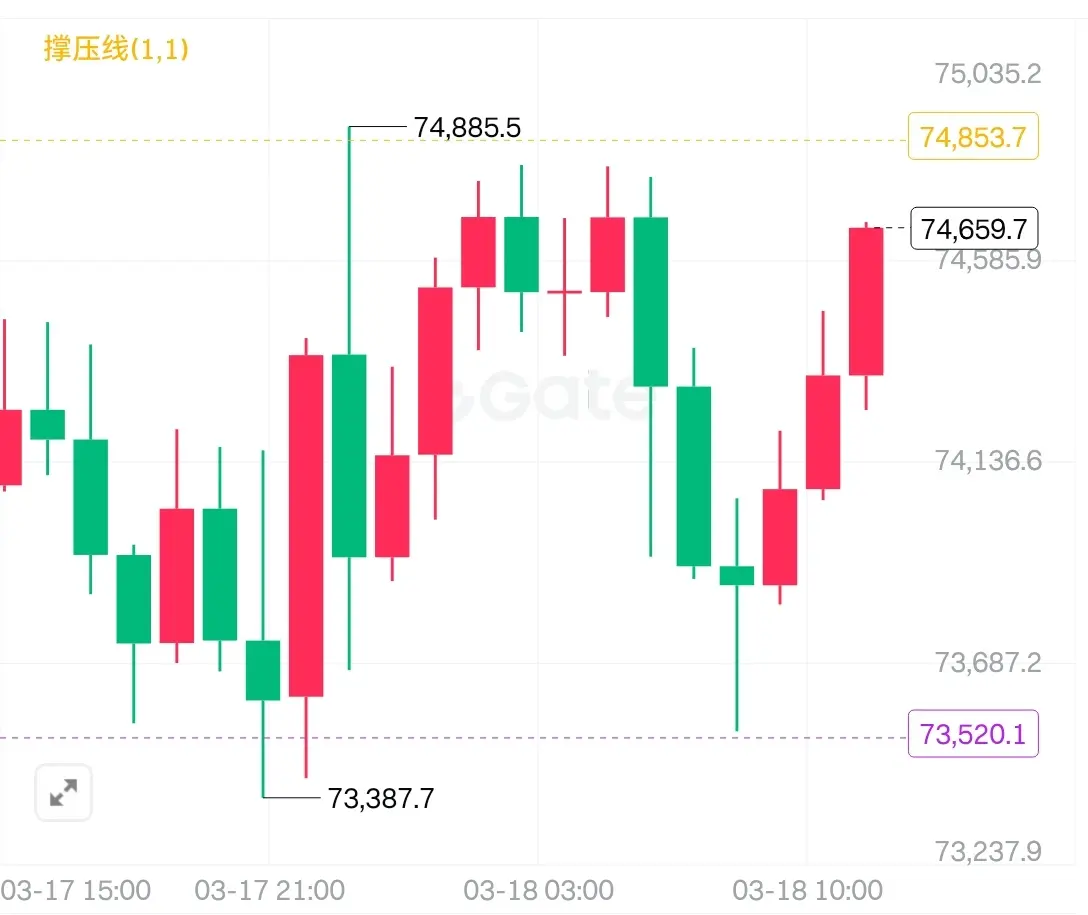
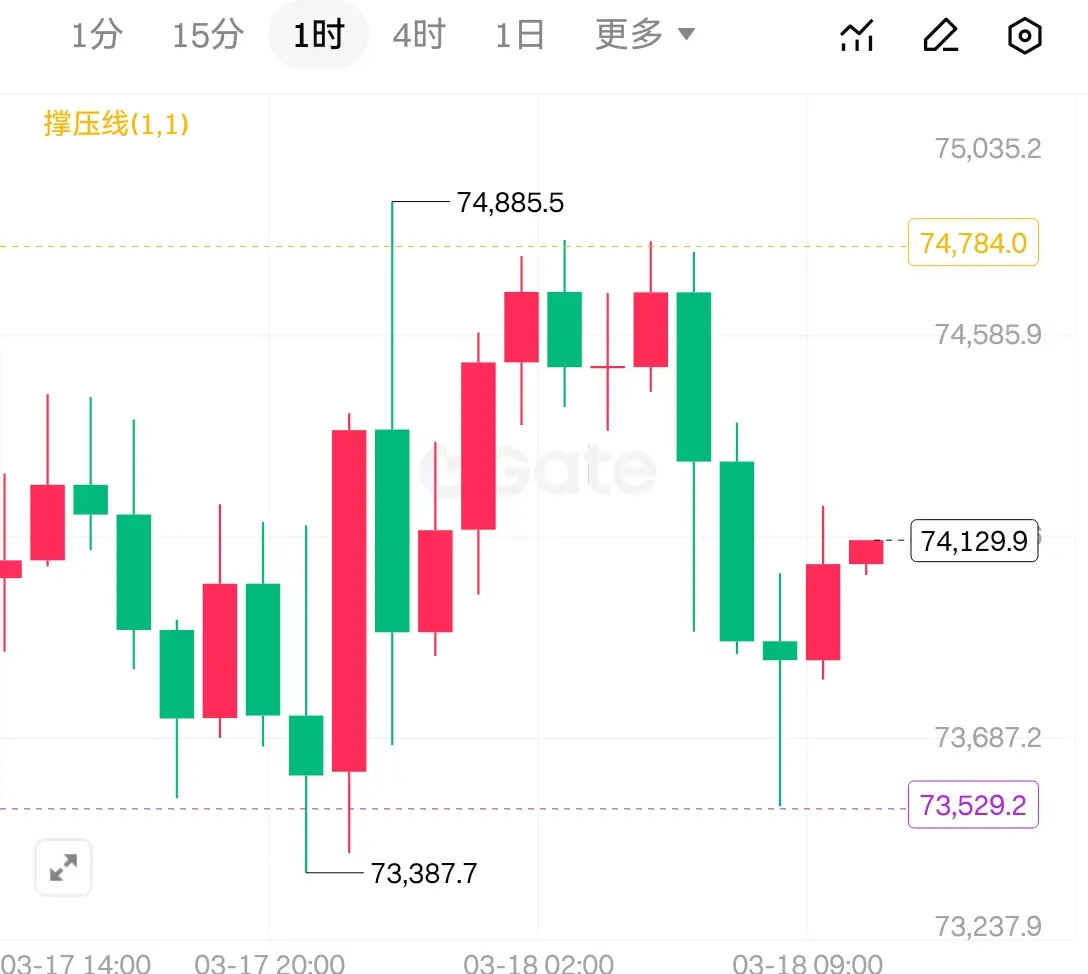
四時間足チャートから見ると、価格は常にボリンジャーバンドの上部軌道の強気エリアで推移しています。K線は陽線と陰線が交互に現れる震荡形態を示していますが、詳細には二つの重要なシグナルがあります。第一に、各下落時の陰線の実体が短縮し、下ひげが頻繁に出現していることから、空売り勢の反発力が市場によって自然に吸収されつつあり、下落の勢いが次第に弱まっていることを示しています。第二に、安値が次第に引き上げられていることは、典型的な上昇の中継構造です。現在、買い勢力が明らかに優勢を占めており、市場は時間を使って空間を埋めながら、上方の圧力を消化しつつ、次の上昇局面に向けて土台を固めています。
時間足に切り替えると、トレンドの構造がより明確になります。コイン価格はボリンジャーバンドの上・中・下の三本軌道の間を規則的に推移し、教科書通りの震荡整理パターンを形成しています。今朝から現在まで、価格はまず下方のサポートをテストし、その後素早く反発し、再び上部軌道へ向かって試しに行っています。この「底を打つと即座に反発する」特性は、下側の買い注文が非常に積極的であることを示し、市場のセンチメントは早朝の躊躇を経て、再び楽観的に変わりつつあります。
現在の安定した動きは、相場の終点ではなく、次の段階の始まりです。価格が重要なサポートエリ
BTC-3.42%
- 報酬
- 1
- コメント
- リポスト
- 共有
$BTC 現在の市場全体のセンチメントは安定傾向にあり、参加者は一般的にFRBの政策予想がさらに明確になることを待っている。短期的な価格調整がありますが、チェーン上のデータと技術指標の総合的なパフォーマンスから見ると、市場内部構造は顕著なポジティブな変化を呈しています。
まず、チェーン上のデータの観察から、価格レベルで変動は大きくありませんが、買い圧力は静かに戻ってきています。資金流入の限界的改善は通常、市場底部の強化シグナルと見なされ、現在の価格レベルで既に賢明な資金が配置を開始し、その後の上昇に対して本当の流動性サポートを提供していることを示しています。
次に、技術分析の観点から見ると、短期的なチャート形状は既に古典的な強気シグナルを発している。1時間と4時間のK線チャートを観察すると、価格は下降過程でより低い高値を示していますが、RSIやMACDなどの主要なモメンタム指標の低値は上昇しています。このような「底背離」構造は、市場の下落モメンタムが消耗しており、空売り勢力が既に疲れ果てていることを意味することが多いです。歴史的に、このようなシグナルはしばしばトレンド反転またはより大きなレベルのリバウンドの前兆と見なされています。
さらに注目すべきは日足レベルの健全性です。現在の日足RSI指標値は約60であり、この数値は非常に参考価値があります。これは70を超える過熱状態には入っ
BTC-3.42%
- 報酬
- 2
- コメント
- リポスト
- 共有
$BTC 3.18午間比特币イーサリアム行情分析及び操作建议
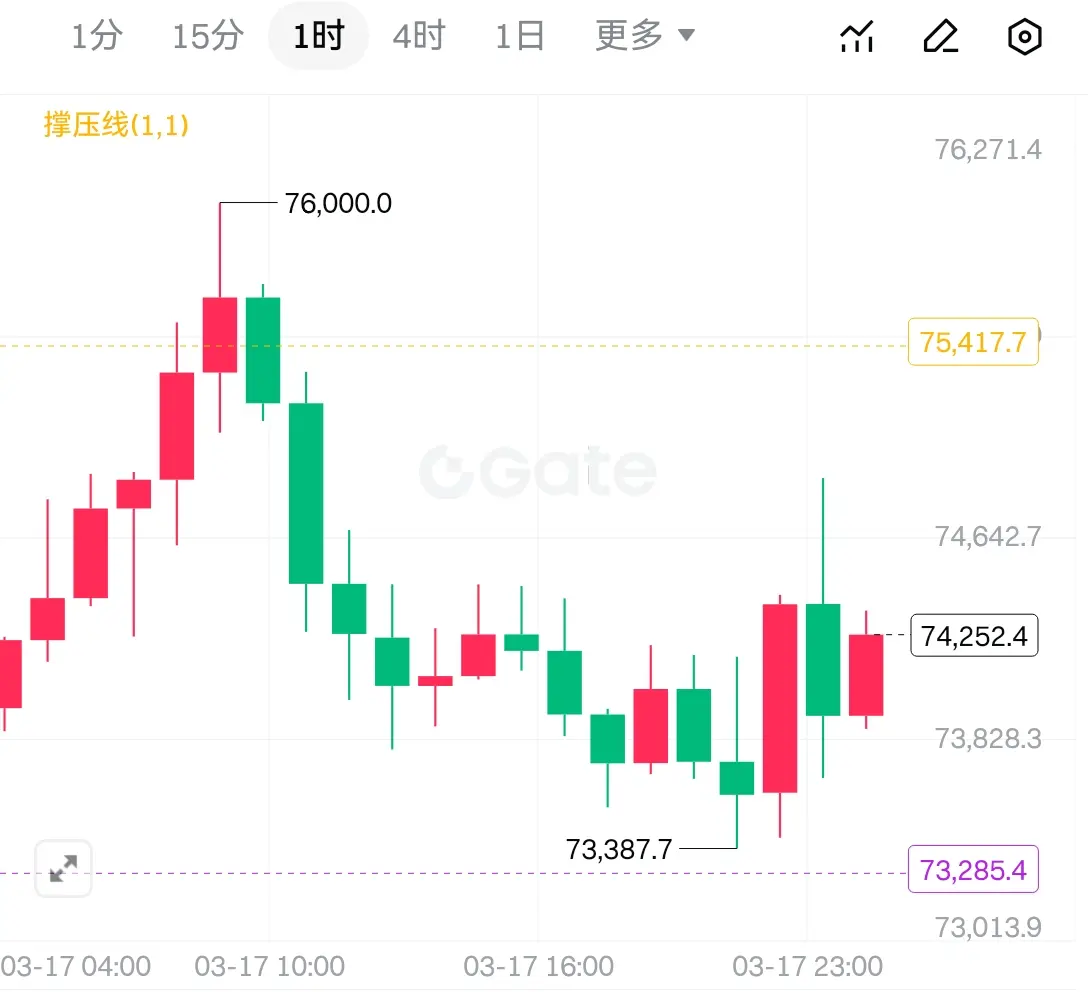
全体的なチャート観察から、現在の市場は連続陽線のパターンが崩れておらず、価格は常にすべての主要移動平均線の上方で堅調に推移していることが示されており、これは市場の中長期的なポジションコストが絶えず上昇し、下支えの力も非常に強いことを意味します。移動平均線の多頭排列は完璧な上昇支援態勢を形成しており、全体の上昇トレンドは非常に明確であり、これは市場の内在的な強さの最良の証拠です。
4時間足レベルの調整に直面した際、それをリスク信号とみなすのではなく、技術指標の積極的な修復と解釈すべきです。今回の調整の安値は前の安値を下回らず、価格は依然として上昇チャネル内で安定して推移しており、「高値を引き上げ、安値も引き上げる」健全な強気構造を完璧に維持しています。この構造はトレンド継続の基礎であり、市場の上昇ペースが乱れていないことを示しています。
特に注目すべきは、深夜の底打ちと反発の動きです。この動きはチャネル下限のサポートの有効性を二次確認しただけでなく、成功した空売りのダマシ・洗い落としでもあります。その核心的な目的は、以前に過度に高かった短期的なテクニカル指標を修復し、利益確定の圧力を消化し、時間を使って空間を作ることで、その後の爆発的なブレイクアウトを発動させるための十分な動力を蓄えることにあります。
要するに、市場の各
原文表示全体的なチャート観察から、現在の市場は連続陽線のパターンが崩れておらず、価格は常にすべての主要移動平均線の上方で堅調に推移していることが示されており、これは市場の中長期的なポジションコストが絶えず上昇し、下支えの力も非常に強いことを意味します。移動平均線の多頭排列は完璧な上昇支援態勢を形成しており、全体の上昇トレンドは非常に明確であり、これは市場の内在的な強さの最良の証拠です。
4時間足レベルの調整に直面した際、それをリスク信号とみなすのではなく、技術指標の積極的な修復と解釈すべきです。今回の調整の安値は前の安値を下回らず、価格は依然として上昇チャネル内で安定して推移しており、「高値を引き上げ、安値も引き上げる」健全な強気構造を完璧に維持しています。この構造はトレンド継続の基礎であり、市場の上昇ペースが乱れていないことを示しています。
特に注目すべきは、深夜の底打ちと反発の動きです。この動きはチャネル下限のサポートの有効性を二次確認しただけでなく、成功した空売りのダマシ・洗い落としでもあります。その核心的な目的は、以前に過度に高かった短期的なテクニカル指標を修復し、利益確定の圧力を消化し、時間を使って空間を作ることで、その後の爆発的なブレイクアウトを発動させるための十分な動力を蓄えることにあります。
要するに、市場の各
- 報酬
- いいね
- コメント
- リポスト
- 共有
$BTC 3.18凌晨のビットコイン・イーサリアム相場分析と取引アドバイス
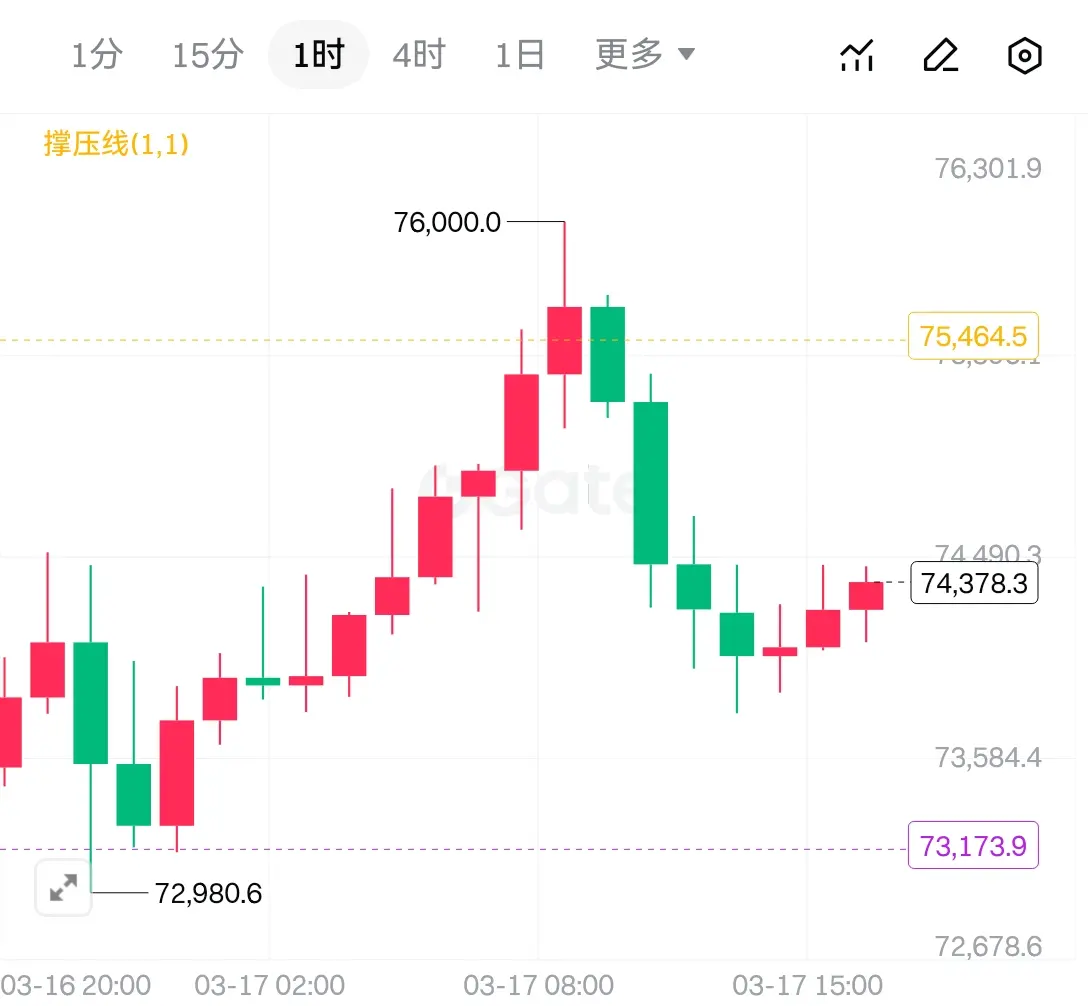
現状の構造から見ると、価格は重要な買いと売りの分水嶺エリアでパニック売りを起こさず、むしろ反復的に震荡整理を選択しており、これは強気のシグナルです。特に4時間足では、早朝に一波の上昇後の下落を見せ、長い上ヒゲを残しており、テクニカルな形状から短期的な天井の錯覚を与えることがあります。
現在のところ、市場は早朝の下落トレンドを止めて、震荡しながら上昇に転じています。次に注目すべきポイントは非常に明確で、現在の価格が以前の重要な抵抗ラインをしっかりと支えられるかどうかです。この動きがスムーズに実現すれば、「抵抗が支持に変わる」トップとボトムの転換が正式に確立され、次の反発や反転の余地が生まれます。
したがって、深夜の取引戦略としても、引き続き低買いを中心とした方針を維持できます。下の強い支持エリアが有効に割り込まれるまでは、震荡による恐怖に慌てる必要はありません。待ちに待った押し目買いのチャンスを、忍耐強く待つことが深夜時間帯ではより堅実な選択肢となるでしょう。
BTC-3.42%
- 報酬
- いいね
- コメント
- リポスト
- 共有
$BTC From the current chart structure, the market is in a normal consolidation phase after a breakout, which is by no means a signal of trend reversal. We must maintain a clear understanding: financial markets have never had the myth of only rising without falling, nor will there be a dead end of only falling without rising. Therefore, this phase of pullback is not only not scary, but rather the healthiest "correction step" in a trending move. It clears floating chips for subsequent upside attacks and lays a more solid foundation.
Currently, this wave of pullback has not completely exhausted
Currently, this wave of pullback has not completely exhausted
BTC-3.42%
- 報酬
- 2
- コメント
- リポスト
- 共有
$BTC 3.17 Afternoon Bitcoin and Ethereum Market Analysis and Trading Recommendations
From the current market structure, the market has entered a strong controlling pattern. On the 4-hour level, the coin price has consistently relied on the upper band of the Bollinger Bands, presenting a steady upward oscillation posture. Although the market is not a one-sided violent rally, this "two steps forward, one step back" slow bull trend often indicates more sustainable momentum. It is worth noting that despite the large volatility base, each rally is accompanied by certain pullbacks to wash out float
From the current market structure, the market has entered a strong controlling pattern. On the 4-hour level, the coin price has consistently relied on the upper band of the Bollinger Bands, presenting a steady upward oscillation posture. Although the market is not a one-sided violent rally, this "two steps forward, one step back" slow bull trend often indicates more sustainable momentum. It is worth noting that despite the large volatility base, each rally is accompanied by certain pullbacks to wash out float
BTC-3.42%
- 報酬
- 1
- コメント
- リポスト
- 共有
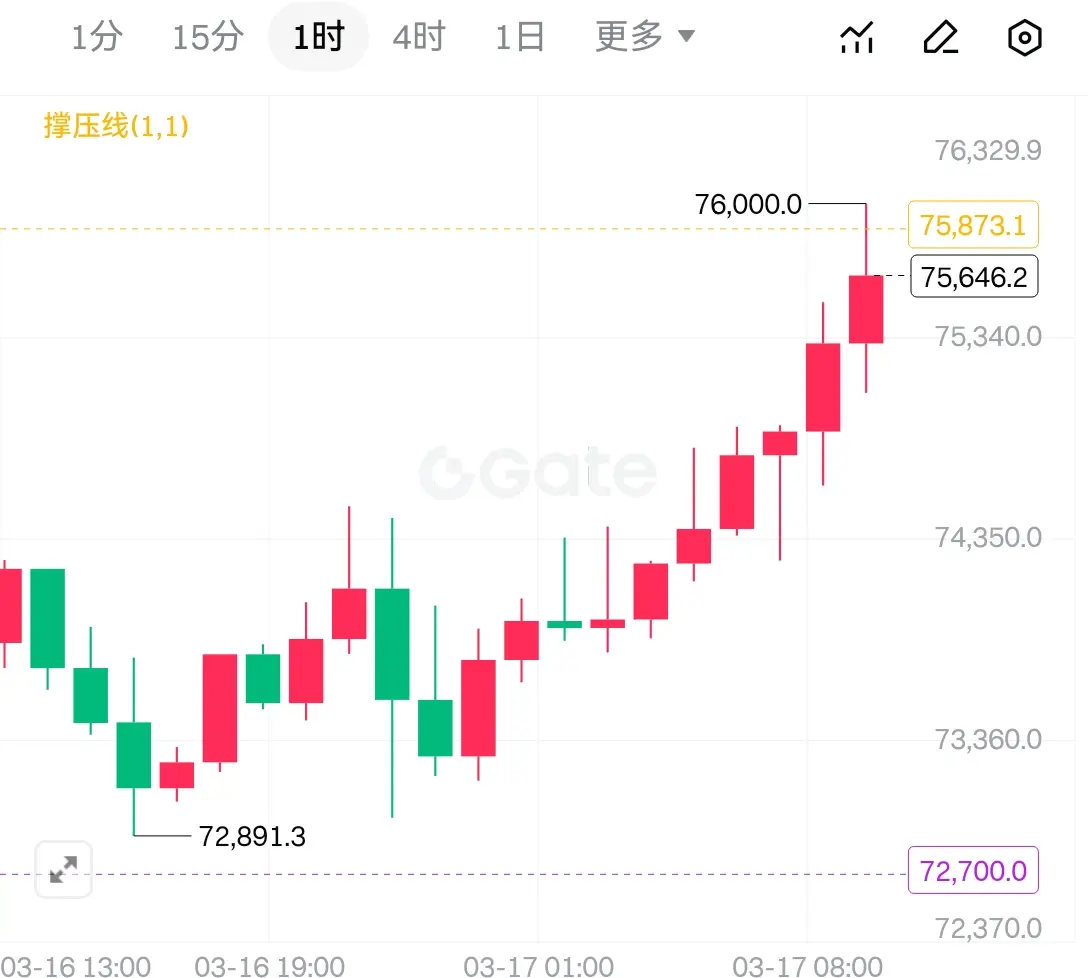
$BTC 1. Daily timeframe remains strong: On the daily K-line chart, the coin price shows a continuous pattern of rising with bullish candles, and each bullish candle has a full body, demonstrating the persistence and determination of buying power. This textbook-style consecutive bullish formation is the strongest signal of bulls controlling the market, accumulating sufficient momentum for the subsequent second push higher.
2. Smaller timeframes establish solid support: On smaller timeframes such as hourly charts, price is consolidating strongly at higher levels, with the core purpose being to
2. Smaller timeframes establish solid support: On smaller timeframes such as hourly charts, price is consolidating strongly at higher levels, with the core purpose being to
BTC-3.42%
- 報酬
- いいね
- コメント
- リポスト
- 共有
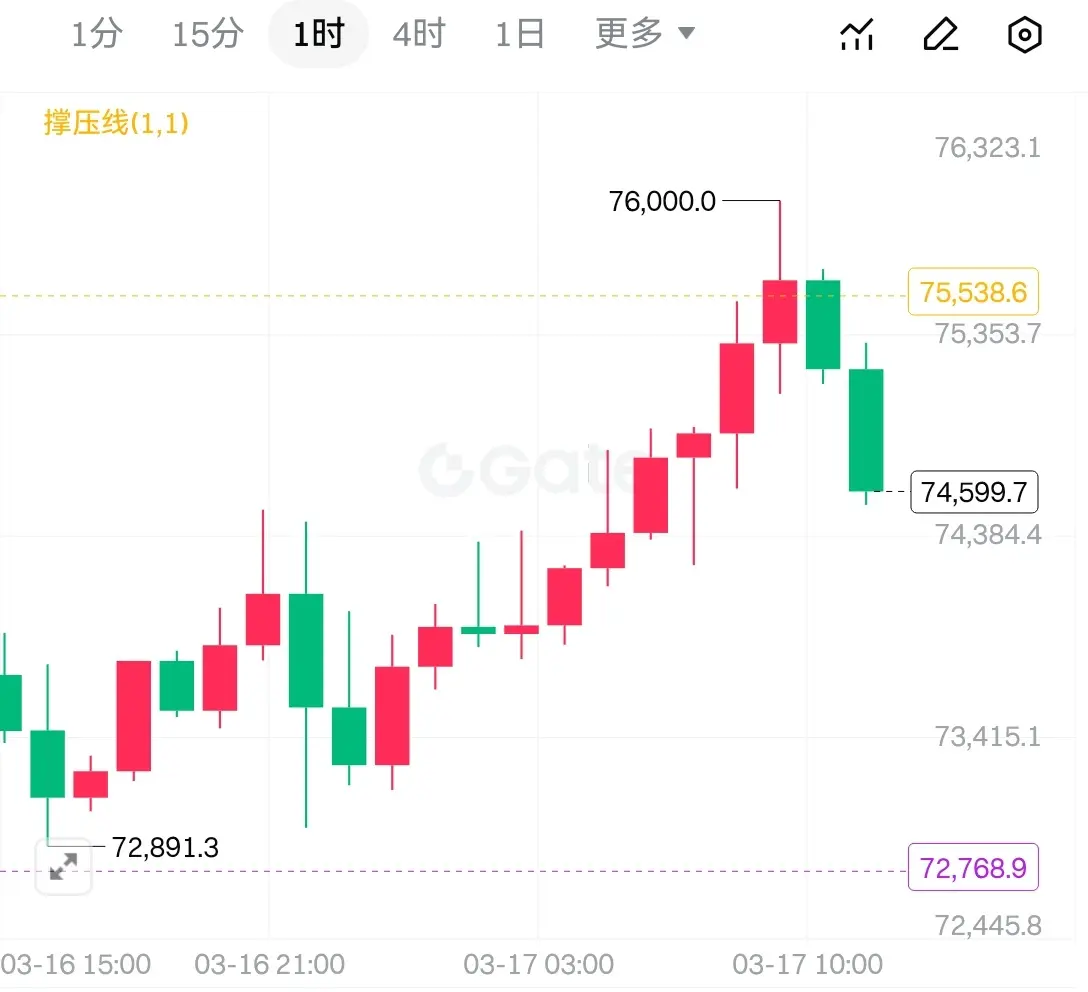
$BTC 3.17 Midday Bitcoin and Ethereum Market Analysis and Trading Recommendations
From the current chart structure, the daily level has already closed nine consecutive bullish candles, which is an extremely rare bullish signal! This is not only a manifestation of bullish strength, but also an effective breakout from the previous consolidation range. As the coin price continues to rise, the moving average system (MA5/10) at the daily level has formed a golden cross diverging upward, and the Bollinger Bands channel is also expanding synchronously with the price rally. This technical pattern ind
From the current chart structure, the daily level has already closed nine consecutive bullish candles, which is an extremely rare bullish signal! This is not only a manifestation of bullish strength, but also an effective breakout from the previous consolidation range. As the coin price continues to rise, the moving average system (MA5/10) at the daily level has formed a golden cross diverging upward, and the Bollinger Bands channel is also expanding synchronously with the price rally. This technical pattern ind
BTC-3.42%
- 報酬
- いいね
- コメント
- リポスト
- 共有
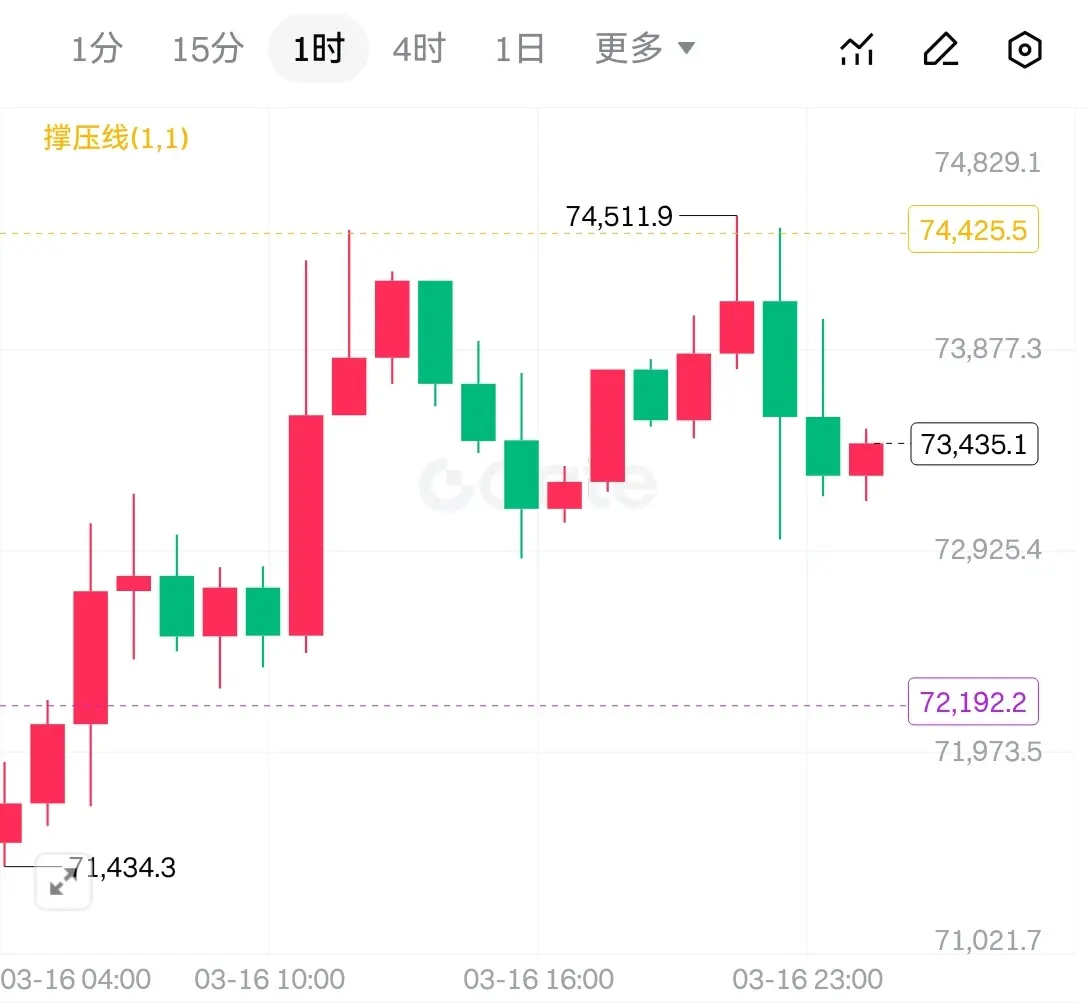
$BTC 3.17 Early Morning Bitcoin Ethereum Market Analysis and Trading Recommendations
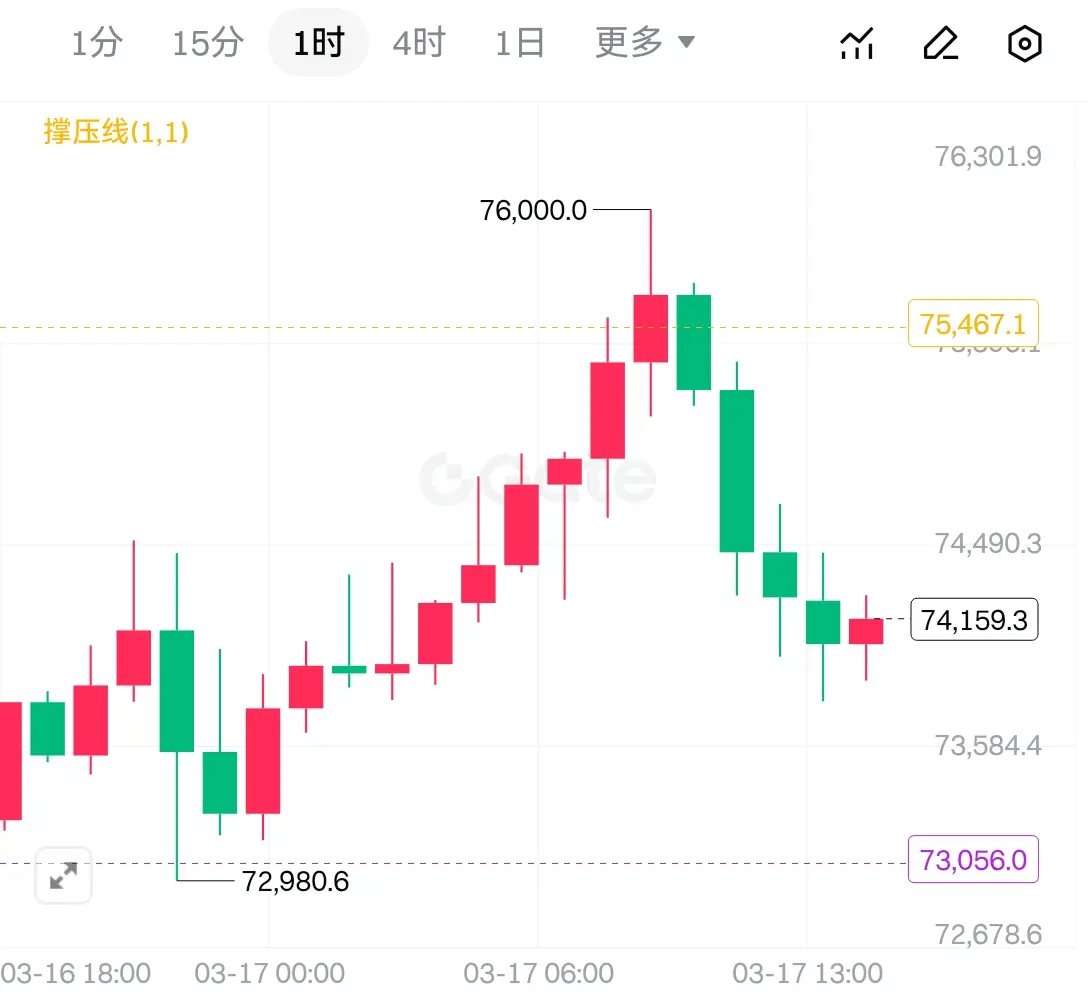
From the current market perspective, the daily level continues with bullish candles pushing higher, and coin prices have rebounded near the upper Bollinger Band. Although the overall trend remains relatively strong, resistance above is gradually becoming evident. Key resistance level remains in the upper band area of the ascending channel. If a second breakthrough cannot be formed, short-term upside space may be limited, and the market may enter a cyclical adjustment rhythm. From a technical indicator perspec
From the current market perspective, the daily level continues with bullish candles pushing higher, and coin prices have rebounded near the upper Bollinger Band. Although the overall trend remains relatively strong, resistance above is gradually becoming evident. Key resistance level remains in the upper band area of the ascending channel. If a second breakthrough cannot be formed, short-term upside space may be limited, and the market may enter a cyclical adjustment rhythm. From a technical indicator perspec
BTC-3.42%
- 報酬
- いいね
- コメント
- リポスト
- 共有