
Analyst Says Not Buying Kaspa (KAS) Here Is a “Disservice” – Here’s WhyTraders are talking more about Kaspa (KAS), but this time it’s not about excitement or noise.
One market watcher said skipping Kaspa at these prices would feel like doing his family a disservice. He’s aiming for $0.23 and pointed out that he was already buying when KRC20 first launched, even near the highs.
Now that the KAS price has cooled off and the project has continued to build, he says he feels even better about it. Right now, KAS is changing hands around $0.0298.
- Here’s What Kaspa Chart Is Showing
- Why the Analyst Is Confident
- What Needs to Happen Next For Kaspa
Here’s What Kaspa Chart Is Showing
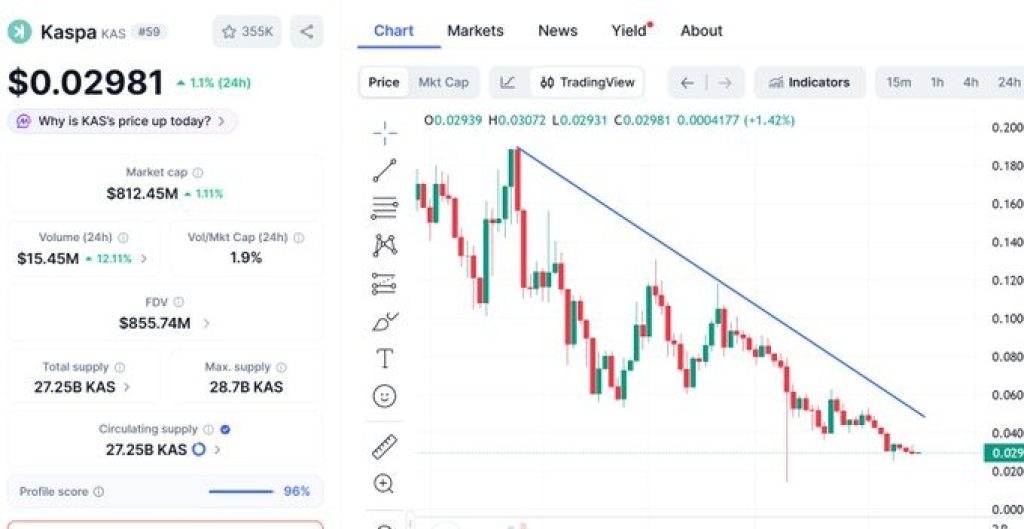
Looking at the chart, Kaspa has been in a clear downtrend for months. The KAS price previously peaked much higher before steadily printing lower highs under a descending trendline.
That blue trendline on the chart shows consistent rejection from sellers over time. Every bounce has been capped beneath it.
However, something different is happening now. The KAS price has moved sideways near the $0.029–$0.03 region after a prolonged decline.
Instead of sharply breaking down, price is compressing near recent lows. That often signals exhaustion rather than panic selling. The steep flush lower has already happened. Now the market is trying to find balance.
_Source: _****X/Finance Freeman
Why the Analyst Is Confident
The tweet highlights one key point: fundamentals versus price. The analyst spoke about everything about Kaspa as a project is stronger today than it was during previous highs. That’s a common long-term investor thesis, development improves while price pulls back.
The $0.23 target mentioned in the tweet likely refers to a short-to-mid-term technical move. From current levels, that would represent a meaningful bounce if momentum builds. Importantly, the tone isn’t about chasing strength. It’s about accumulation during weakness.
_****XRP Price Prediction: What Happens If Ripple’s $100B Payments Network Expands?**
What Needs to Happen Next For Kaspa
Right now, KAS is sitting under a long-term descending resistance line. For a stronger recovery, price would need to break above that trendline and hold above the $0.035–$0.04 area.
That would shift short-term structure and open the door toward the mid-$0.05 region. On the downside, if $0.029 fails, the next support area comes slightly below near $0.025.
At this stage, the chart shows stabilization, not a confirmed reversal. The analyst’s conviction is based on long-term belief in the project. The KAS chart shows compression after a prolonged drop. Whether that turns into a bounce or another leg lower will likely define the next few weeks.
For now, the Kaspa price is at a decision point, and that’s exactly where long-term buyers usually start paying attention.
Disclaimer: The information on this page may come from third parties and does not represent the views or opinions of Gate. The content displayed on this page is for reference only and does not constitute any financial, investment, or legal advice. Gate does not guarantee the accuracy or completeness of the information and shall not be liable for any losses arising from the use of this information. Virtual asset investments carry high risks and are subject to significant price volatility. You may lose all of your invested principal. Please fully understand the relevant risks and make prudent decisions based on your own financial situation and risk tolerance. For details, please refer to
Disclaimer.
Related Articles
XRP Today News: XRP Whale Accumulates 210 Million Tokens, Market Compression Range Indicates a Major Move
XRP has been under continuous pressure this year, but large whales holding between 1 million and 100 million XRP have recently increased their holdings by approximately 210 million coins, indicating that major investors are quietly building positions during the downturn. On the technical side, XRP is forming a contracting wedge between the support at $1.30 and resistance at $1.50, suggesting a potential significant directional move. The low liquidity environment could both amplify gains and increase downside risks. Watching whether the $1.30 support can hold is crucial.
MarketWhisper17m ago
Peter Brandt releases Bitcoin chart analysis showing a short-term bullish pattern
Gate News Announcement, March 10, renowned trader and chart analyst Peter Brandt released a Bitcoin chart analysis. Peter Brandt successfully predicted the 2018 Bitcoin crash. The chart shows the "Big Banana" chart displaying a large upward curved channel on the long-term weekly chart (2014-2027); the "Small Banana" chart shows a smaller similar curve currently forming near $69,000 on the daily chart. The arrows in the chart clearly point upward, indicating higher targets.
GateNews37m ago
ETH 15-minute increase of 1.32%: Major capital inflows and technical rebound resonate to drive the rise
2026-03-10 02:30 to 2026-03-10 02:45 (UTC), ETH's 15-minute return reached +1.32%, with a price range of 2020.97 to 2054.01 USDT, and an amplitude of 1.63%, showing a significant anomaly. Market attention increased accordingly, volatility intensified, and short-term trading activity rose.
The main driver of this anomaly was the concentration of large on-chain funds buying in, especially multiple large wallets making cumulative large purchases of over 3000 ETH near key support levels, directly pushing up the ETH price.
GateNews44m ago
BTC Price Fluctuation Analysis
# BTC Price Movement Deep Attribution Report for March 10, 2026, 02:30-02:45 (UTC)
## 1. Event Overview
Between 02:30 and 02:45 (UTC) on March 10, 2026, Bitcoin (BTC) experienced a significant price movement, with a return of +1.39%. The price fluctuations during this time window exceeded normal ranges, attracting market attention. This report will conduct a comprehensive attribution analysis based on on-chain data, market conditions, macroeconomic environment, trading behaviors, and other dimensions to uncover the true causes of the event and provide insights for investors.
GateNews44m ago
Pi Network price increased by 25% over the week, with bullish momentum continuing strong before Pi Day
Pi Network's token PI has recently experienced a slight increase, with event-driven demand expectations. Technical analysis shows that PI is stable at the key support level of $0.21 and plans to maintain a positive sentiment before Pi Day (March 14), which could drive the price to continue rising. Analysts indicate that PI needs to break through $0.2396 to confirm upward momentum and move toward the 200-day moving average target of $0.2854.
MarketWhisper1h ago
Bitcoin Shows ‘Tentative Signs of Improvement’ as Iran Conflict Fears Wane
In brief
Bitcoin has climbed more than 4% to roughly $69,100 as risk assets steadied after oil retreated from a spike tied to Middle East tensions.
Futures open interest and aggressive buying in perpetual markets suggest traders are cautiously returning to leveraged positions.
U.S. spot B
Decrypt2h ago