In brief
- Bitcoin bounced to above $69K after testing $60K lows, up 3.69% in 24 hours, but the daily chart shows strong bearish momentum.
- On Myriad, traders are pricing in 55% odds that Bitcoin touches $55K before recovering, reflecting persistent bearish sentiment.
- The Crypto Fear and Greed Index sits at 8—nearly an all-time low and in “extreme fear” territory.
The crypto market is still in full panic mode. The Crypto Fear and Greed Index sits at 8 points—extreme fear territory—just barely above the all-time low of 5 hit on February 6.
But even in a sea of red, there’s some hopium for degens to breathe. The global crypto market cap ticked up 4.3% today to $2.36 trillion, but that’s a modest bounce considering that around $2 trillion have been wiped out in recent weeks.
On Myriad, a prediction market developed by Decrypt’s parent company Dastan, traders are pricing in 55% odds that Bitcoin touches $55,000 before recovering to $84,000. That’s not exactly a vote of confidence. Meanwhile, British multinational bank Standard Chartered slashed its Bitcoin target from $300,000 to the $100K zone, warning the coin could crash to $50K first. Bitcoin ETF outflows also shed $410 million yesterday, as traders show even the most bullish can panic when red candlesticks populate their charts.
Today’s CPI data release could decide whether this bounce extends or collapses. Analysts expect inflation at 2.5% year-over-year. A hot print sends Bitcoin toward $60K. A cool one might give bulls breathing room.
Bitcoin (BTC) price: The bounce looks weak
Bitcoin rallied from $68,248 to an intraday high of $69,450 before settling around $69,321—up 3.69% in 24 hours. Not bad on the surface. But the bigger picture suggests you may want to keep your champagne on ice for a bit longer.
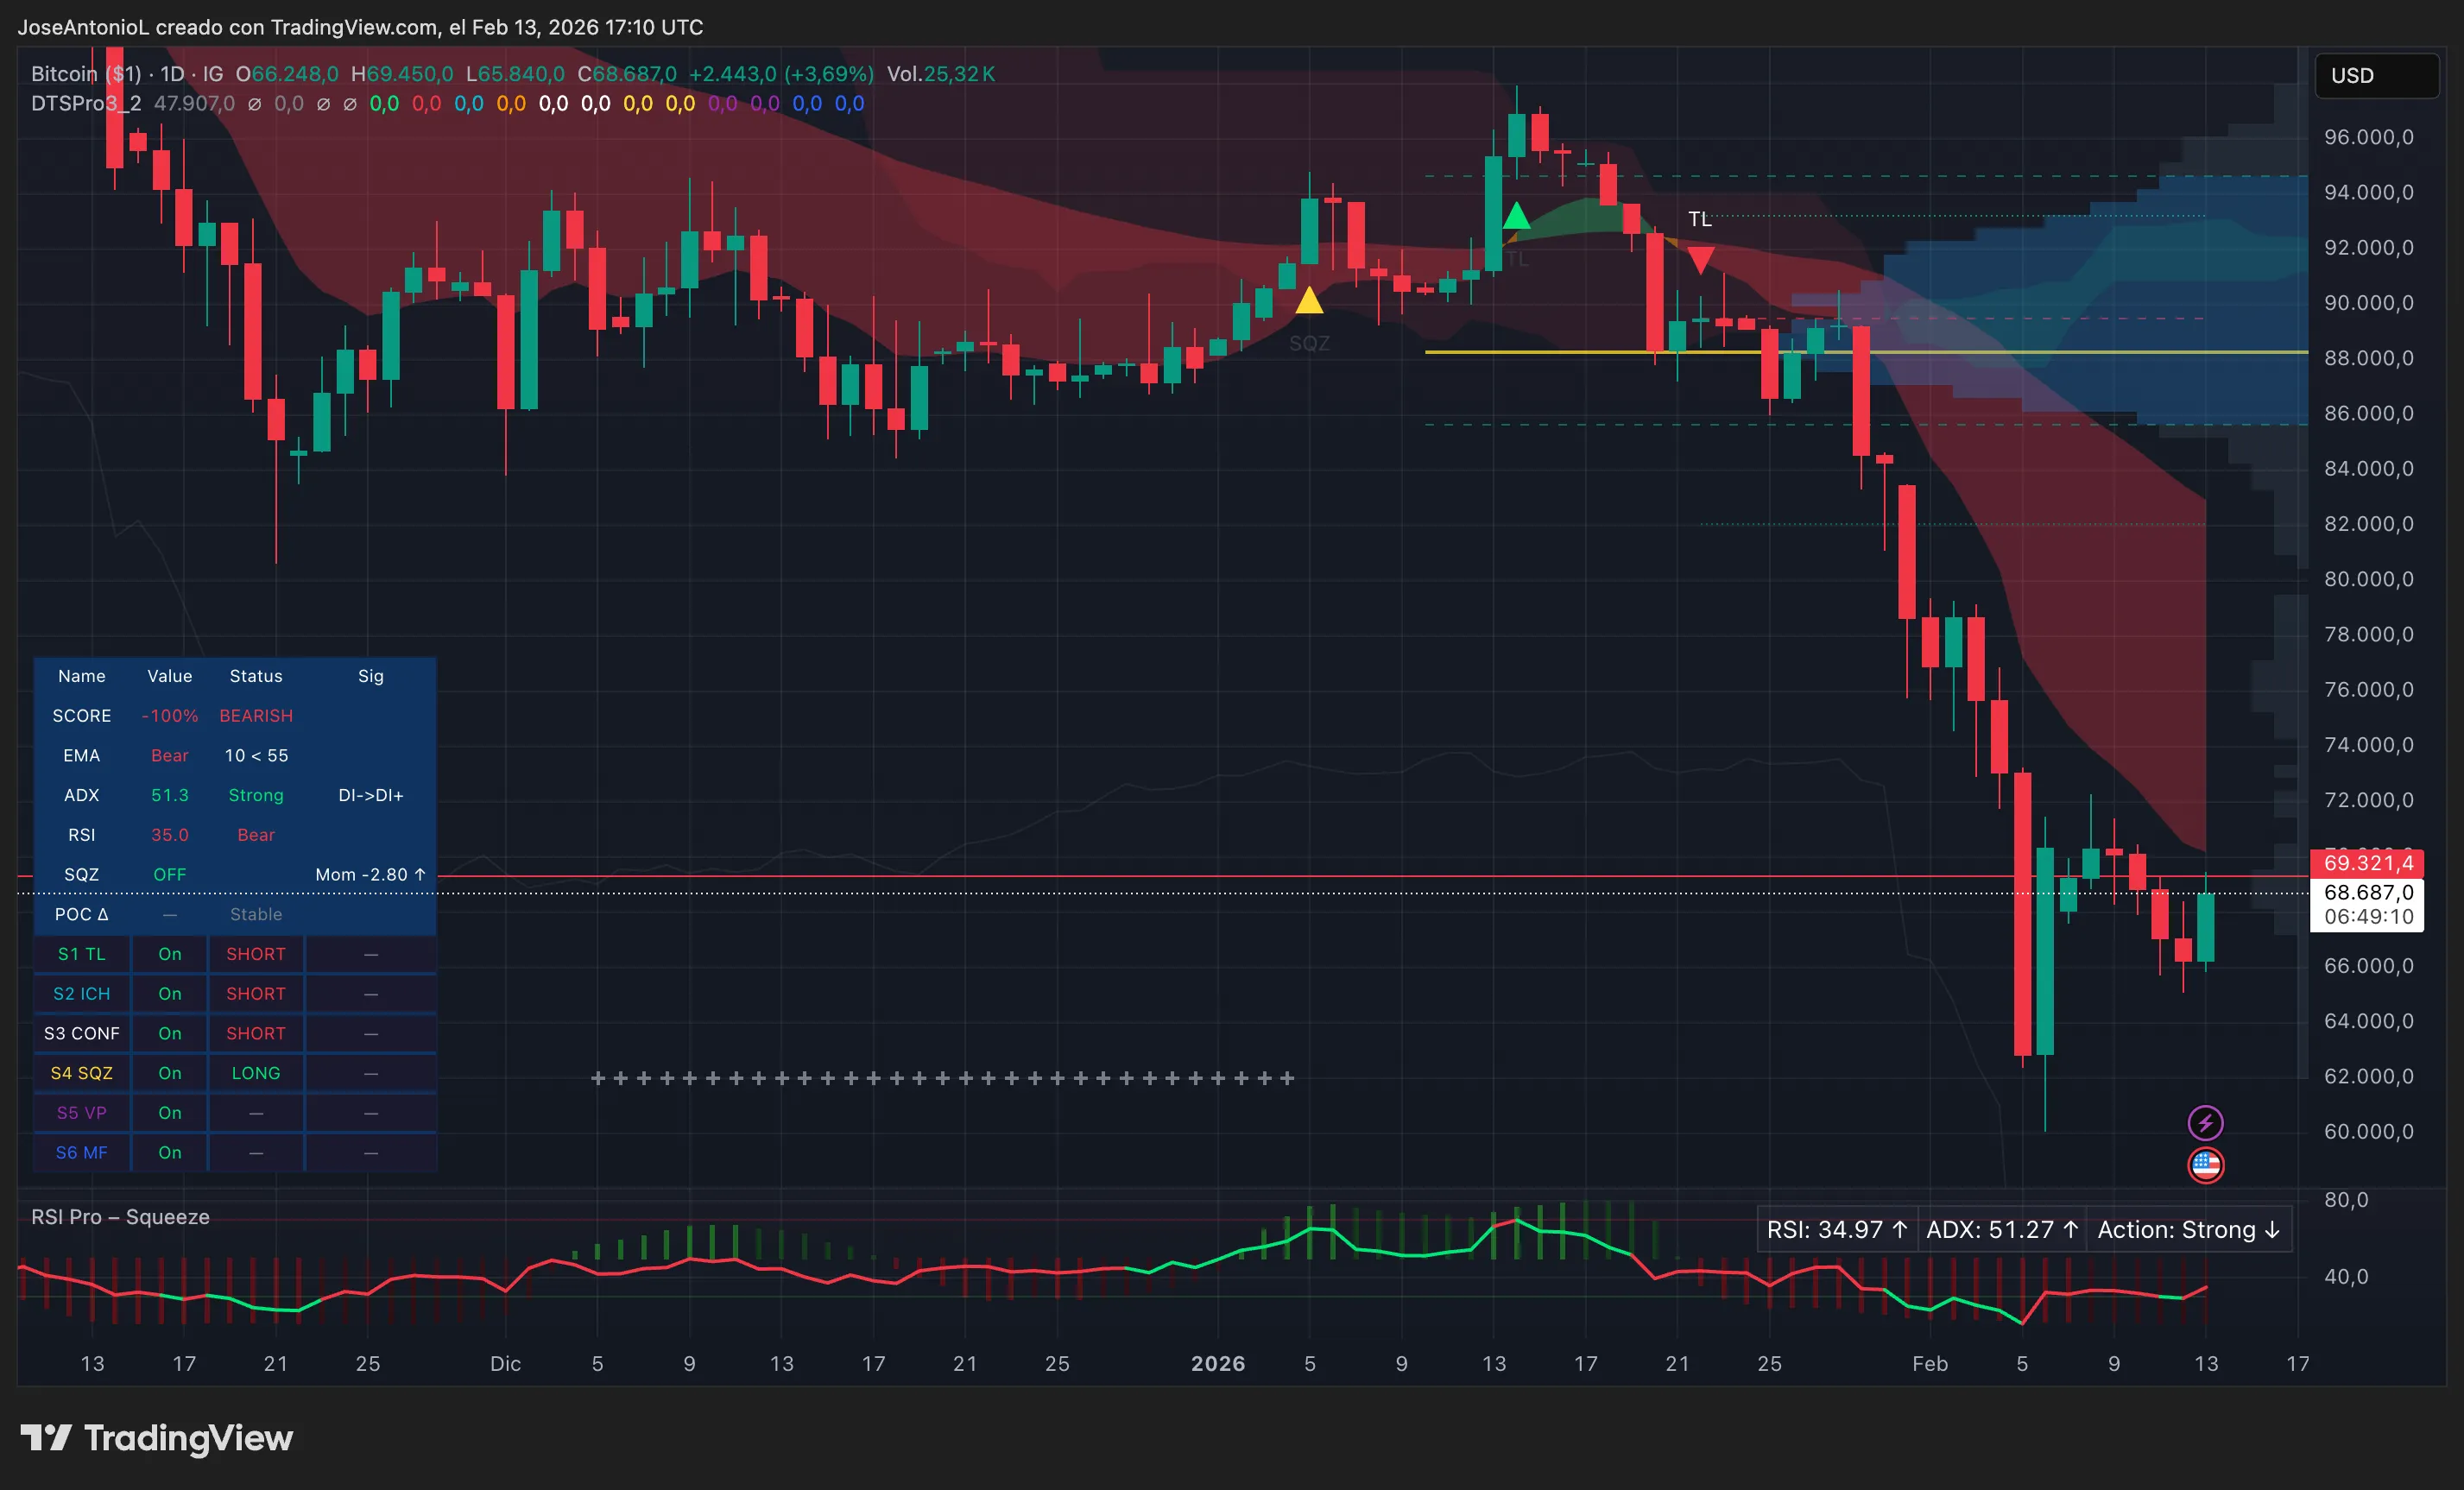
Bitcoin (BTC) price data. Image: Tradingview
The Average Directional Index, or ADX, sits at 51.3, signaling a strong bearish trend. ADX measures trend strength regardless of direction—readings above 25 confirm a trending market, and above 50 means conviction.
This recent bounce may lower the ADX numbers a bit, but it doesn’t mean Bitcoin has magically turned bullish. It just means you cannot be permabear, and it’s reasonable to expect “FUD” or “FOMO” episodes inside of solid trends.
The Relative Strength Index, or RSI, is at 35.0, firmly in bearish territory. RSI measures momentum from 0 to 100, with below 30 suggesting oversold conditions and above 70 overbought. At 35, Bitcoin has bounced off the $60K lows but remains far from neutral (50). Traders typically wait for RSI to break above 50 before calling a momentum shift. We’re not there yet.
The 50-day Exponential Moving Average, or EMA, trades well below the 200-day EMA—a classic bearish setup. EMAs help identify trend direction using weighted price averages. When the short-term EMA sits below the long-term one, recent price action is weaker than the broader trend. That creates a bearish structure.
Overall, Bitcoin bulls need another February 6-style candlestick—but bigger. A good second option could be a series of green daily closes pushing above $80,000, which would signal bulls are back. Until then, this is more likely noise inside a downtrend.
The 4-hour chart offers slightly better conditions for day traders and quick leverage plays.
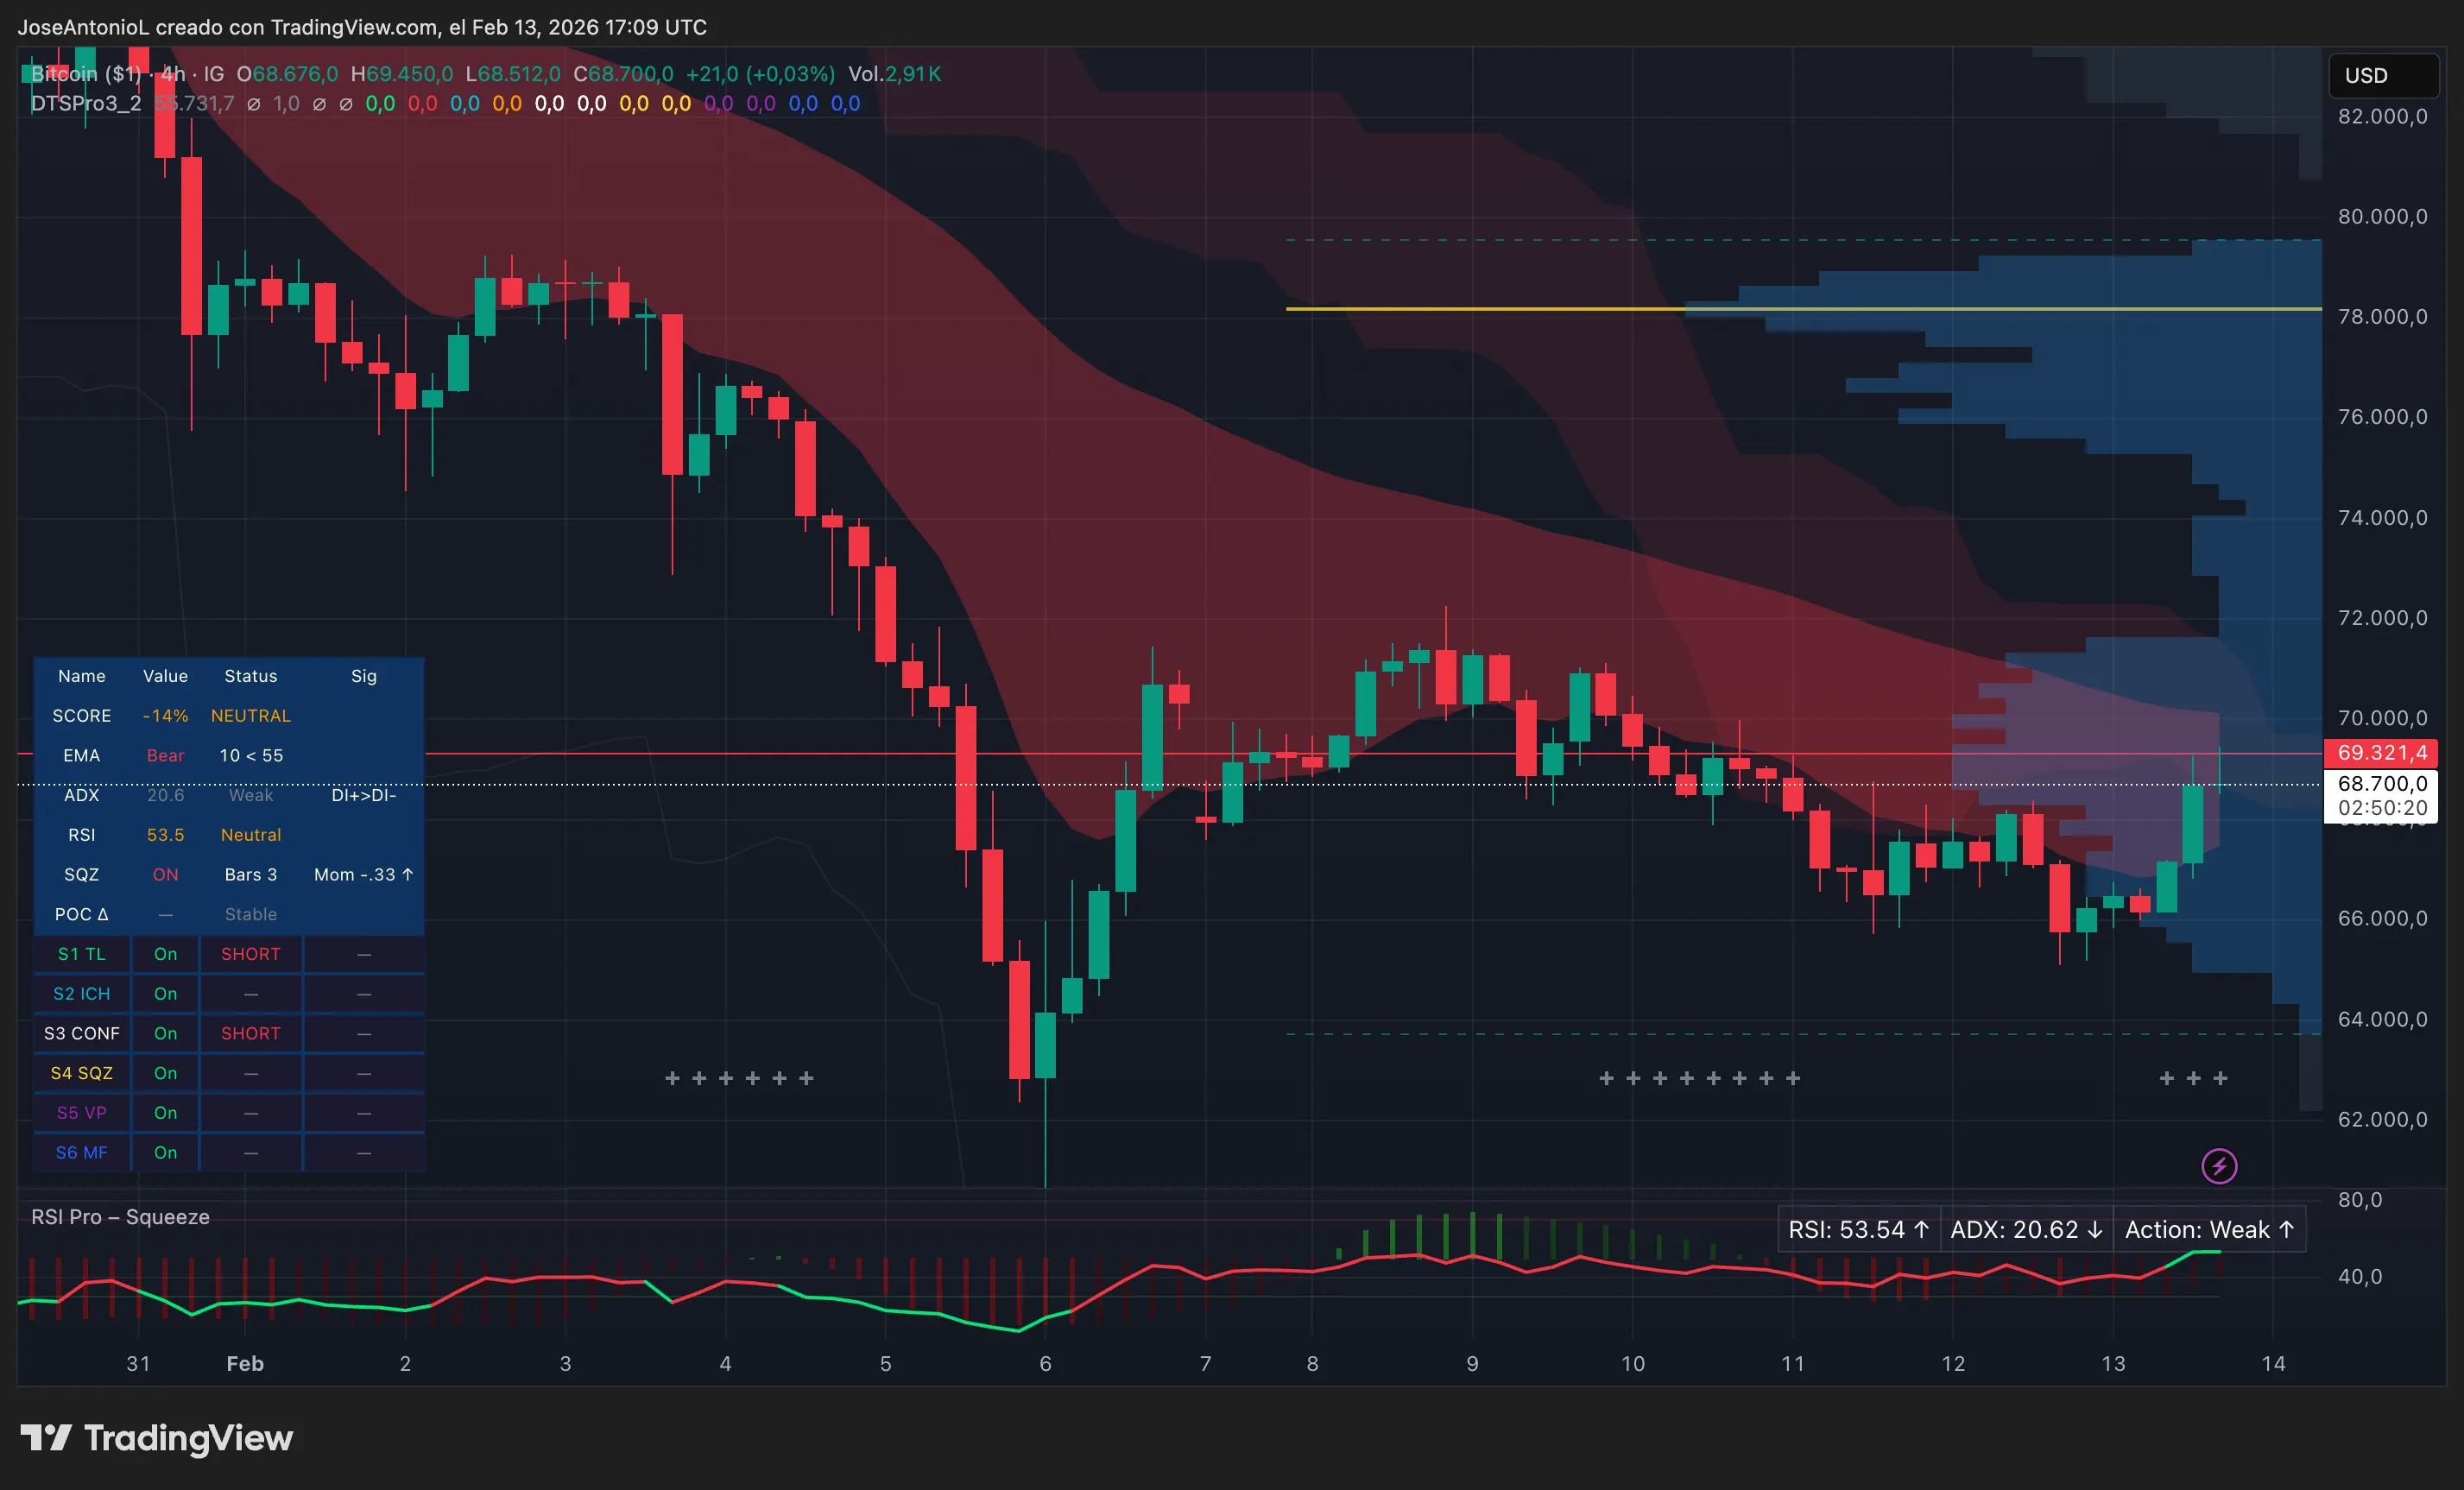
Bitcoin (BTC) price data. Image: Tradingview
The 4-hour ADX sits at 20.6 (weak, no clear trend) which is good for traders placing positions as Bitcoin bounces around between established supports and resistances. RSI at 53.6 is also neutral, and the Squeeze Momentum Indicator is “on,” suggesting compression before a move. But with the daily trend bearish, any 4-hour rally likely hits resistance hard. If you’re swing trading or holding, the daily trend is your boss.
This bounce isn’t enough to signal a trend reversal. The daily chart shows strong bearish momentum (ADX 51.3), weak RSI (35.0), and bearish EMAs. The 4-hour chart might let day traders scalp a move to $70K-$72K, but swing traders and holders would likely be wise to remain cautious.
Disclaimer: The information on this page may come from third parties and does not represent the views or opinions of Gate. The content displayed on this page is for reference only and does not constitute any financial, investment, or legal advice. Gate does not guarantee the accuracy or completeness of the information and shall not be liable for any losses arising from the use of this information. Virtual asset investments carry high risks and are subject to significant price volatility. You may lose all of your invested principal. Please fully understand the relevant risks and make prudent decisions based on your own financial situation and risk tolerance. For details, please refer to
Disclaimer.
Related Articles
In the past hour, the entire network has liquidated $90.08 million, and crude oil futures contracts have liquidated $29.2 million.
Gate News Report, March 9th, Coinglass data shows that in the past hour, the total liquidation across the entire network reached $90,084,300, with long positions liquidated at $43,935,600 and short positions at $46,148,700. By asset type, XYZ:CL (Crude Oil Futures Contract) liquidation was $29.2 million, and BTC liquidation was $22.12 million.
GateNews1m ago
Bitcoin Price Bounces, But Bears Are Still in Control: Analysis
In brief
Bitcoin is up 4.78% today trading at $69,128.
Last week's apparent triangle breakout closed as a massive bullish wick — a classic false breakout signal.
On Myriad, prediction market traders are split among bulls and bears, with no clear consensus on which way the squeeze
Decrypt21m ago
BTC 15-minute increase of 1.42%: On-chain capital inflow and technical breakout points resonate to trigger buying interest
From 19:15 to 19:30 on March 9, 2026 (UTC), the BTC price experienced a 15-minute return of +1.42%, with trading ranges between 68,377.3 and 69,365.3 USDT, and a volatility of 1.44%. This fluctuation far exceeds the regular intraday volatility levels, with market attention significantly heightened, and short-term buying surges intensifying the volatility.
The main driver of this movement was net inflow of on-chain funds, triggered by large transfers from major holder accounts, along with buy orders breaking through key technical resistance levels.
GateNews30m ago
Bitcoin Leads $619M Weekly Inflows Amid Geopolitical Jitters and Oil-Driven Pullback
The digital asset market showed a strange kind of calm last week, not reckless, not euphoric, just strangely stubborn. According to CoinShares, investment products tied to cryptocurrencies pulled in a net US$619 million, a sign that, even amid geopolitical jitters tied to Iran, a meaningful chunk of
BlockChainReporter56m ago