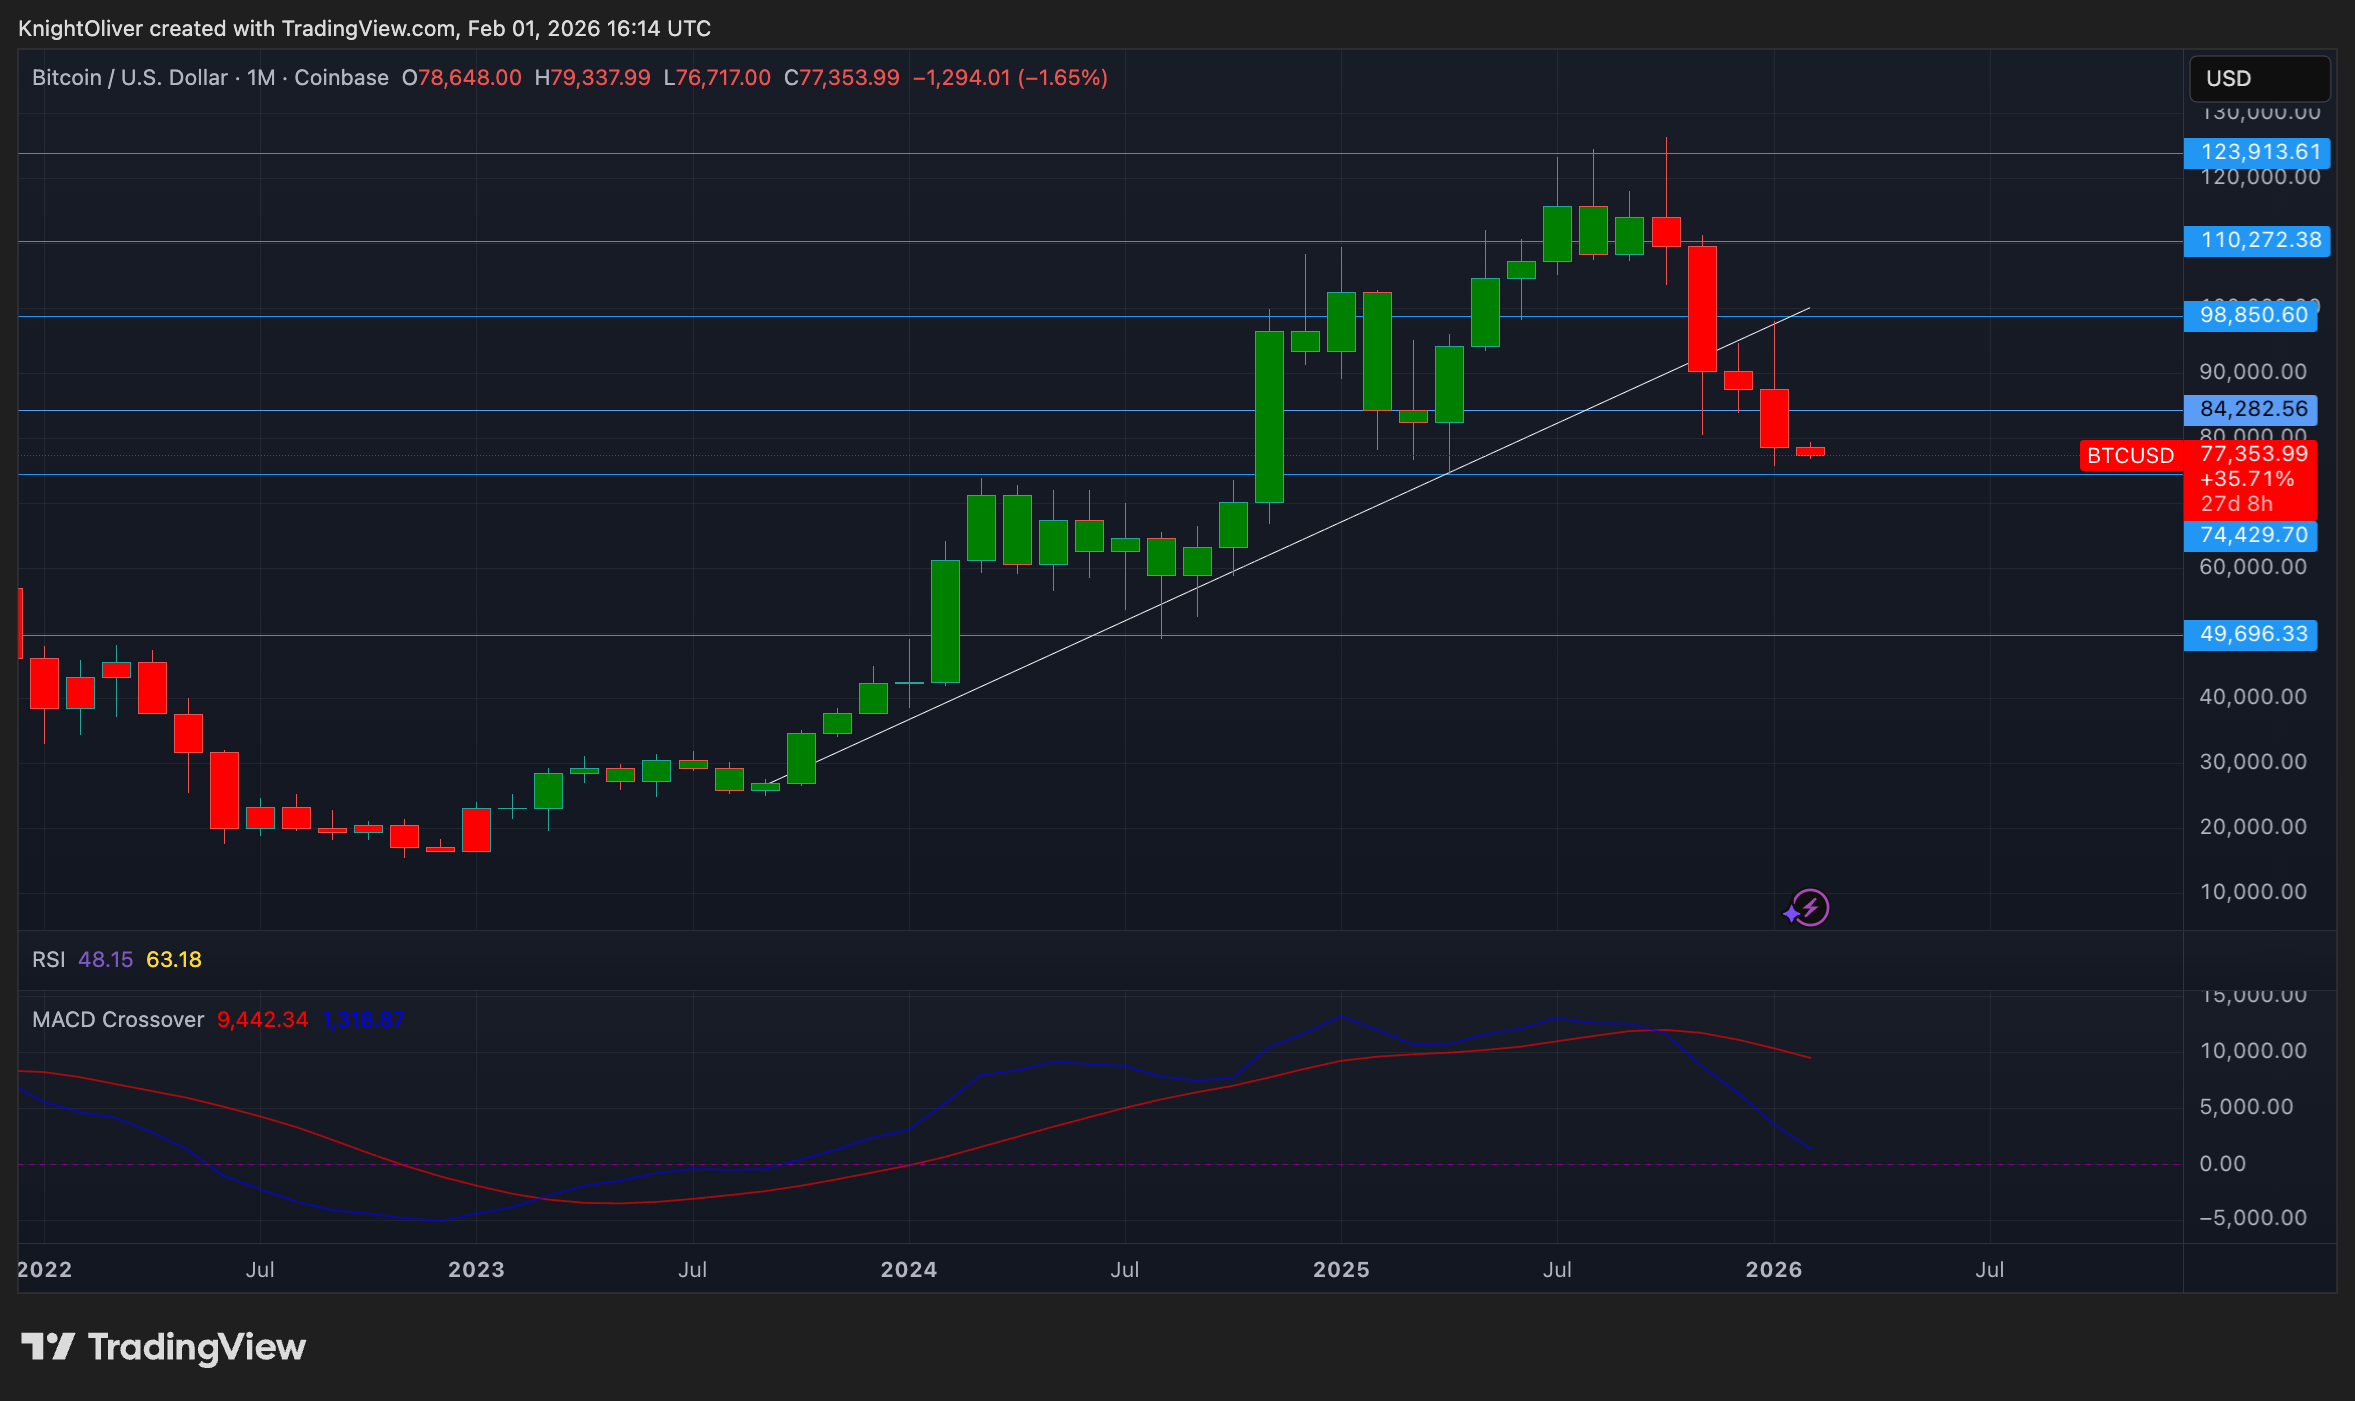
Bitcoin experienced a sharp decline over the weekend, dropping below $78,000 and triggering a wave of liquidations; former NYSE Arca options trader Eric Crown warns that technical indicators are turning fully bearish, and BTC may further decline to the $50,000–$60,000 range.
(Background recap: Bitcoin retreated to $87,000, Polymarket: 80% chance of BTC returning to six figures in 2026)
(Additional context: 6.4 million Bitcoins hanging in the balance: MicroStrategy’s life-and-death gamble)
Table of Contents
- The bulls’ “hopium” may have come to an end
- Options market confirms bearish sentiment
- Multiple technical warning signs light up
- Decoupling from traditional markets: end-of-cycle warning signals
- $50,000–$60,000: the next target zone?
Bitcoin’s price saw a dramatic pullback over the weekend, briefly falling below $78,000, marking the lowest level since April this year. Profit-taking sell-offs and continuously shrinking liquidity interacted to accelerate the decline, compounded by a severe lack of new buying interest.
Traders point out that this rally, initially supported by corporate demand—especially MicroStrategy’s ongoing Bitcoin purchases—has now lost momentum, exposing the market to forced liquidations and derivatives clearing pressures.
The bulls’ “hopium” may have come to an end
For some market analysts, Saturday’s sharp drop confirmed a bearish trend that had been brewing for months. Eric Crown, a former NYSE Arca options trader with over 200,000 followers, has been arguing since late October that Bitcoin is in a sideways, weak phase, and that market hopes for a return to all-time highs or a rotation of funds from precious metals back into crypto are just wishful thinking—what he calls “hopium.”
He further emphasizes that recent price movements may only be part of a larger correction pattern, stating:
Since late October, my view has been that BTC is in a sideways, bearish phase… I don’t believe $80,000 will be the overall bottom for Bitcoin.
Options market confirms bearish sentiment
Data from the options market also supports this bearish mood. An increasing number of traders are betting on Bitcoin falling below $75,000, while selling off call options at the $100,000 strike. On Deribit, open interest in Bitcoin put options with a strike price of $75,000 has risen to $1.159 billion, nearly matching the $1.168 billion open interest in call options at $100,000.
The narrowing gap between the two indicates that market hedging against downside risk is rapidly intensifying.
Multiple technical warning signs light up
Crown points out several technical indicators historically associated with deeper corrections:
- Monthly MACD death cross: appearing in November, a rare signal that has preceded long-term downtrends in past cycles.
- Weekly 21 vs. 55 EMA turning bearish: recently falling into a bearish alignment, which often leads to months of losses.
- 2025-year line forming a “shooting star”: a candlestick pattern often signaling a medium-term reversal.
Decoupling from traditional markets: end-of-cycle warning signals
Adding to the concern, Bitcoin has been diverging from traditional financial markets since October—weakening even as stocks and other risk assets remain strong. Crown views this as typical end-of-cycle risk-off behavior:
“Generally, investors tend to sell the most speculative assets first.”
Beyond technical factors, Crown also points to the speculative deleveraging triggered by the October crash: a large-scale wipeout of leveraged altcoin positions, with traders still hesitant to rebuild positions at high levels.
$50,000–$60,000: the next target zone?
Although Crown’s outlook isn’t as pessimistic as some ultra-bearish cycle theorists, he still believes Bitcoin could further decline to the $50,000–$60,000 range before stabilizing. He states that this price zone is where he is considering adding long-term positions and views the current market environment as a potential “value accumulation phase,” rather than the end of a major crypto cycle.

Disclaimer: The information on this page may come from third parties and does not represent the views or opinions of Gate. The content displayed on this page is for reference only and does not constitute any financial, investment, or legal advice. Gate does not guarantee the accuracy or completeness of the information and shall not be liable for any losses arising from the use of this information. Virtual asset investments carry high risks and are subject to significant price volatility. You may lose all of your invested principal. Please fully understand the relevant risks and make prudent decisions based on your own financial situation and risk tolerance. For details, please refer to
Disclaimer.
Related Articles
Bitcoin returns to $70,000: Geopolitical conflict concerns ease, ETF fund inflows continue to drive BTC rebound
On March 10th, Bitcoin broke through $70,000 during the East Asian trading session, completing a recovery after the weekend sell-off. As volatility in the energy markets eased, selling pressure on risk assets diminished. Market data shows that institutional capital inflows continue to support Bitcoin, investor sentiment is improving, and short-term upside potential is increasing.
GateNews14m ago
XRP Today News: XRP Whale Accumulates 210 Million Tokens, Market Compression Range Indicates a Major Move
XRP has been under continuous pressure this year, but large whales holding between 1 million and 100 million XRP have recently increased their holdings by approximately 210 million coins, indicating that major investors are quietly building positions during the downturn. On the technical side, XRP is forming a contracting wedge between the support at $1.30 and resistance at $1.50, suggesting a potential significant directional move. The low liquidity environment could both amplify gains and increase downside risks. Watching whether the $1.30 support can hold is crucial.
MarketWhisper32m ago
Peter Brandt releases Bitcoin chart analysis showing a short-term bullish pattern
Gate News Announcement, March 10, renowned trader and chart analyst Peter Brandt released a Bitcoin chart analysis. Peter Brandt successfully predicted the 2018 Bitcoin crash. The chart shows the "Big Banana" chart displaying a large upward curved channel on the long-term weekly chart (2014-2027); the "Small Banana" chart shows a smaller similar curve currently forming near $69,000 on the daily chart. The arrows in the chart clearly point upward, indicating higher targets.
GateNews53m ago
ETH 15-minute increase of 1.32%: Major capital inflows and technical rebound resonate to drive the rise
2026-03-10 02:30 to 2026-03-10 02:45 (UTC), ETH's 15-minute return reached +1.32%, with a price range of 2020.97 to 2054.01 USDT, and an amplitude of 1.63%, showing a significant anomaly. Market attention increased accordingly, volatility intensified, and short-term trading activity rose.
The main driver of this anomaly was the concentration of large on-chain funds buying in, especially multiple large wallets making cumulative large purchases of over 3000 ETH near key support levels, directly pushing up the ETH price.
GateNews1h ago
BTC Price Fluctuation Analysis
# BTC Price Movement Deep Attribution Report for March 10, 2026, 02:30-02:45 (UTC)
## 1. Event Overview
Between 02:30 and 02:45 (UTC) on March 10, 2026, Bitcoin (BTC) experienced a significant price movement, with a return of +1.39%. The price fluctuations during this time window exceeded normal ranges, attracting market attention. This report will conduct a comprehensive attribution analysis based on on-chain data, market conditions, macroeconomic environment, trading behaviors, and other dimensions to uncover the true causes of the event and provide insights for investors.
GateNews1h ago
Pi Network price increased by 25% over the week, with bullish momentum continuing strong before Pi Day
Pi Network's token PI has recently experienced a slight increase, with event-driven demand expectations. Technical analysis shows that PI is stable at the key support level of $0.21 and plans to maintain a positive sentiment before Pi Day (March 14), which could drive the price to continue rising. Analysts indicate that PI needs to break through $0.2396 to confirm upward momentum and move toward the 200-day moving average target of $0.2854.
MarketWhisper1h ago