
Axelar price moved sharply higher today, posting a gain of more than 20% and extending a rally that has been building for several sessions. AXL price strength has caught attention because it comes after months of persistent weakness. The move looks impressive on the surface, yet the broader chart suggests caution may still be warranted.
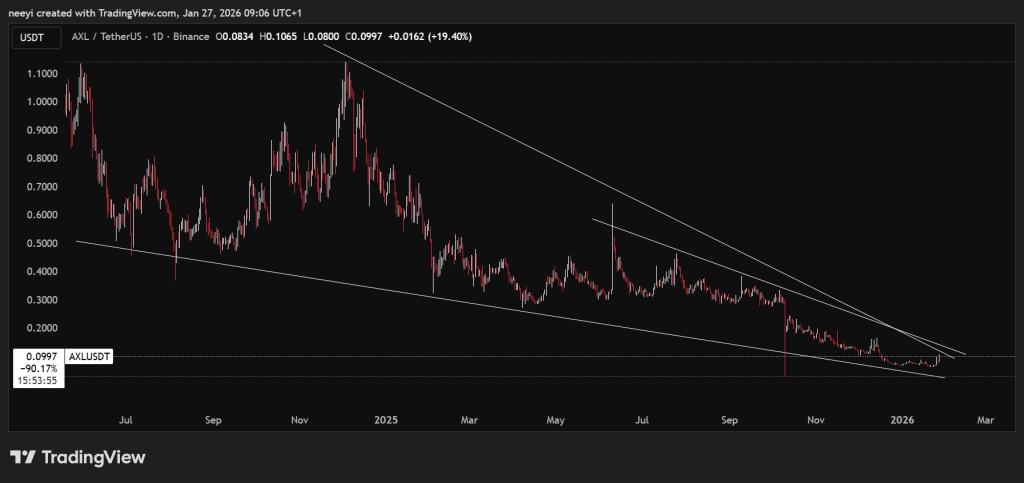
AXL price has been locked in a broader downtrend since March 2024, with lower highs defining price action for nearly 2 years. The recent push higher has not erased that structure. Instead, price continues to trade inside a long standing descending wedge that has capped every recovery attempt so far.
Short term momentum can feel convincing, especially after extended declines, but structure often tells a more sober story. Axelar price is still reacting within boundaries that have controlled it for months.
- Axelar Developments That May Have Sparked Renewed Interest
- Infrastructure Progress Adds To The AXL Price Narrative
- AXL Price Still Trades Inside A Descending Wedge
Axelar Developments That May Have Sparked Renewed Interest
Axelar activity has picked up since late 2025, and that timing lines up with the gradual improvement in AXL price action. One major catalyst was the integration of Axelar with Hedera, which connected Hedera to more than 60 chains using Axelar’s General Message Passing technology. That move positioned Axelar as a core interoperability layer for Hedera based applications.
Another key shift came when Common Prefix stepped in to take stewardship over Axelar’s technology and long term direction. The group outlined a 2026 roadmap centered on institutional readiness, co staking with blue chip assets, and gasless bridging. The roadmap also signaled a tighter focus on high value ecosystems such as XRPL, Solana, Ethereum, and Sui.
These changes helped flip sentiment after uncertainty surrounding leadership transitions earlier in the cycle. The sequence created a setup where fear cooled just as a clearer long term plan emerged.
Infrastructure Progress Adds To The AXL Price Narrative
Additional developments reinforced the Axelar price story into early 2026. Developer focused updates highlighted easier access to Axelar infrastructure, including RPC support from providers like GetBlock. That lowered friction for teams building cross chain products and strengthened the idea that Axelar is positioning itself as more than a simple bridge.
Work around XRP related products and cross chain stablecoin infrastructure also resurfaced in recent discussions, helping frame Axelar as a potential backbone for future multichain finance. These narratives can support price moves, especially after prolonged consolidation.
AXL Price Still Trades Inside A Descending Wedge
Despite the improving narrative, AXL price analysis shows that the entire rally remains inside the descending wedge visible on the daily chart. Both resistance and support lines continue to compress price action. The current move has carried AXL price close to wedge resistance, which has rejected price repeatedly in the past.
XLM Price Chart
This is the critical point. Until AXL price delivers a decisive breakout above the wedge, the broader downtrend technically remains intact. Short term pumps inside declining structures often fade once resistance holds.
AXL price forecast scenarios hinge on how price behaves near the upper boundary of the wedge. A clean breakout, ideally supported by a strong January close on higher timeframes, would change the technical picture and open the door to larger upside targets later in the year.
Gold and Silver Just Suffered a $1.7 Trillion Flash Crash—Here’s What Really Happened_**
If resistance holds, however, price could roll over and continue the downtrend that has defined Axelar price since early 2024. That is why buying into strength near resistance can become a trap, especially when momentum cools quickly.
AXL price action right now is less about confirmation and more about testing. The coming sessions should clarify whether this rally represents the start of a structural shift or just another reaction move within a longer decline.
Disclaimer: The information on this page may come from third parties and does not represent the views or opinions of Gate. The content displayed on this page is for reference only and does not constitute any financial, investment, or legal advice. Gate does not guarantee the accuracy or completeness of the information and shall not be liable for any losses arising from the use of this information. Virtual asset investments carry high risks and are subject to significant price volatility. You may lose all of your invested principal. Please fully understand the relevant risks and make prudent decisions based on your own financial situation and risk tolerance. For details, please refer to
Disclaimer.
Related Articles
Bitcoin returns to $70,000: Geopolitical conflict concerns ease, ETF fund inflows continue to drive BTC rebound
On March 10th, Bitcoin broke through $70,000 during the East Asian trading session, completing a recovery after the weekend sell-off. As volatility in the energy markets eased, selling pressure on risk assets diminished. Market data shows that institutional capital inflows continue to support Bitcoin, investor sentiment is improving, and short-term upside potential is increasing.
GateNews6m ago
XRP Today News: XRP Whale Accumulates 210 Million Tokens, Market Compression Range Indicates a Major Move
XRP has been under continuous pressure this year, but large whales holding between 1 million and 100 million XRP have recently increased their holdings by approximately 210 million coins, indicating that major investors are quietly building positions during the downturn. On the technical side, XRP is forming a contracting wedge between the support at $1.30 and resistance at $1.50, suggesting a potential significant directional move. The low liquidity environment could both amplify gains and increase downside risks. Watching whether the $1.30 support can hold is crucial.
MarketWhisper24m ago
Peter Brandt releases Bitcoin chart analysis showing a short-term bullish pattern
Gate News Announcement, March 10, renowned trader and chart analyst Peter Brandt released a Bitcoin chart analysis. Peter Brandt successfully predicted the 2018 Bitcoin crash. The chart shows the "Big Banana" chart displaying a large upward curved channel on the long-term weekly chart (2014-2027); the "Small Banana" chart shows a smaller similar curve currently forming near $69,000 on the daily chart. The arrows in the chart clearly point upward, indicating higher targets.
GateNews45m ago
ETH 15-minute increase of 1.32%: Major capital inflows and technical rebound resonate to drive the rise
2026-03-10 02:30 to 2026-03-10 02:45 (UTC), ETH's 15-minute return reached +1.32%, with a price range of 2020.97 to 2054.01 USDT, and an amplitude of 1.63%, showing a significant anomaly. Market attention increased accordingly, volatility intensified, and short-term trading activity rose.
The main driver of this anomaly was the concentration of large on-chain funds buying in, especially multiple large wallets making cumulative large purchases of over 3000 ETH near key support levels, directly pushing up the ETH price.
GateNews52m ago
BTC Price Fluctuation Analysis
# BTC Price Movement Deep Attribution Report for March 10, 2026, 02:30-02:45 (UTC)
## 1. Event Overview
Between 02:30 and 02:45 (UTC) on March 10, 2026, Bitcoin (BTC) experienced a significant price movement, with a return of +1.39%. The price fluctuations during this time window exceeded normal ranges, attracting market attention. This report will conduct a comprehensive attribution analysis based on on-chain data, market conditions, macroeconomic environment, trading behaviors, and other dimensions to uncover the true causes of the event and provide insights for investors.
GateNews52m ago
Pi Network price increased by 25% over the week, with bullish momentum continuing strong before Pi Day
Pi Network's token PI has recently experienced a slight increase, with event-driven demand expectations. Technical analysis shows that PI is stable at the key support level of $0.21 and plans to maintain a positive sentiment before Pi Day (March 14), which could drive the price to continue rising. Analysts indicate that PI needs to break through $0.2396 to confirm upward momentum and move toward the 200-day moving average target of $0.2854.
MarketWhisper1h ago