HYPE, River, CHZ lead the altcoins. HYPE rises 14% breaking the trend line, RSI at 54 with room to 26.29. River hits a new high of $88, up 600% month-over-month, with Sun Yuchen investing 12 million, RSI at 75 overbought. CHZ up 4% testing resistance at 0.064.
HYPE Breaks Through Trend Line, RSI 54 with Sufficient Space
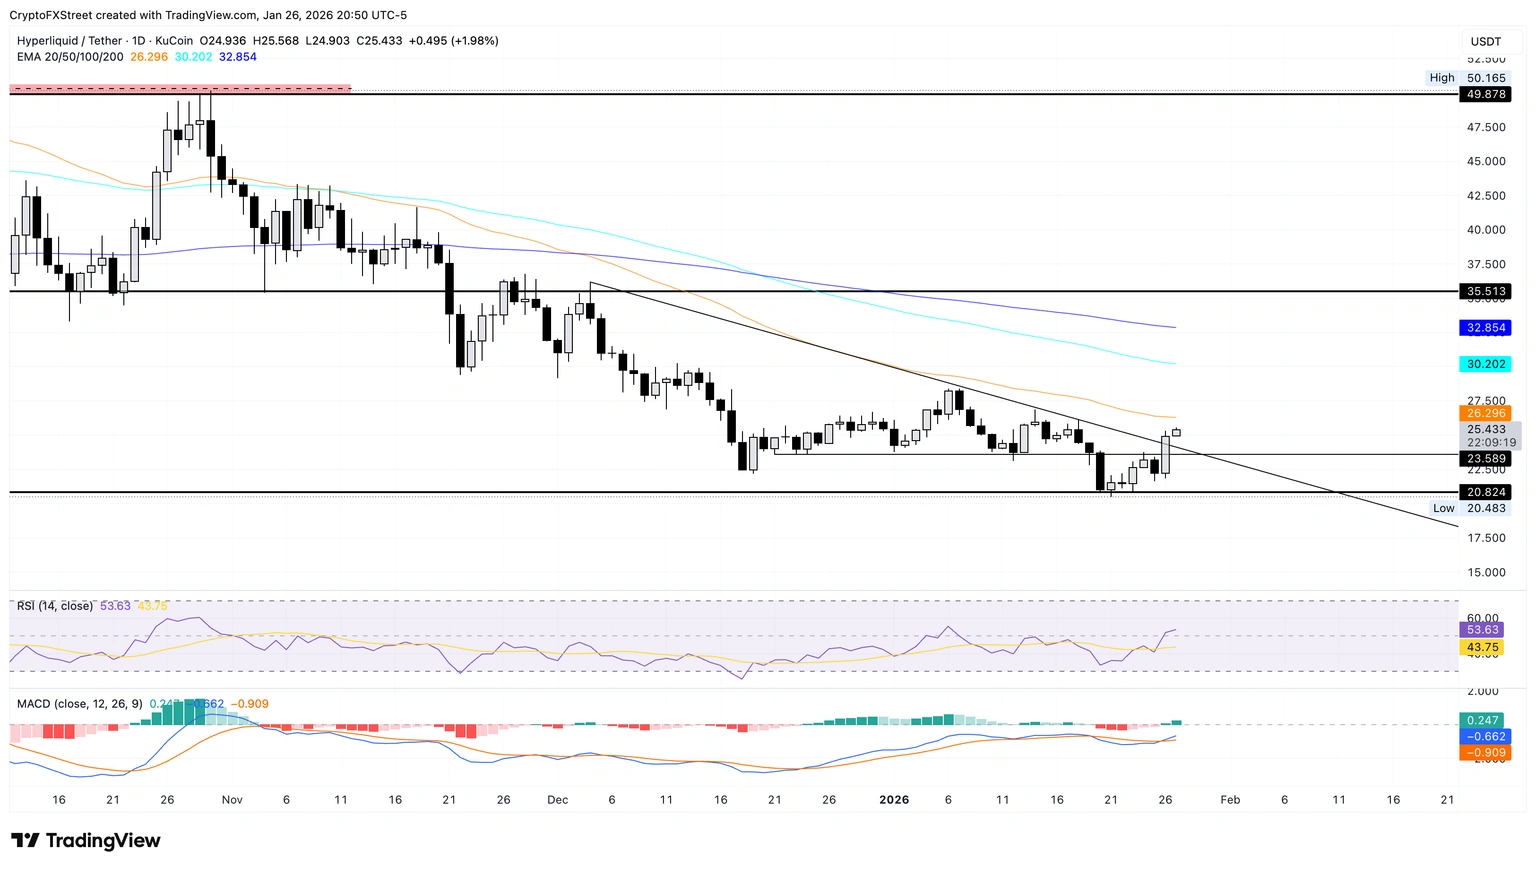
(Source: Trading View)
As of Tuesday’s report, Hyperliquid increased 2%, continuing the 12% gain from the previous day. The rebound price of HYPE tokens approaches the 50-day exponential moving average (EMA) at $26.29 but remains below the 100-day and 200-day EMAs, indicating a bearish trend. The recovery of this exchange token breaks the descending trend line connecting the highs of December 4 and January 18, alleviating negative factors. This breakout in technical analysis is highly significant, as it marks the destruction of the selling pressure structure and opens space for further upward movement.
Technical indicators on the daily chart reflect renewed bullish sentiment. The Relative Strength Index (RSI) is at 54, breaking above the midline, with room to rise before entering overbought territory. The Moving Average Convergence Divergence (MACD) experienced a bullish crossover on Monday, signaling a buy. A MACD bullish crossover occurs when the fast line crosses above the slow line, typically indicating the start of upward momentum. Coupled with RSI breaking above 50, the dual bullish signals strengthen the credibility of the breakout.
If HYPE breaks above the $26.29 50-day moving average, then the $30.20 100-day EMA and the $32.85 200-day EMA will act as resistance levels. These EMAs are densely packed, forming a resistance zone, and HYPE needs to break through them one by one to confirm a medium- to long-term trend reversal. On the other hand, the area near the trend line breakout point (around $23.58) remains a key support level, which was active in late December and early January.
HYPE Key Price Levels
Current Price: approximately $26
24-hour Change: +14%
Key Support: $23.58 (trend line breakout level)
Primary Resistance: $26.29 (50-day EMA)
Higher Resistance: $30.20 (100-day EMA), $32.85 (200-day EMA)
River Gains Sun Yuchen Backing, Up 600% Month-to-Date, RSI 75 Overbought
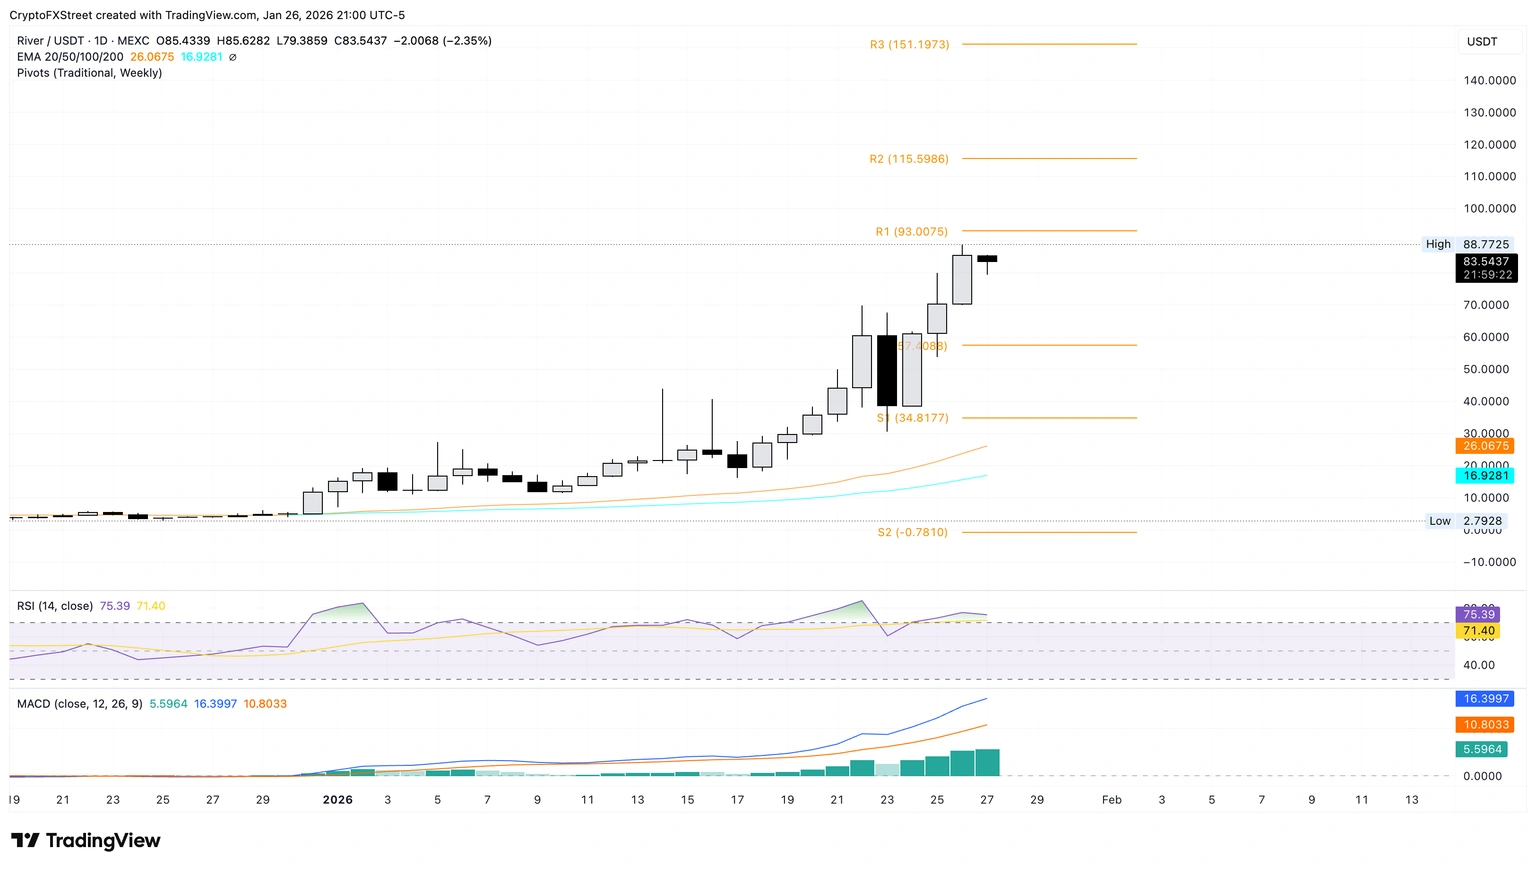
(Source: Trading View)
As of Tuesday’s report, River’s price retreated 2%, after a 21% surge on Monday. Over the past three days, boosted by positive news of Sun Yuchen, TronDAO, Arthur Hayes, and The Spartan Group investing 12 million USD, River’s price once soared over 100%. Such rapid increases driven by KOL endorsements and institutional investments are common in the altcoin market. When well-known figures publicly support a project, it often triggers a herd effect, pushing prices higher in the short term.
The immediate resistance for RIVER is at the pivot point R1 at $93, followed by the R2 pivot at $115. Pivot points are calculated based on the previous day’s high, low, and close, and are commonly used for intraday support and resistance levels. R1 and R2 represent the first and second resistance levels; breaking through these usually requires significant buying pressure.
On the daily chart, the RSI is at 75, indicating an overbought condition, suggesting buying pressure is nearing exhaustion. RSI above 70 is considered overbought, implying the price has risen too quickly in the short term and may face profit-taking pressure. Meanwhile, the MACD and its signal line continue their upward trend, with the histogram breaking above zero, indicating strong bullish momentum. The downside is that RIVER’s potential reversal could test the center pivot at $57, implying about a 30% decline from current levels.
Since January, River has gained over 600%, a remarkable but not uncommon feat in the altcoin market. During bull markets or narrative-driven rallies, small-cap altcoins can multiply in value within weeks or even days. However, such rapid surges are often accompanied by high volatility and risk of correction. When RSI hits 75, it generally signals a short-term pullback, and investors should be cautious about chasing the high.
Chiliz Rebounds from 0.050, Targeting 0.064 USD
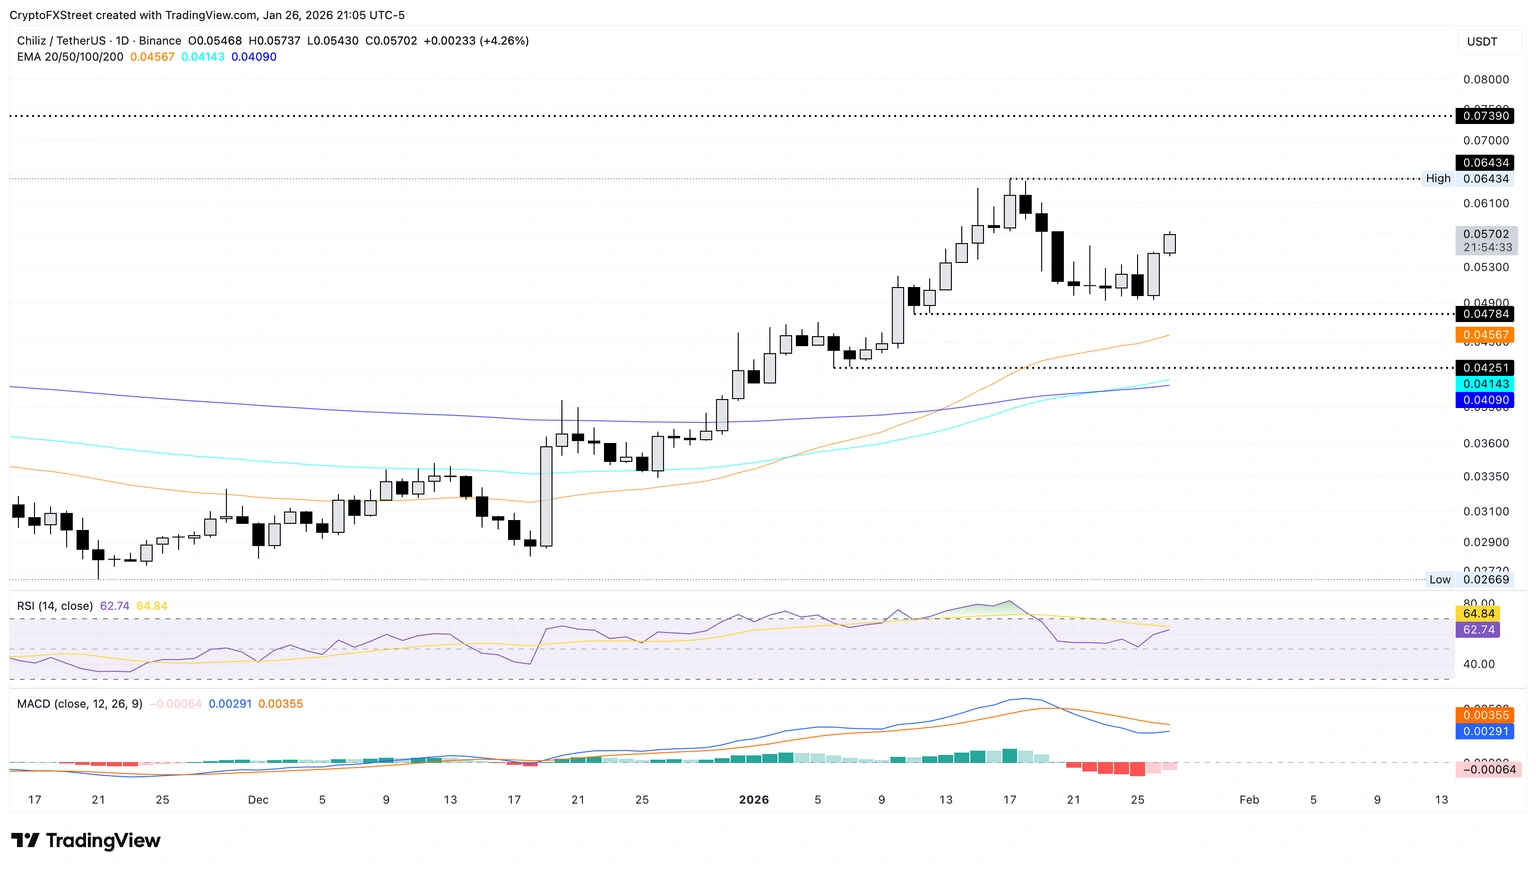
(Source: Trading View)
Chiliz’s price rebounded after touching the psychological level of $0.050 earlier this week, indicating a new recovery wave. As of the report, CHZ rose over 4% on Tuesday, continuing Monday’s 10% increase. The rebound may test the high of $0.064 from January 17. If it closes decisively above this high, it will open the door to the December 20 low at $0.073.
The RSI has risen to 62 and remains above the midline, showing demand is picking up but without overbought signals. Additionally, the MACD histogram has contracted and is approaching the signal line, indicating selling pressure is easing. The red MACD bars, representing downward momentum, are shrinking and nearing zero, suggesting bearish strength is weakening and a bullish green histogram may soon appear.
Below, the $0.050 psychological level remains a critical support for Chiliz. Psychological levels are often round numbers with large order clusters, forming natural support or resistance. As a “five-cent” figure, $0.050 has historically served as an important support level for CHZ.
Chiliz is the native token of Socios.com, a platform for sports and entertainment tokenization. The platform allows sports clubs to issue fan tokens, enabling fans to participate in club decisions and access exclusive benefits. CHZ’s price movements are often linked to major sports events and club partnership announcements. The current rebound may be related to upcoming sports seasons or new collaborations.
Disclaimer: The information on this page may come from third parties and does not represent the views or opinions of Gate. The content displayed on this page is for reference only and does not constitute any financial, investment, or legal advice. Gate does not guarantee the accuracy or completeness of the information and shall not be liable for any losses arising from the use of this information. Virtual asset investments carry high risks and are subject to significant price volatility. You may lose all of your invested principal. Please fully understand the relevant risks and make prudent decisions based on your own financial situation and risk tolerance. For details, please refer to
Disclaimer.
Related Articles
Long and short positions are balanced for the first time in history, revealing the true story of crypto deleveraging through Ethena's sharp decline
Author: Kyle Soska, Chief Investment Officer of Ramiel Capital
Compiled by: Felix, PANews
The crypto market has been in a risk-averse state for several months. Kyle Soska, Chief Investment Officer of Ramiel Capital, has been carefully analyzing various market data to look for signs of a potential market turnaround. This article will explore the market structure of perpetual contracts and combine
PANews10m ago
Bitcoin returns to $70,000: Geopolitical conflict concerns ease, ETF fund inflows continue to drive BTC rebound
On March 10th, Bitcoin broke through $70,000 during the East Asian trading session, completing a recovery after the weekend sell-off. As volatility in the energy markets eased, selling pressure on risk assets diminished. Market data shows that institutional capital inflows continue to support Bitcoin, investor sentiment is improving, and short-term upside potential is increasing.
GateNews56m ago
XRP Today News: XRP Whale Accumulates 210 Million Tokens, Market Compression Range Indicates a Major Move
XRP has been under continuous pressure this year, but large whales holding between 1 million and 100 million XRP have recently increased their holdings by approximately 210 million coins, indicating that major investors are quietly building positions during the downturn. On the technical side, XRP is forming a contracting wedge between the support at $1.30 and resistance at $1.50, suggesting a potential significant directional move. The low liquidity environment could both amplify gains and increase downside risks. Watching whether the $1.30 support can hold is crucial.
MarketWhisper1h ago
Peter Brandt releases Bitcoin chart analysis showing a short-term bullish pattern
Gate News Announcement, March 10, renowned trader and chart analyst Peter Brandt released a Bitcoin chart analysis. Peter Brandt successfully predicted the 2018 Bitcoin crash. The chart shows the "Big Banana" chart displaying a large upward curved channel on the long-term weekly chart (2014-2027); the "Small Banana" chart shows a smaller similar curve currently forming near $69,000 on the daily chart. The arrows in the chart clearly point upward, indicating higher targets.
GateNews1h ago
ETH 15-minute increase of 1.32%: Major capital inflows and technical rebound resonate to drive the rise
2026-03-10 02:30 to 2026-03-10 02:45 (UTC), ETH's 15-minute return reached +1.32%, with a price range of 2020.97 to 2054.01 USDT, and an amplitude of 1.63%, showing a significant anomaly. Market attention increased accordingly, volatility intensified, and short-term trading activity rose.
The main driver of this anomaly was the concentration of large on-chain funds buying in, especially multiple large wallets making cumulative large purchases of over 3000 ETH near key support levels, directly pushing up the ETH price.
GateNews1h ago
BTC Price Fluctuation Analysis
# BTC Price Movement Deep Attribution Report for March 10, 2026, 02:30-02:45 (UTC)
## 1. Event Overview
Between 02:30 and 02:45 (UTC) on March 10, 2026, Bitcoin (BTC) experienced a significant price movement, with a return of +1.39%. The price fluctuations during this time window exceeded normal ranges, attracting market attention. This report will conduct a comprehensive attribution analysis based on on-chain data, market conditions, macroeconomic environment, trading behaviors, and other dimensions to uncover the true causes of the event and provide insights for investors.
GateNews1h ago