
Key Takeaways
-
Near Protocol (NEAR) is gaining momentum, with price up nearly 18% over the past 30 days.
-
The daily chart shows a well-defined inverse head and shoulders pattern, signaling a potential bullish reversal.
-
NEAR is consolidating just below a key neckline resistance zone between $1.79 and $1.88.
-
Reclaiming the 100-day moving average near $1.96 would strengthen the bullish breakout case.
-
A confirmed breakout could open the door toward the $2.36 upside target.
-
Failure to hold above the $1.65 support zone may lead to further consolidation and delay the bullish setup.
The cryptocurrency market’s AI narrative has been gaining renewed traction, and Near Protocol (NEAR) is emerging as one of the standout performers. Over the past 30 days, NEAR has surged nearly 18%, and beyond the price action, the project continues to strengthen fundamentally.
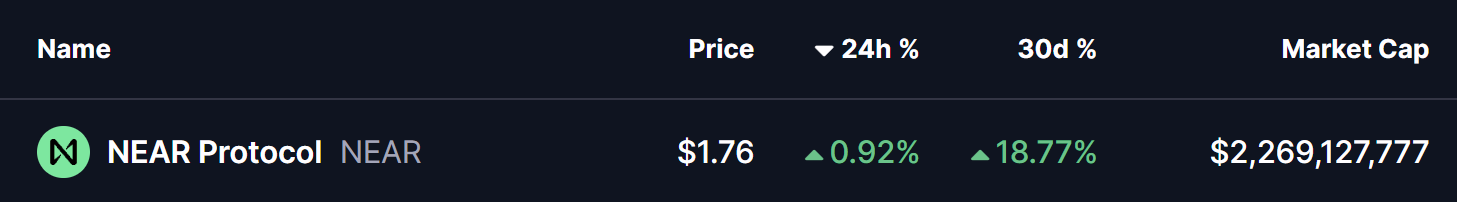
Source: Coinmarketcap
NEAR currently ranked as the third most active blockchain by 38.9 monthly users, trailing only BNB Chain and Solana — a signal that on-chain usage and developer activity remain strong.
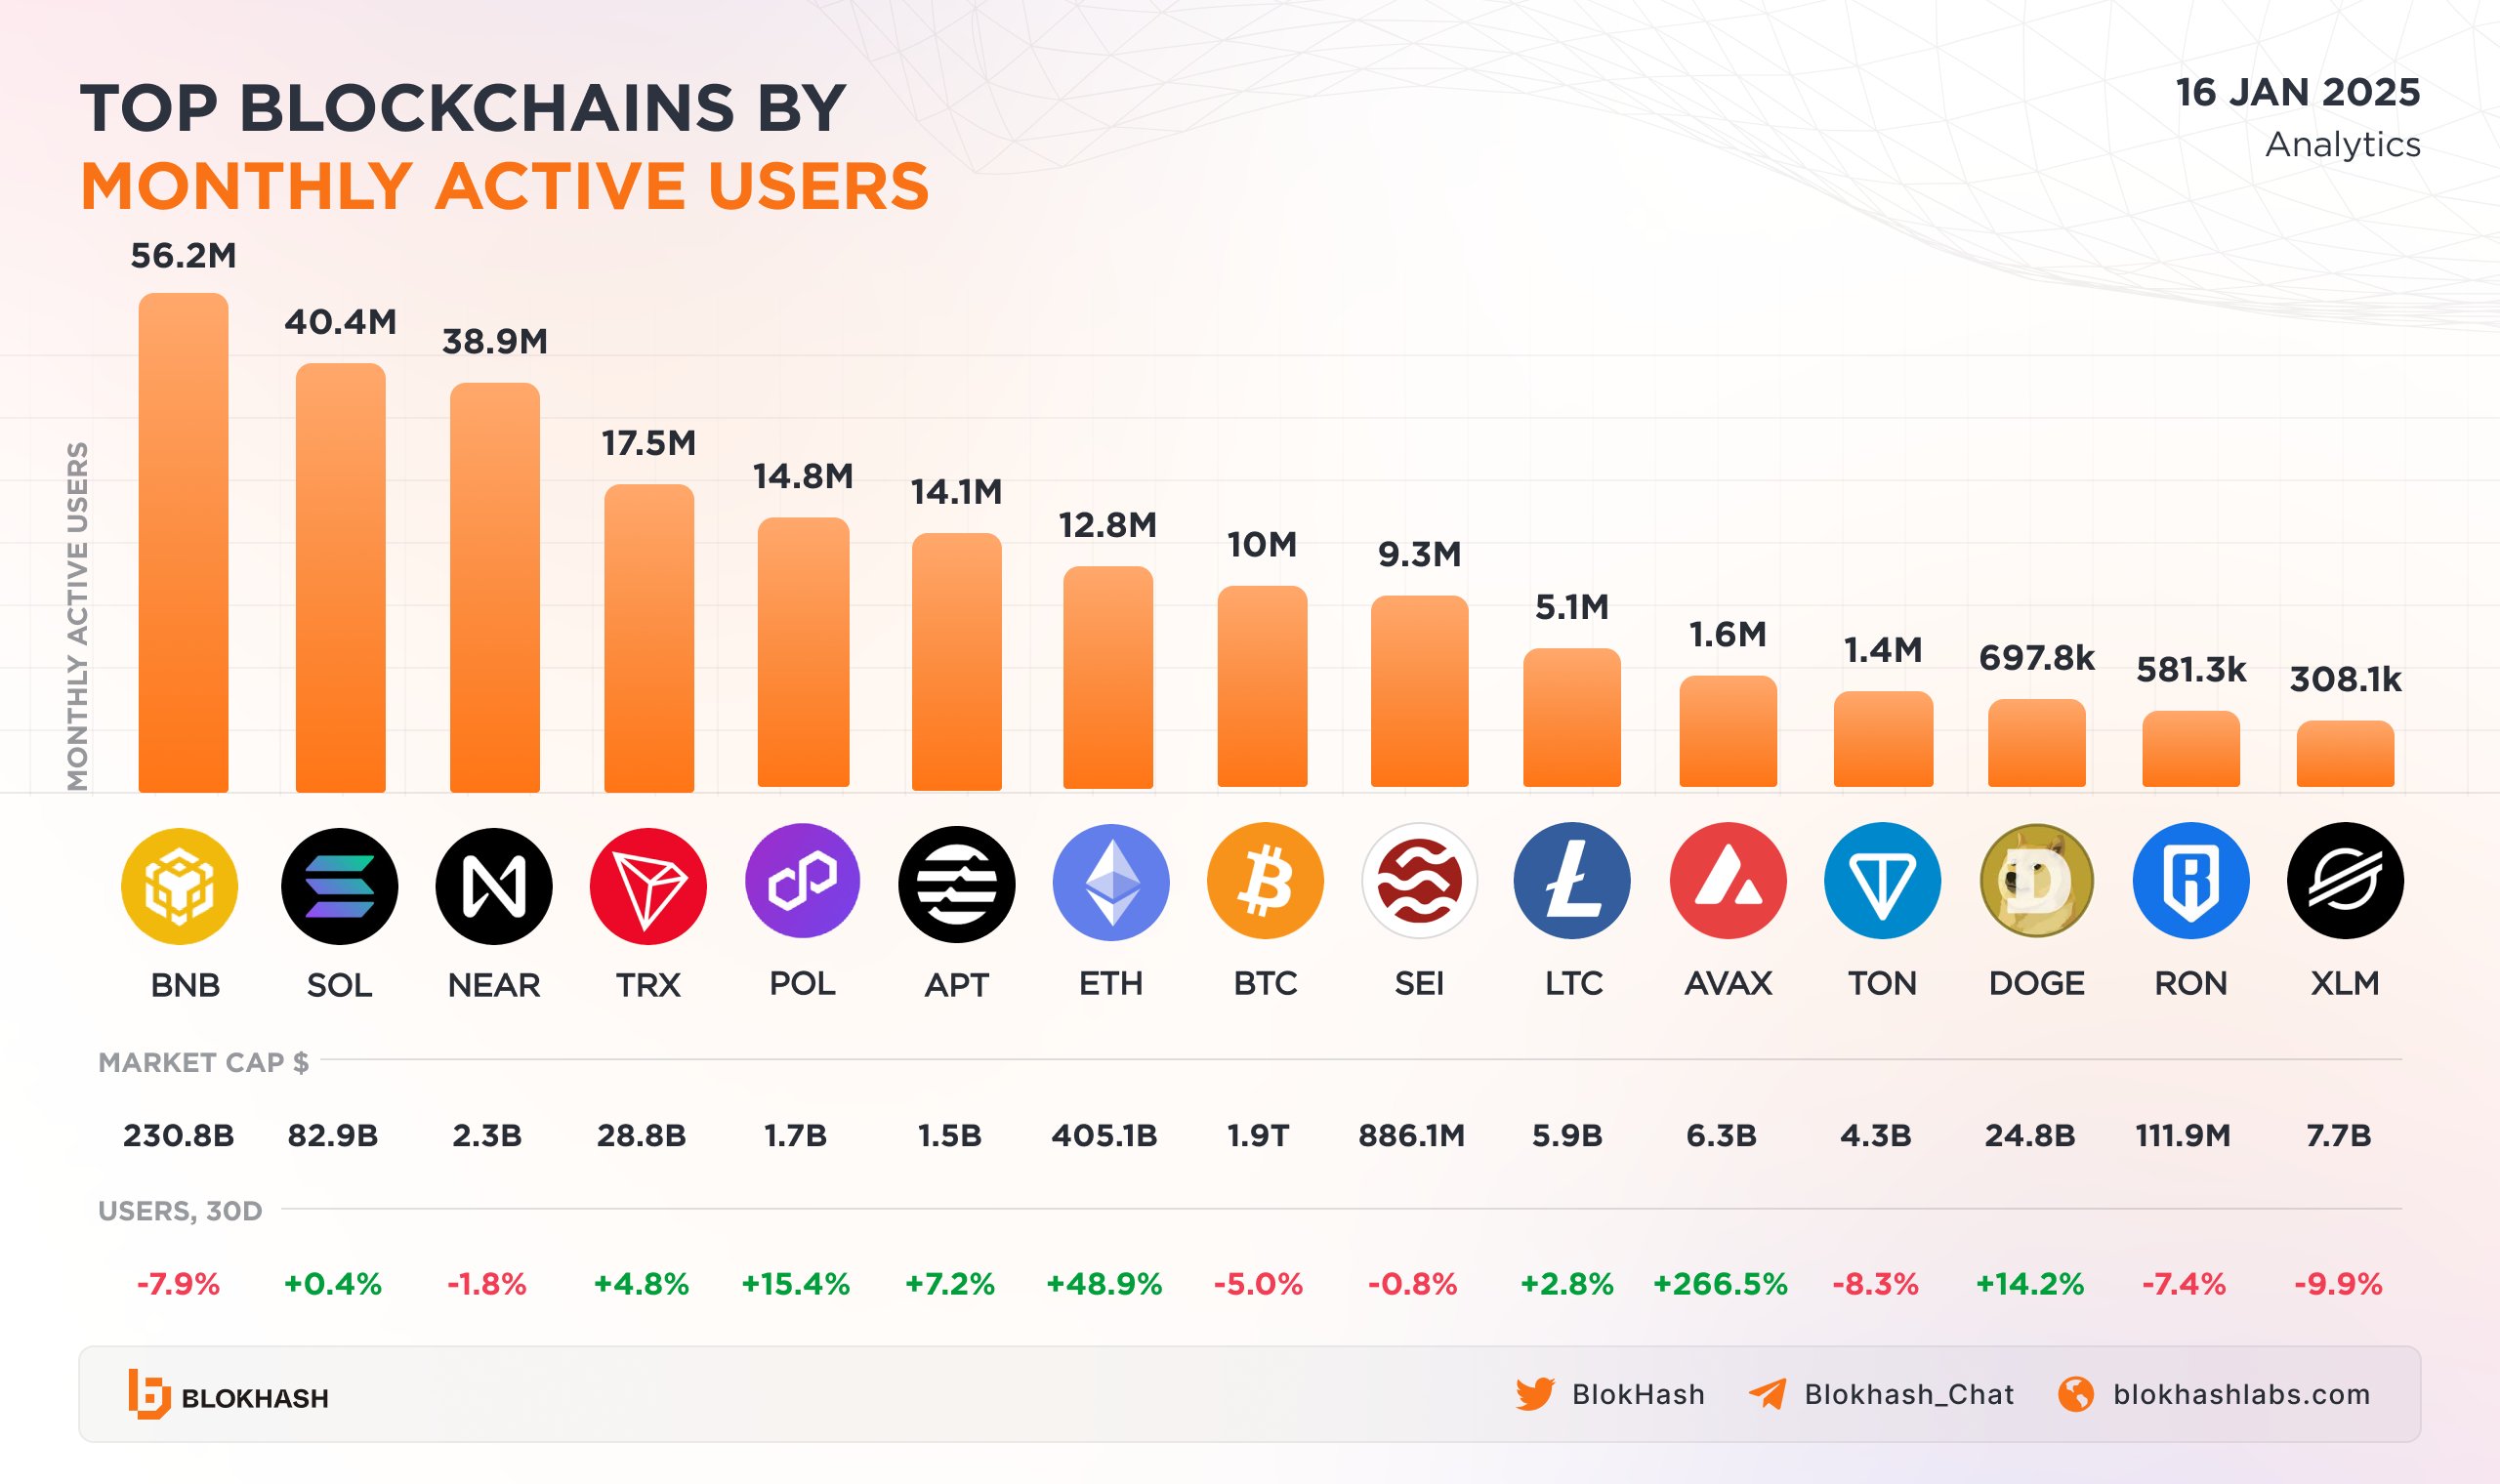
Top 10 Blockchains By Active Users/Source: @BlokHash (X)
More importantly, the daily chart is now revealing a classic bullish reversal structure, suggesting that NEAR could be positioning itself for a meaningful upside continuation.
Inverse Head and Shoulders Pattern Takes Shape
On the daily timeframe, NEAR has formed a well-defined inverse head and shoulders pattern, a setup widely regarded as one of the most reliable bullish reversal formations in technical analysis.
-
The left shoulder developed in early December near the $1.65 region, where selling pressure temporarily paused.
-
This was followed by a deeper decline toward the $1.45 area, forming the head, as broader market weakness weighed on price.
-
The right shoulder then emerged as NEAR once again found support near $1.65, signaling that sellers were losing control.
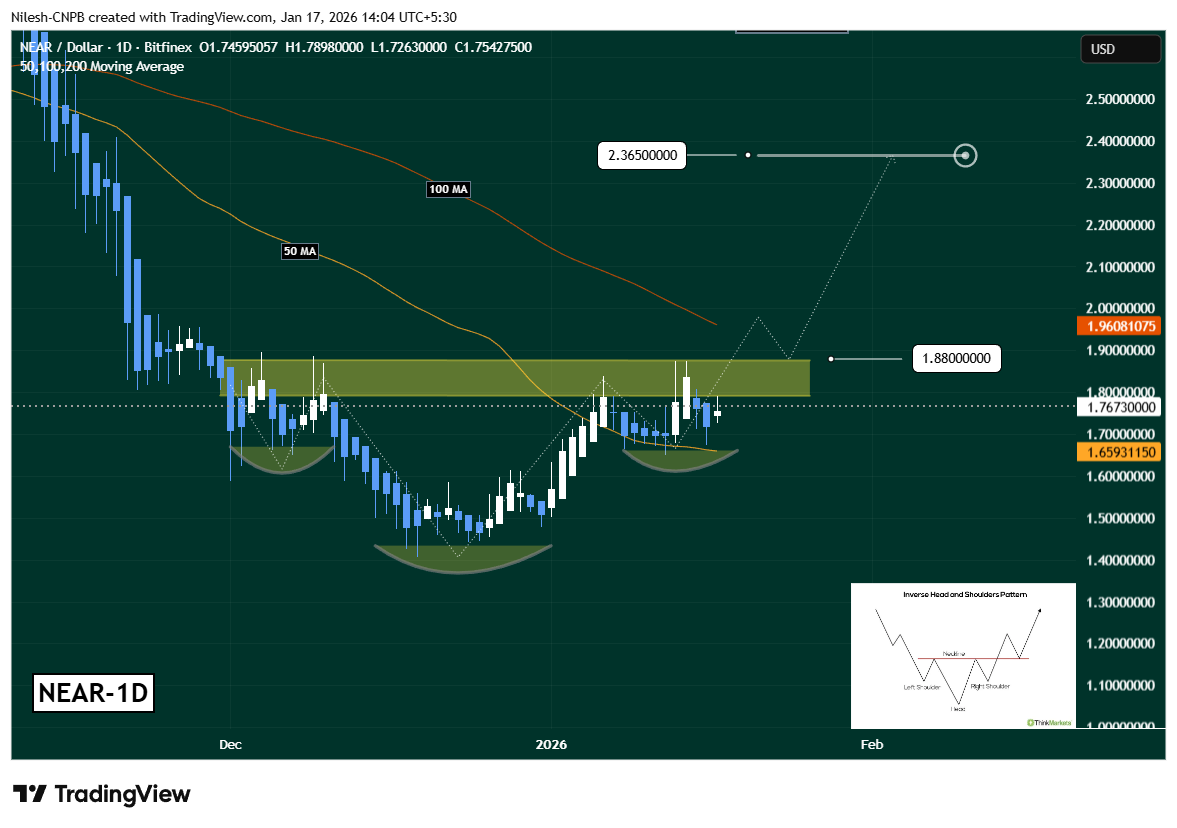
Near Protocol (NEAR) Daily Chart/Coinsprobe (Source: Tradingview)
Since completing this structure, NEAR has rebounded steadily and successfully reclaimed the 50-day moving average, which is now acting as dynamic support. At present, price is consolidating just below a key neckline resistance zone between $1.79 and $1.88, clearly highlighted on the chart.
This compression near resistance often precedes a volatility expansion, suggesting that a decisive move could be approaching.
What’s Next for NEAR?
For bullish momentum to gain confirmation, NEAR needs a strong daily close above the $1.79–$1.88 neckline, ideally followed by a successful retest of this zone as support. Such a move would validate the inverse head and shoulders breakout and confirm a shift in short-term market structure.
Additional strength would come from reclaiming the 100-day moving average near $1.96, which has capped price during the recent downtrend. A break above this level could accelerate upside momentum as sidelined buyers step back in.
If these conditions are met, the measured move projection from the inverse head and shoulders pattern points toward the $2.36 region, representing a potential upside of roughly 26% from the breakout area.
On the downside, failure to clear the neckline could lead to further consolidation. In that scenario, holding above the 50-day moving average and the $1.65 support zone will be crucial to keep the bullish structure intact. A loss of these levels would delay the breakout thesis and shift focus back to range-bound price action.
Bottom Line
NEAR Protocol appears to be coiling beneath resistance, supported by a textbook bullish reversal pattern and improving broader sentiment. While confirmation is still needed, the technical structure suggests accumulation rather than distribution, with buyers gradually gaining control.
Disclaimer: The views and analysis presented in this article are for informational purposes only and reflect the author’s perspective, not financial advice. Technical patterns and indicators discussed are subject to market volatility and may or may not yield the anticipated results. Investors are advised to exercise caution, conduct independent research, and make decisions aligned with their individual risk tolerance.
About Author: Nilesh Hembade is the Founder and Lead Author of Coinsprobe, with over 5 years of experience in the cryptocurrency and blockchain industry. Since launching Coinsprobe in 2023, he has been providing daily, research-driven insights through in-depth market analysis, on-chain data, and technical research.
Disclaimer: The information on this page may come from third parties and does not represent the views or opinions of Gate. The content displayed on this page is for reference only and does not constitute any financial, investment, or legal advice. Gate does not guarantee the accuracy or completeness of the information and shall not be liable for any losses arising from the use of this information. Virtual asset investments carry high risks and are subject to significant price volatility. You may lose all of your invested principal. Please fully understand the relevant risks and make prudent decisions based on your own financial situation and risk tolerance. For details, please refer to
Disclaimer.
Related Articles
Crypto Fear and Greed Index Drops to 39, Market in Panic State
Gate News message, April 24 — The Crypto Fear and Greed Index dropped to 39 today, down from 46 yesterday, according to data from Alternative.me. The index indicates the market remains in a panic state.
GateNews1h ago
U.S.-Iran talks hit a deadlock, oil prices rise, and Bitcoin holds steady at 78K
U.S.-Iran talks have again fallen into a stalemate, and geopolitical tensions have pushed up oil prices; Brent is over $105 and WTI is near $97. The U.S. says it will open fire if the Strait of Hormuz is hit by a “Bure” missile. Iran’s parliamentary speaker withdraws from the negotiating team, and the Islamic Revolutionary Guard Corps tightens its control, which has raised concerns from outside observers. Bitcoin is trading steadily and has stabilized above 78K; spot Bitcoin ETFs have recorded net inflows for six consecutive days, and spot Ethereum ETFs have recorded net inflows for nine consecutive days. The Fear & Greed Index has declined, but it still leans optimistic; financing rates have turned slightly negative, and leverage has not grown significantly.
ChainNewsAbmedia2h ago
Bloomberg Analyst Mike McGlone Flags $75,000 as Critical Bitcoin Level for 2026
Gate News message, April 23 — Bloomberg analyst Mike McGlone has released an assessment of Bitcoin's performance relative to traditional markets, highlighting $75,000 as a critical threshold for BTC in 2026.
According to McGlone's analysis, Bitcoin and the S&P 500 have shown similar performance
GateNews5h ago
Dogecoin Holds $0.1018 as Whales Accumulate $330M
Dogecoin continues to trade below the critical $0.1018 resistance level after multiple failed breakout attempts, with the asset trading at $0.09625 at the time of writing amid ongoing downtrend momentum and active selling pressure.
Resistance Limits Upside Momentum
The $0.1018 level has
CryptoFrontier5h ago
ADA Price Outlook as Cardano Lands LSE Tokenized Deal
Key Insights
Cardano tokenized a Hannover Re reinsurance product and listed it on the London Stock Exchange, expanding blockchain use in regulated institutional markets.
ADA price holds within a descending wedge as support at $0.2400 remains intact while resistance near $0.2550 and $0.2824 l
CryptoNewsLand6h ago