
Date: Tue, Dec 30, 2025 | 06:35 PM GMT
The broader cryptocurrency market is showing modest strength, with both Bitcoin (BTC) and Ethereum (ETH) trading in the green. This steady performance among major assets has helped stabilize overall market sentiment, creating room for select altcoins — including** eCash (XEC) **— to develop constructive technical setups.
XEC is trading with modest gains, but more importantly, its price structure is beginning to reflect a meaningful shift, as the chart now points toward a potential bullish continuation setup forming beneath key resistance.
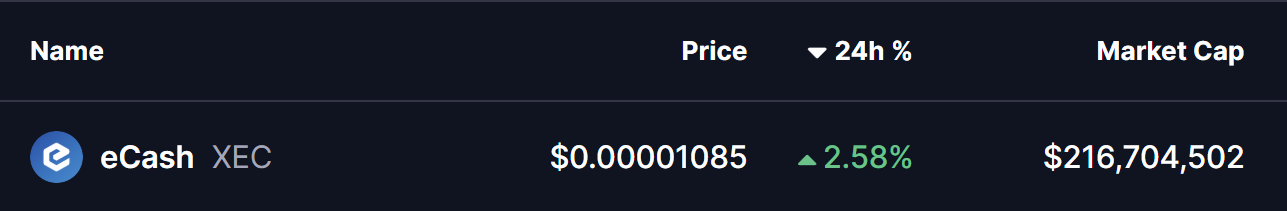
Source: Coinmarketcap
Rounding Bottom in Play
On the 4-hour timeframe, eCash is forming a textbook rounding bottom — a classic bullish reversal pattern that typically emerges after prolonged selling pressure. This structure reflects a slow but steady transition from distribution to accumulation, where sellers gradually lose control and buyers begin stepping in with conviction.
Earlier, XEC faced strong rejection near the $0.00001221 neckline zone, which triggered a sharp decline. That sell-off eventually found support near the $0.000010 region, a level that repeatedly acted as a demand zone. Each attempt to push price lower was absorbed, preventing a deeper breakdown and helping establish a rounded base.
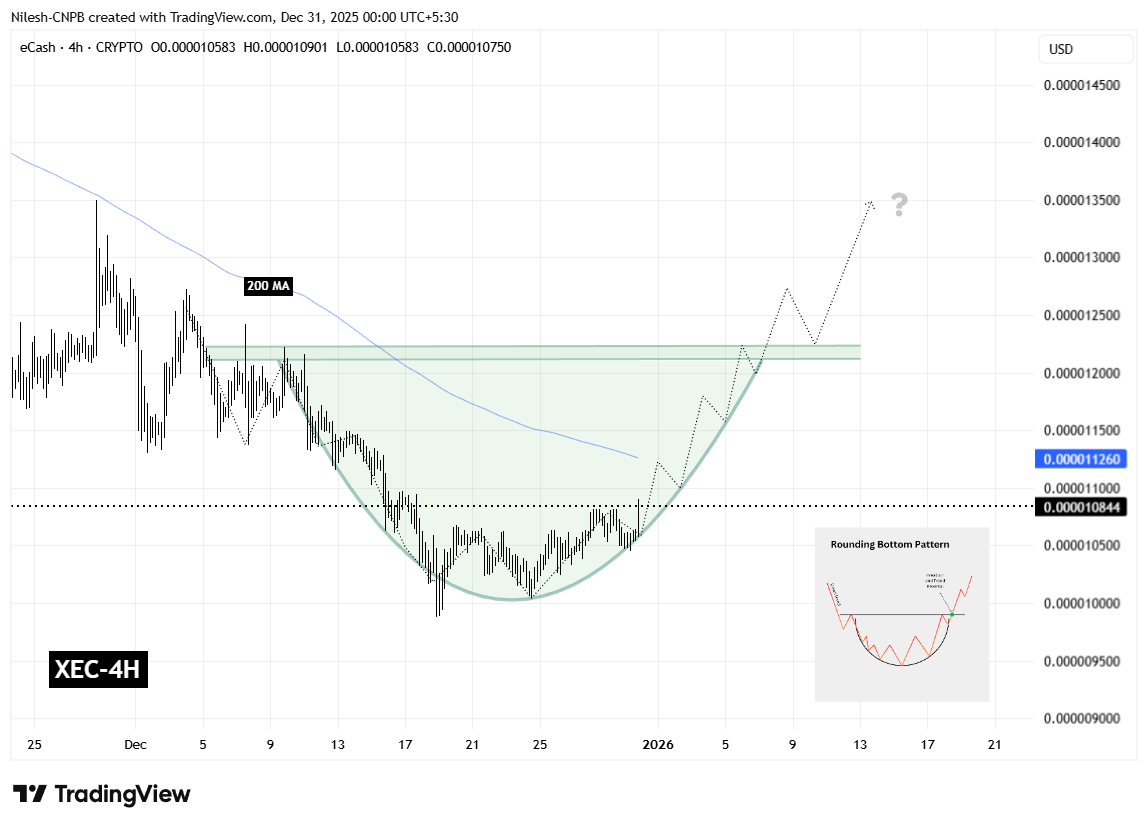
eCash (XEC) 4H Chart/Coinsprobe (Source: Tradingview)
Since then, XEC’s price action has started to curve higher in a smooth, controlled manner. The gradual recovery toward the $0.00001221 resistance suggests selling pressure is fading, while accumulation continues to strengthen. This type of rounded structure often precedes a more decisive trend shift once key resistance levels are reclaimed.
What’s Next for XEC?
For the rounding bottom pattern to fully activate, XEC must reclaim the 200-hour moving average, currently hovering near the $0.00001126 region. A decisive break and sustained hold above this level would confirm a momentum shift and signal that buyers are regaining control after an extended corrective phase.
Beyond the moving average, the most critical hurdle remains the neckline resistance around $0.00001221. A clean breakout above this zone would validate the broader reversal structure and could open the door for a bullish expansion toward the $0.00001442 region, which aligns with the projected breakout target from the rounding bottom pattern.
Until these levels are reclaimed, the setup remains in development. Short-term pullbacks or sideways consolidation are still possible if price struggles near the 200-hour MA. However, as long as XEC continues to hold above the rounded base, the broader bottoming structure remains intact.
Overall, eCash is approaching an important technical inflection point. The emerging rounding bottom, improving price structure, and proximity to major resistance levels suggest the coming sessions could play a decisive role in shaping XEC’s next directional move.
Disclaimer: The views and analysis presented in this article are for informational purposes only and reflect the author’s perspective, not financial advice. Technical patterns and indicators discussed are subject to market volatility and may or may not yield the anticipated results. Investors are advised to exercise caution, conduct independent research, and make decisions aligned with their individual risk tolerance.
Disclaimer: The information on this page may come from third parties and does not represent the views or opinions of Gate. The content displayed on this page is for reference only and does not constitute any financial, investment, or legal advice. Gate does not guarantee the accuracy or completeness of the information and shall not be liable for any losses arising from the use of this information. Virtual asset investments carry high risks and are subject to significant price volatility. You may lose all of your invested principal. Please fully understand the relevant risks and make prudent decisions based on your own financial situation and risk tolerance. For details, please refer to
Disclaimer.
Related Articles
XRP Today News: XRP Whale Accumulates 210 Million Tokens, Market Compression Range Indicates a Major Move
XRP has been under continuous pressure this year, but large whales holding between 1 million and 100 million XRP have recently increased their holdings by approximately 210 million coins, indicating that major investors are quietly building positions during the downturn. On the technical side, XRP is forming a contracting wedge between the support at $1.30 and resistance at $1.50, suggesting a potential significant directional move. The low liquidity environment could both amplify gains and increase downside risks. Watching whether the $1.30 support can hold is crucial.
MarketWhisper11m ago
Peter Brandt releases Bitcoin chart analysis showing a short-term bullish pattern
Gate News Announcement, March 10, renowned trader and chart analyst Peter Brandt released a Bitcoin chart analysis. Peter Brandt successfully predicted the 2018 Bitcoin crash. The chart shows the "Big Banana" chart displaying a large upward curved channel on the long-term weekly chart (2014-2027); the "Small Banana" chart shows a smaller similar curve currently forming near $69,000 on the daily chart. The arrows in the chart clearly point upward, indicating higher targets.
GateNews32m ago
ETH 15-minute increase of 1.32%: Major capital inflows and technical rebound resonate to drive the rise
2026-03-10 02:30 to 2026-03-10 02:45 (UTC), ETH's 15-minute return reached +1.32%, with a price range of 2020.97 to 2054.01 USDT, and an amplitude of 1.63%, showing a significant anomaly. Market attention increased accordingly, volatility intensified, and short-term trading activity rose.
The main driver of this anomaly was the concentration of large on-chain funds buying in, especially multiple large wallets making cumulative large purchases of over 3000 ETH near key support levels, directly pushing up the ETH price.
GateNews39m ago
BTC Price Fluctuation Analysis
# BTC Price Movement Deep Attribution Report for March 10, 2026, 02:30-02:45 (UTC)
## 1. Event Overview
Between 02:30 and 02:45 (UTC) on March 10, 2026, Bitcoin (BTC) experienced a significant price movement, with a return of +1.39%. The price fluctuations during this time window exceeded normal ranges, attracting market attention. This report will conduct a comprehensive attribution analysis based on on-chain data, market conditions, macroeconomic environment, trading behaviors, and other dimensions to uncover the true causes of the event and provide insights for investors.
GateNews39m ago
Pi Network price increased by 25% over the week, with bullish momentum continuing strong before Pi Day
Pi Network's token PI has recently experienced a slight increase, with event-driven demand expectations. Technical analysis shows that PI is stable at the key support level of $0.21 and plans to maintain a positive sentiment before Pi Day (March 14), which could drive the price to continue rising. Analysts indicate that PI needs to break through $0.2396 to confirm upward momentum and move toward the 200-day moving average target of $0.2854.
MarketWhisper56m ago
Bitcoin Shows ‘Tentative Signs of Improvement’ as Iran Conflict Fears Wane
In brief
Bitcoin has climbed more than 4% to roughly $69,100 as risk assets steadied after oil retreated from a spike tied to Middle East tensions.
Futures open interest and aggressive buying in perpetual markets suggest traders are cautiously returning to leveraged positions.
U.S. spot B
Decrypt2h ago