Summary
-
Over the past two weeks, the market first experienced a rapid recovery following the high volatility shock, then returned to a phase of low volatility compression. The price center continued to move higher while volatility declined, with capital showing a preference for waiting for confirmation.
-
ETF channels and stablecoin expansion together provided the underlying support for this recovery. Despite short term price fluctuations, institutional demand remained in place and on chain dollar liquidity did not show meaningful contraction, allowing the market to sustain its recovery.
-
The sequence of capital rotation remains clear. The first step is whether BTC can hold a higher range, followed by whether ETH can maintain relative strength, and only then do higher beta themes receive sustained inflows. As long as this order remains intact, structural opportunities are likely to persist.
Over the past two weeks, the core market dynamic has been a rapid recovery following the high volatility shock, followed by a return to low volatility compression. In early April, BTC and ETH experienced a sharp move up and pullback under the combined influence of geopolitical disturbances, rapid shifts in risk appetite, ETF flow reallocation, and on chain stablecoin expansion, before establishing a higher price center once again. By around April 14, BTC had reclaimed the $74,000 level, while ETH showed a steeper recovery trajectory. By April 15, options market signals began to shift, with BTC implied volatility falling to around 43% and ETH to around 66%, while 25 Delta Skew converged toward neutral. The market transitioned from event driven defensive volatility to a phase of waiting for new catalysts and directional confirmation. This shift suggests that reacting to headlines alone is no longer sufficient. The distribution of returns over the coming two weeks will be increasingly driven by endogenous factors such as price structure, volatility positioning, capital flow dynamics, and strategy alignment.
Breaking the past two weeks into phases, the first stage was a reflexive rebound following panic, and the second stage was consolidation and positioning after the rebound. Around April 2, BTC briefly tested $69,305, while ETH consolidated near $2,168, with ETH showing relative strength as the market priced in a recovery premium. By April 9, BTC rallied to $72,857 before pulling back again, with approximately $274 million in liquidations over 24 hours, skewed toward short positions. This indicates that positioning had entered a high sensitivity zone, where macro or headline driven shocks could quickly trigger further leverage flushes. Meanwhile, total stablecoin supply moved from around $316.3 billion in early April to approximately $315.4 billion by April 9. Although there were marginal fluctuations, there was no meaningful contraction, suggesting that the underlying dollar liquidity in the system remained intact. After April 14, BTC moved back above $74,000 and ETH rebounded to around $2,368, with price levels clearly higher than the previous week. At the same time, volatility did not expand in tandem and instead declined further. This forms one of the most important quantitative signals of the period: the price center is rising, sentiment is recovering, but risk pricing is becoming more restrained, indicating that larger players are waiting for confirmation rather than aggressively chasing price at current levels.
From a quantitative trading perspective, this environment is not well suited for simple trend following, nor for pure mean reversion. A more appropriate approach is conditional breakout trading following volatility compression, which is the focus of the dense moving average breakout framework discussed in this report. When multiple short and medium term moving averages converge, price ranges tighten, implied volatility declines from elevated levels, skew recovers from deeply negative territory toward neutral, and capital outflows remain limited, the market often approaches a new directional decision point. Entering trades based solely on price breakouts in such conditions can lead to repeated stop outs due to false signals. However, by combining volatility filters, volume confirmation, ETF and stablecoin flow signals, and relative strength between BTC and ETH, it becomes possible to filter out noise driven breakouts and more effectively capture structural opportunities. The past two weeks provide a representative sample of the type of environment where such strategies can be studied and deployed.
I. Biweekly Market Review: From Shock Recovery to Low Volatility Waiting
Over the past two weeks, BTC and ETH have followed different trading rhythms. BTC has acted as the primary proxy for macro risk appetite, influenced by ceasefire expectations, the decline in oil prices, ETF inflows, corporate treasury buying, and CPI related trading. ETH, in addition to beta recovery, has also been supported by stronger on chain activity, stablecoin expansion, and capital preference for catch up trades, resulting in higher elasticity during certain periods. In terms of market roles, BTC serves as the directional anchor, while ETH acts as the amplifier. When BTC stabilizes and attempts to break higher, ETH tends to deliver a steeper return profile. However, when BTC weakens and macro noise rises, ETH typically corrects more quickly. As a result, focusing solely on absolute price moves is insufficient. The key lies in identifying how their roles shift across different phases.
The first recovery phase in early April was a broad rebound across risk assets. At that time, concerns over extreme geopolitical escalation eased at the margin, oil prices declined significantly from elevated levels, and traditional risk indicators such as VIX moved lower. Capital rotated back into high beta assets. The crypto market responded in a straightforward manner, with BTC stabilizing and ETH showing stronger structural performance, while altcoins in sectors such as AI, DeFi, and high turnover themes led the rebound. Importantly, this rally was not driven by a fully restored bullish outlook, but rather by a correction of previously excessive pessimism. This distinction matters, as it explains why the rebound was followed quickly by another pullback.
The April 9 pullback stands out as one of the most critical phases over the two week period. After the initial rally, prices retraced alongside a significant wave of liquidations, highlighting intense short term positioning battles near resistance levels. From a quantitative perspective, two key signals emerged. First, the broader trend remained intact, but its progression shifted from a linear advance to a rising range structure. Second, tolerance for chasing at higher levels declined noticeably, with capital more inclined to take profits near key resistance unless supported by further confirmation from external factors. Framing this phase as a volatility driven repricing ahead of potential trend continuation allows for more effective strategy design.
From April 14 to April 15, the market entered a third phase, defined here as a low volatility waiting window. BTC moved back above $74,000, while ETH showed a stronger recovery slope. At the same time, implied volatility dropped to relatively low levels for the year, and skew, which had previously reflected a clear premium for protective puts, converged to a more neutral range around -2 to -3. The combination of stable prices and declining volatility carries two important implications. First, demand for tail risk protection has eased, as reflected in the reduced premium for downside hedging. Second, while the overall direction remains uncertain, most participants are no longer pricing in the likelihood of an imminent sharp downside move, leading to more restrained options pricing. In historical trend trading contexts, such phases often precede larger directional moves. They tend to be overlooked by discretionary traders but are well suited for systematic strategies to position ahead of potential expansion.
II. Capital and Liquidity: Underlying Support Remains Intact
Assessing whether the past two weeks of market action can sustain further continuation requires a close look at underlying liquidity conditions. The most constructive signals come from two directions. First, ETF channels continue to provide steady institutional demand for BTC. Second, total stablecoin supply remains elevated, with dollar liquidity within the Ethereum ecosystem continuing to expand. Together, these factors suggest that despite short term price fluctuations, the question of whether sufficient capital remains in the system does not point to a pessimistic answer.
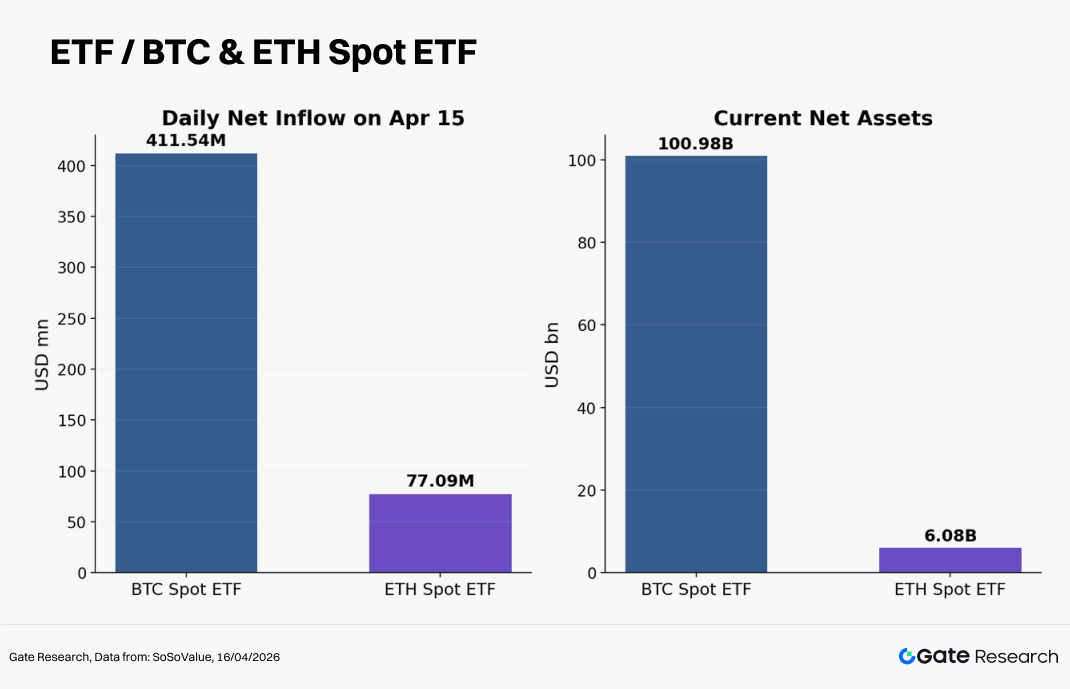
On April 9, a spot Bitcoin ETF launched by Morgan Stanley recorded approximately $34 million in inflows on its first day, with a fee as low as 0.14%. This reflects the ongoing deepening of competition within traditional financial channels for allocating capital to crypto assets. Previously, ETFs primarily addressed access, determining whether investors could gain exposure. The focus is now shifting toward who allocates capital, at what cost, and through which wealth management networks. For BTC, this competitive dynamic helps compress distribution costs, improve accessibility, and establish more stable long term demand. Even as short term prices remain sensitive to external news, the presence of institutional capital is gradually reshaping both the slope and persistence of drawdowns.
A second, often overlooked but highly important variable is the expansion of stablecoins. Total stablecoin market capitalization stood at approximately $316.3 billion in early April and remained near $315.4 billion by April 9, showing only marginal changes while staying at elevated levels. At the same time, stablecoin supply on Ethereum reached around $180 billion, marking a new all time high. Rather than contracting, the dollar settlement layer of the crypto market continues to strengthen. For quantitative traders, stablecoins represent a key driver of market microstructure. Expansion in stablecoin supply translates into greater available collateral on chain, increased liquidity across DEXs and leveraged protocols, and a larger pool of capital waiting to be deployed. While this does not immediately drive price higher, it supports the persistence of trends once they form and reduces the likelihood of sharp liquidity driven collapses.
It is important to note that stablecoin expansion does not immediately translate into broad based upside for altcoins. Historical patterns show that capital typically flows first into higher certainty assets, beginning with BTC and ETH, before rotating into higher beta segments. From a rotation perspective, the sequence remains clear: first assess whether BTC can hold a higher range, then whether ETH can maintain relative strength, and only afterward whether themes such as AI, DeFi, high turnover narratives, and smaller cap assets receive sustained inflows. Reversing this order, by allocating heavily to long tail assets before confirmation in major assets, often leads to higher drawdown risk.
III. Volatility and Options Pricing: Why Low Volatility Is a Key Signal
For many traders, low volatility is often associated with a lack of opportunity and limited potential for high returns. From a quantitative perspective, however, low volatility is often when signals are most concentrated. It typically emerges under two conditions: either a trend has fully exhausted and the market enters a prolonged directionless phase, or a larger directional move is being prepared, with positions gradually reallocated in a calmer environment. The market over the past two weeks more closely resembles the latter.
As of April 15, BTC realized volatility was around 43% and ETH around 66%, both having fallen below the 50th percentile of the past year. At the same time, ETH 25 Delta Skew narrowed to the range of -2 to -3, with the premium on protective puts declining significantly. When this set of data is compared with the sharp liquidations, elevated volatility, and clearly defensive pricing observed around April 9, it becomes evident that the market completed a transition from heightened concern over deeper downside to a phase of waiting for new catalysts in less than a week. This shift carries important strategic implications. Approaches that previously focused on short volatility to hedge tail risk are gradually giving way to strategies better suited for positioning around conditional directional breakouts.
The role of skew deserves closer attention. It is often viewed simply as a sentiment indicator within the options market, but in reality, it represents the most direct pricing expression of tail risk demand. When skew is deeply negative, the market is willing to pay a significant premium for downside protection, reflecting strong defensive positioning. As skew converges toward neutral, demand for downside hedging declines and expectations of extreme downside risk weaken. When skew turns positive, it typically signals that the market is beginning to price in upside convexity, marking a shift from defensive to more proactive positioning. Over the past two weeks, skew has not yet turned positive, but its steady convergence is already meaningful. Risk appetite is recovering, and panic is no longer the dominant force in pricing. For spot and perpetual strategies, this suggests a shift toward maintaining core positions while waiting for confirmation before adding exposure.
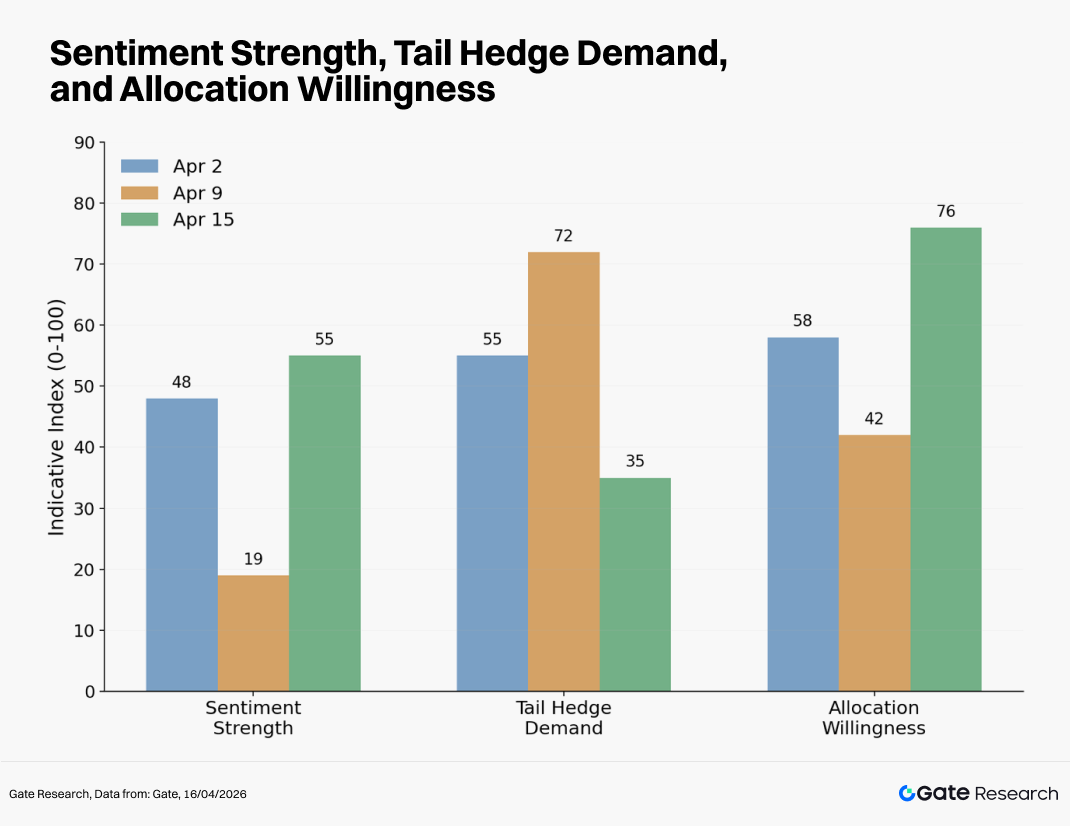
Note: Sentiment intensity is primarily derived from short term price changes in BTC and ETH, shifts in realized volatility, and liquidation dynamics. Tail risk hedging demand is mainly assessed through BTC and ETH 25 Delta Skew, options put to call ratios, and the premium on protective puts. Allocation willingness is primarily reflected by spot ETF net inflows, changes in total stablecoin market capitalization, and the strength of spot market absorption.
IV. Effectiveness of the Dense Moving Average Breakout Strategy
The core of the dense moving average breakout strategy lies in identifying whether the market has transitioned from disordered volatility into a more structured, directional phase. The underlying logic is that when short and medium term moving averages converge and price repeatedly compresses around them, market disagreement still exists, but trading frictions are declining, the energy of the previous trend has been absorbed, and the boundaries of a new trend are beginning to form. Once price breaks above the moving average cluster with sufficient strength, and is confirmed by volume or capital flow, it becomes more likely to develop into a tradable trend. Using Gate spot 4 hour data from early April 2026 as a backtesting sample, a setup based on SMA and EMA 6, 12, and 24 with a compression threshold of 2.2%, and exits defined by EMA12, stop loss, or a 3R target, is able to identify trend transitions in both BTC and ETH, though it remains relatively conservative in capturing overall returns.
The past two weeks provide a representative sample for evaluating this strategy. First, after the initial drawdown, price did not break below higher timeframe support but instead stabilized and rotated at elevated levels. Second, short term moving averages shifted from dispersion back to convergence, indicating that the impact of the previous volatility shock was being absorbed. Third, when using 7 day realized volatility relative to 30 day realized volatility as a proxy for noise conditions, it is evident that noise declined during the compression phase in early April. Fourth, when combined with the observation that ETF flows and stablecoin conditions did not deteriorate, breakouts occurring in this environment are more likely to receive follow through.
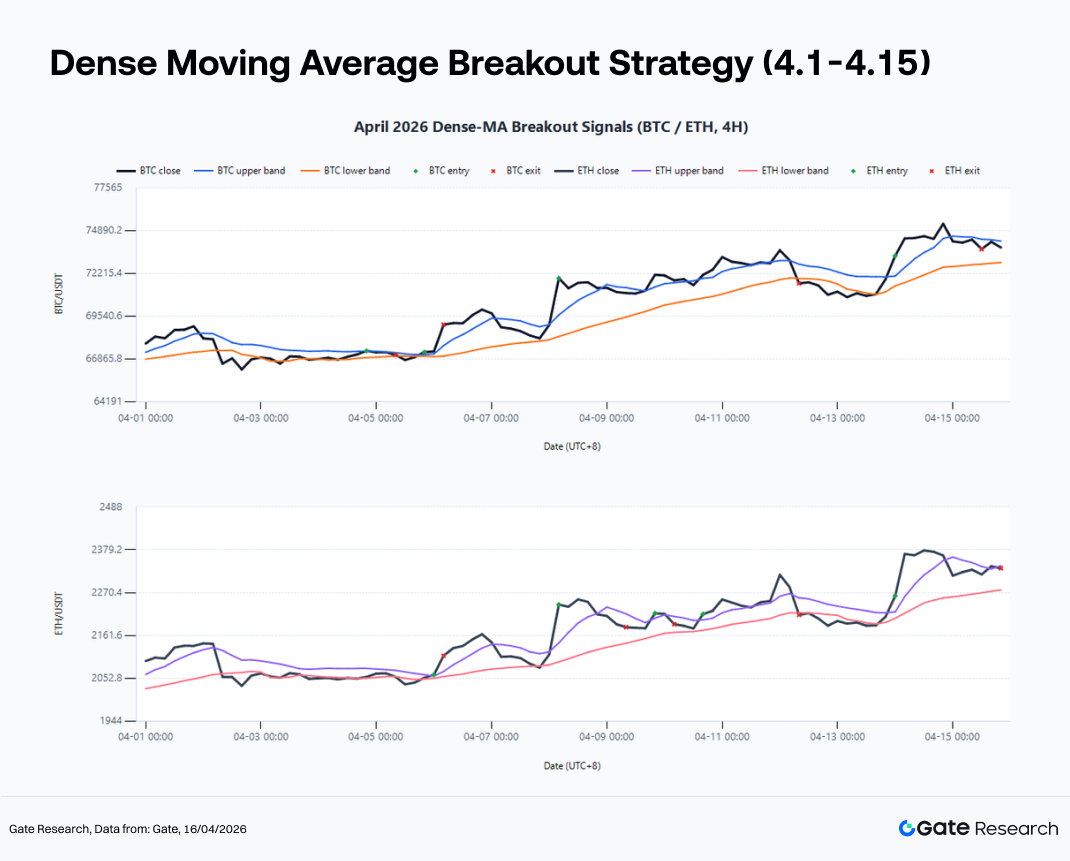
The backtesting results further support this framework. During the sample period, BTC generated 4 long signals, with cumulative returns of +2.30%, a maximum drawdown of 2.82%, and a win rate of 50%. ETH generated 5 signals, with cumulative returns of +1.45%, a maximum drawdown of 4.43%, and a win rate of 40%. Notably, the BTC breakout on April 5 at 20:00 contributed +2.55%, while the secondary breakout on April 14 at 00:00 added another +0.57%. For ETH, the two effective breakouts on April 6 at 00:00 and April 14 at 00:00 contributed +2.34% and +3.10%, respectively. These results indicate that, in the current environment, the most effective approach remains to wait for the alignment of moving average compression, declining volatility, and key level breakouts, rather than attempting to anticipate the absolute bottom.
However, relying solely on the raw dense moving average breakout rules presents two practical challenges. First, the 24/7 nature of crypto markets makes them more susceptible to news driven moves and liquidity gaps, increasing the likelihood of false breakouts, particularly during off peak hours. Second, BTC and ETH exhibit different volatility characteristics, and applying a single parameter set across both assets often leads to suboptimal results.
These issues are clearly reflected in the April sample. BTC produced two low quality signals on April 4 at 20:00 and April 8 at 04:00, with returns of -0.36% and -0.45%, respectively. ETH showed even greater sensitivity, generating three consecutive noise trades between April 8 and April 10, with returns of -2.56%, -1.25%, and -0.09%. This highlights ETH’s higher susceptibility to early stage whipsaws following breakouts.
To address these limitations, three enhancements are proposed. First, introduce a volatility filter, allowing entries only when 7 day realized volatility does not exceed 1.1 times the 30 day realized volatility. Second, incorporate structural confirmation, requiring BTC breakouts to hold above the upper bound of the prior three day volume concentration zone, while ETH breakouts additionally require that ETH/BTC relative strength does not weaken. Third, apply time based filtering, reducing signal weight around major macro data releases and periods of concentrated news flow to avoid low quality trades triggered by event driven noise. Notably, when volatility, volume, and structural confirmation are combined into a unified filter layer, BTC trades are reduced from 4 to 2, with cumulative returns of +2.09%, while ETH is left with only 1 trade, resulting in a return of -2.56%. This outcome reinforces that the direction of these enhancements is valid, but also highlights that BTC and ETH cannot rely on an identical parameter framework.
At the execution level, the dense moving average breakout strategy is not designed to capture the absolute bottom. Its strength lies in entering the mid phase of a trend with a controlled error rate. The backtest from April 1 to April 15 repeatedly shows that attempting to time the exact reversal low does not produce stable or repeatable outcomes. More consistent returns come from following the trend after the market has clearly transitioned into a new regime.
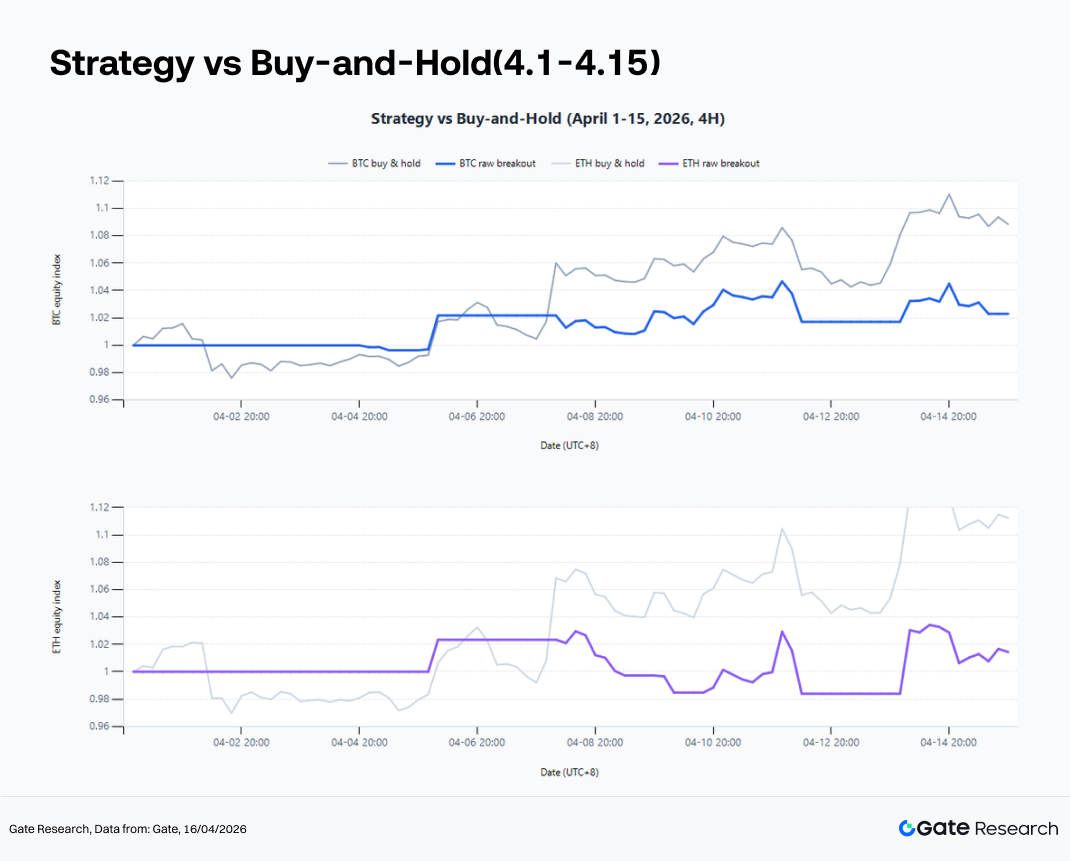
At the same time, this sample also highlights a key limitation of the strategy. The challenge is not in identifying turning points, but in holding onto the trend. Over the same period, buy and hold returns reached +8.84% for BTC and +11.24% for ETH, significantly higher than the +2.30% and +1.45% generated by the breakout strategy. This suggests that the dense moving average breakout framework is more effective as a confirmation tool for regime shifts rather than a standalone return maximizing strategy. To improve performance, the focus should not be on earlier entries, but on adopting wider holding rules after confirmation in order to better capture the core portion of the trend.
V. From BTC to ETH to High Beta Themes
The sequence of capital rotation remains a key focus in the weekly observation window. Over the past two weeks, the market has broadly followed a clear path: BTC stabilizes the risk center, ETH amplifies the recovery, and thematic assets absorb the spillover in sentiment. This sequence continues to offer guidance for the coming two weeks.
BTC serves as the first layer of filtering. If BTC fails to hold a higher price center, then any expectation of ETH catching up, altcoin rotation, or thematic activity lacks a solid foundation. The importance of BTC lies in its role in defining the overall market risk budget. Over the past two weeks, BTC has repeatedly tested key levels, with leading capital not yet willing to push valuations higher without further confirmation. As a result, the most important question for the next two weeks is whether BTC can sustain its position within a higher range for a longer period. A positive answer to this question would provide room for ETH and higher beta assets to expand.
ETH functions as the second layer, acting as an amplifier. Since early April, ETH has shown relative strength over BTC, both in the speed of price recovery and in the market’s repricing of its narrative potential. The Ethereum ecosystem is benefiting from multiple medium term themes, including stablecoin expansion, its role as a settlement layer for tokenized assets, and increasing institutional on chain activity. When risk appetite improves, capital tends to treat ETH as a more elastic core asset compared to BTC. However, this outperformance is most pronounced when the market is neutral to moderately bullish. If BTC weakens again, ETH typically corrects more sharply. From a strategy perspective, the optimal setup for long ETH positions arises after BTC has clearly stabilized, allowing traders to capture excess returns through ETH’s higher elasticity.
As for higher beta themes such as AI, DeFi, privacy, and Bitcoin related ecosystems, the past two weeks have shown intermittent bursts of activity but limited sustained trends. Structural opportunities exist, but their persistence remains highly dependent on whether major assets can maintain stable consolidation. For traders, the appropriate approach is to apply stricter risk control and shorter holding periods. Within a quantitative framework, these assets are better handled using momentum factors, liquidity filters, and trailing stop mechanisms.
VI. Three Trading Scenarios for the Next Two Weeks
As of April 15, 2026, the 4-hour structural center for BTC is around $73,276, with a 5 day trading range between $70,510 and $76,044, and a 10 day volume concentration zone between $71,610 and $72,102. For ETH, the 4 hour structural center is around $2,295, with a 5 day range between $2,175 and $2,415, and a volume concentration zone between $2,191 and $2,212. At the same time, ETH/BTC remains above the EMA18, indicating that as long as BTC stays stable, ETH retains the potential to generate relative outperformance.
Against this backdrop, the key focus for the next two weeks is not the immediate direction of the market, but the conditions under which price transitions from range bound consolidation into either trend expansion or a failed breakout and pullback structure.
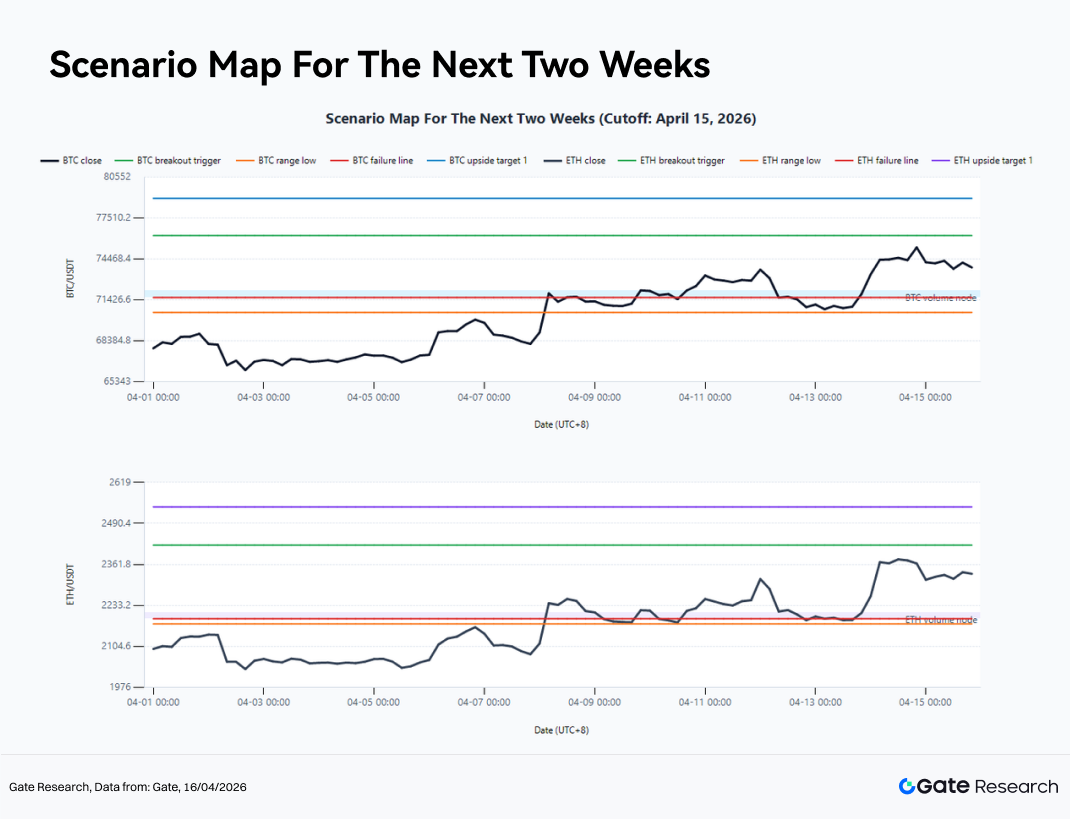
Scenario 1: Strong Breakout
If BTC continues to move higher from the current structural center and achieves a confirmed 4 hour close above $76,205, while holding above the EMA20 zone near $73,400 on pullbacks, it would signal a transition from consolidation into a post compression trend expansion phase. The initial upside target would be $78,972, followed by a potential move toward $81,739. In parallel, if ETH breaks above $2,422 and ETH/BTC remains above the EMA18, it is more likely to enter an accelerated expansion phase, with upside targets at $2,542 and $2,662. In this scenario, BTC serves as the confirmation asset for direction, while ETH is more likely to act as the primary return driver. Higher beta themes typically follow with stronger rotation within 24 to 72 hours. From a strategy perspective, breakout continuation and pullback entries are preferred, while immediate counter trend shorts during early breakout stages should be avoided.
Scenario 2: Range Continuation
If BTC repeatedly tests the resistance zone near $76,200 but fails to establish a sustained breakout, while the volume concentration zone between $71,600 and $72,100 continues to provide support, the market is likely to remain range bound between $71,600 and $76,200, with the center around $73,300. For ETH, the corresponding range would be approximately $2,191 to $2,422, with a center near $2,295 to $2,300. In this environment, both the win rate and risk reward profile of trend following strategies tend to decline, while mean reversion and short volatility strategies become relatively more effective. However, strict tail risk control remains essential, as prolonged consolidation often leads to larger moves once a breakout eventually occurs. For most participants, the priority in this scenario is to preserve patience and maintain sufficient capital and risk capacity for higher conviction directional opportunities.
Scenario 3: Failed Breakout and Pullback
If macro conditions deteriorate or geopolitical, policy, or liquidity events trigger renewed defensive positioning, BTC may briefly break above $76,205 but fail to hold within 24 hours, falling back below $73,400 and subsequently breaking down through $71,610. In this case, the market is likely to revert to a pattern of false breakouts followed by leverage driven flushes, with downside targets at $70,748 and then $69,971. For ETH, a similar failure to hold above $2,422, followed by a drop below $2,298 and a break of $2,191, would indicate a lack of follow through, with downside risk extending toward $2,150. This type of scenario is not uncommon in crypto markets. Even well designed breakout strategies must incorporate stop loss and reassessment mechanisms. When false breakouts occur, limiting losses to manageable levels is critical in order to preserve the ability to re engage when a higher quality signal emerges.
VII. Strategy Execution and Risk Management
In the current environment, position sizing is more important than directional calls. Over recent weeks, the market has shown no shortage of volatility or opportunities. What remains scarce is the ability to stay consistent in a high noise environment. In practice, several principles stand out. First, core spot positions can be maintained, but aggressive additions in the middle of the range should be avoided, with incremental risk better reserved for confirmed breakouts. Second, perpetual or high leverage strategies should reduce frequent reversals and instead concentrate trading activity around high conviction signal windows. Third, allocations to ETH and higher beta themes should be built on the premise that BTC has already stabilized, rather than on the assumption that they will decouple independently. Fourth, any breakout strategy must include a clear failure exit framework, such as price returning into the moving average cluster, breakdowns in volume confirmation, or renewed deterioration in skew.
Looking further ahead, one key risk in the coming weeks is the premature assumption that the market has entered a sustained one sided trend. If traders interpret the current environment as a full recovery in risk appetite too early, they risk exhausting their risk budget before a confirmed breakout occurs. The value of a quantitative framework lies in its ability to systematize patience, enforce confirmation, and maintain disciplined risk control. Only under such a framework can the low volatility compression phase be translated into repeatable returns, rather than being eroded by repeated false signals.
Conclusion
In summary, the crypto market has undergone a regime shift over the past two weeks, moving from event driven volatility to a low volatility waiting phase characterized by a rising price center and declining volatility. BTC has returned to a higher trading range, while ETH has demonstrated stronger recovery elasticity. ETF channels and stablecoin expansion continue to provide underlying support, while the convergence of skew and the decline in implied volatility suggest that tail risk concerns are easing. From a quantitative perspective, this phase resembles a preparation stage ahead of the next directional move. What matters now is building an execution framework that aligns with a low volatility, compressed, and confirmation driven environment.
The key takeaway from this biweekly report is that the focus over the next two weeks should be on identifying when the market transitions from waiting to action. In this process, the dense moving average breakout strategy, combined with volatility conditions, capital flows, and relative strength signals, offers greater practical value than relying on directional views alone. As long as BTC can maintain its higher price center, ETH and higher beta themes may continue to extend upward. However, before a confirmed breakout emerges, discipline, filtering, and position management remain more important than aggressive positioning.
Source:
Gate Research is a comprehensive blockchain and cryptocurrency research platform that provides deep content for readers, including technical analysis, market insights, industry research, trend forecasting, and macroeconomic policy analysis. Disclaimer Investing in cryptocurrency markets involves high risk. Users are advised to conduct their own research and fully understand the nature of the assets and products before making any investment decisions. Gate is not responsible for any losses or damages arising from such decisions.