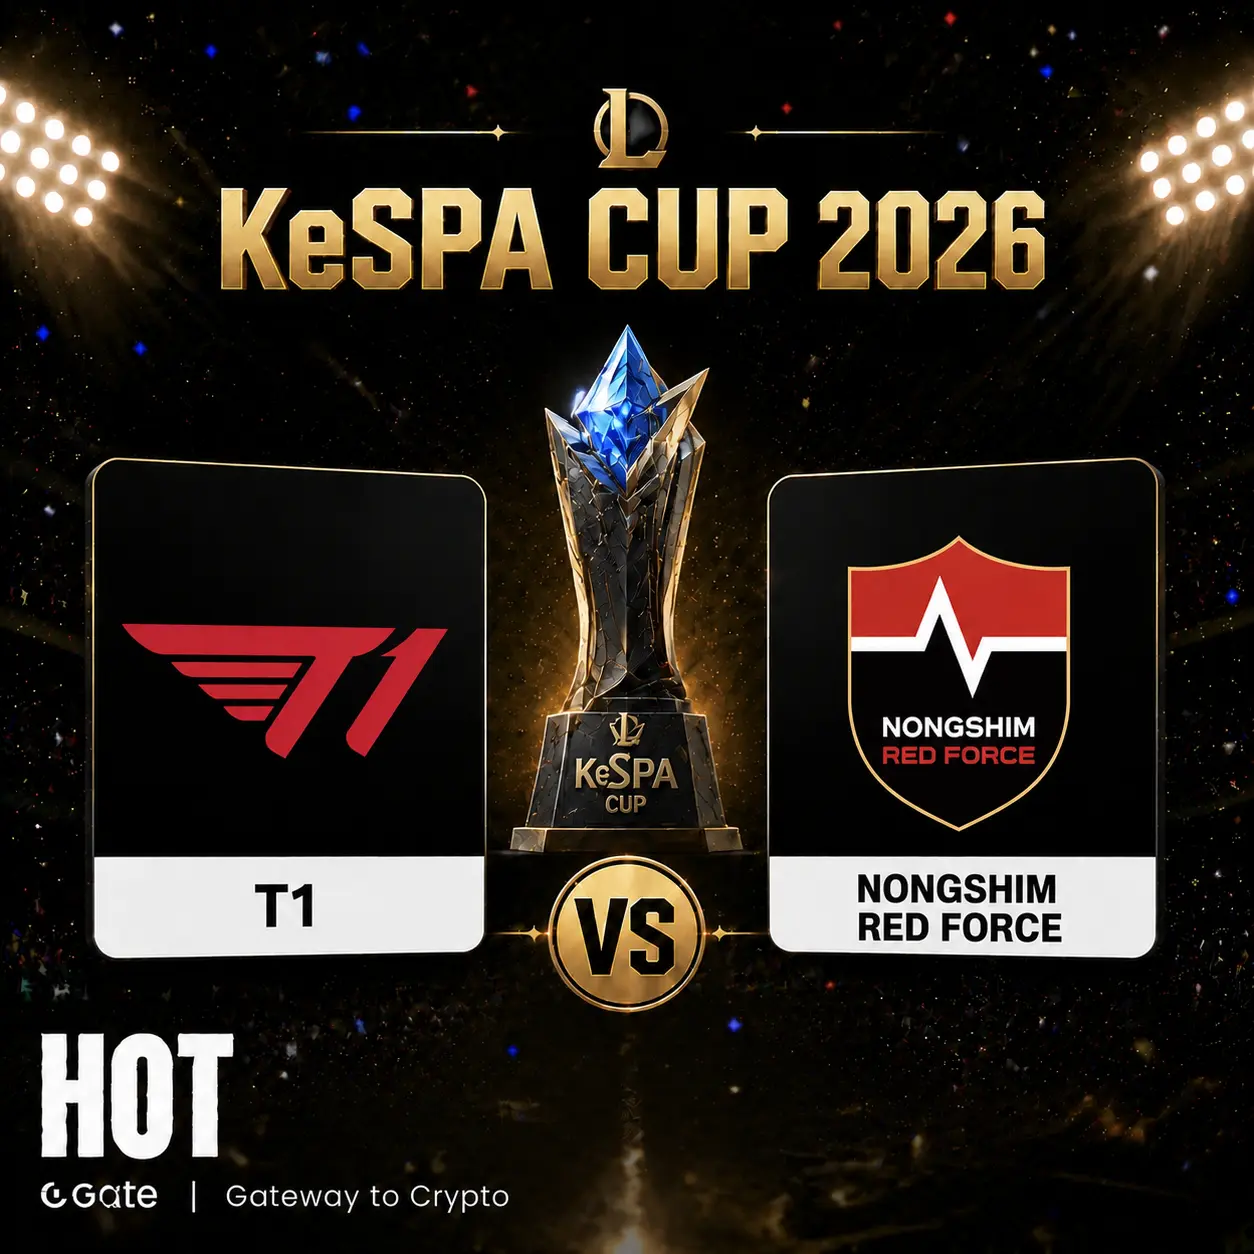
On July 27, 2026, the League of Legends KeSPA Cup group stage enters its final day of competition. The matchup between T1 and Nongshim Red Force (NS) becomes one of the day’s featured games. According to data from the Gate prediction market, the current market places T1’s win probability at 71%, while Nongshim Red Force’s win probability is 30%. This probability distribution is not priced arbitrarily; it is the result of the market’s multi-dimensional, information-driven game after integrating various factors.
How the market prices a 71% win probability
The core pricing mechanism of a prediction market is that participants express their judgment of an event’s outcome with real money. The probability distribution shown on Gate’s prediction market—71% versus 30%—essentially reflects the collective consensus formed when market participants integrate multiple sources of information, such as historical head-to-head records, recent competitive form, and the characteristics of the tournament format.
Looking at historical matchups, T1 and NS have faced each other 28 times in the past: T1 won 23 games, while NS has only managed 5 wins. A historical win rate of over 82% provides a solid foundation for the market’s higher expectations for T1. In international third-party ranking systems, T1 is ranked 3rd globally, while NS is ranked 98th—an additional gap of 95 places further reinforces the market’s assessment of T1’s strength.
However, the appeal of prediction markets is that they never rely solely on historical data. The market continuously absorbs new fundamentals and dynamically adjusts its pricing. The current 71% probability is precisely the instant equilibrium formed after the market has digested all available information.
How KeSPA Cup’s format influences the prediction logic
To understand the predicted probability for this match, you first need to grasp the format framework of KeSPA Cup 2026. This edition features 10 teams from the LCK region, with a total prize pool of 52M KRW, and the champion earning 30M KRW.
In the group stage, the 10 teams are split into Group A and Group B. Group A includes GEN, DK, NS, DNS, and KRX; Group B includes HLE, T1, BRO, BFX, and KT. The format uses a cross-group matchup structure: each team plays one BO1 against every team in the other group. After the group stage ends, the top four teams from each group advance, while the last-place team is eliminated directly.
The BO1 format significantly affects the prediction logic. BO1 single-game elimination naturally carries higher uncertainty—one teamfight mistake or one BP decision deviation can directly determine how the match plays out. This is fundamentally different from BO3 or BO5 series. When the market offers a 71% probability, it has already incorporated this inherent volatility into its pricing model.
Comparing the recent competitive form of T1 and NS
T1 has experienced a packed schedule in 2026—from MSI to the Esports World Cup (EWC), and now the KeSPA Cup. At EWC, T1 advanced to the quarterfinals, and in the MSI lower bracket they completed a sweep of FURIA. T1’s current roster includes Faker, Keria, Doran, Oner, and Peyz—this lineup is among the top-tier configurations in the LCK in both experience and individual capability.
For NS, the current roster is Scout, Lehends, Kingen, Sponge, and Diable. NS’s recent win rate is 50%, while T1’s is 60%. T1 is currently on a two-game winning streak, while NS has just suffered a loss.
It’s worth noting that KeSPA Cup allows teams to operate with rosters of up to 10 players, including both first-team and second-team players. This means some teams may use the tournament to test lineups or train new players rather than going all-in on winning. This uncertainty is also reflected in the prediction market pricing—if the market perceives that a team is planning rotations or practice, that team’s win probability would be reduced accordingly.
Is the value of prediction markets as an information-aggregation mechanism real?
The core function of a prediction market is not to predict the future, but to aggregate dispersed information. When large numbers of participants place bets based on their respective information advantages, the market price gradually converges toward an equilibrium point that reflects collective wisdom. The 71% versus 30% distribution shown on Gate’s prediction market is exactly the product of this information-aggregation process.
Compared with traditional betting platforms, crypto-based prediction markets have higher participation barriers and a more transparent pricing mechanism. Gate launched an esports trading season campaign from July 20, 2026 to August 10, covering major esports events including EWC, LPL, and LCK, with a total prize pool of 200,000 USDT. This design further improves market liquidity and pricing efficiency.
Market disagreement and consensus behind the probability numbers
The 41 percentage-point gap between 71% and 30% looks, at first glance, like a fairly large expectation difference. But the number itself contains at least two layers of information.
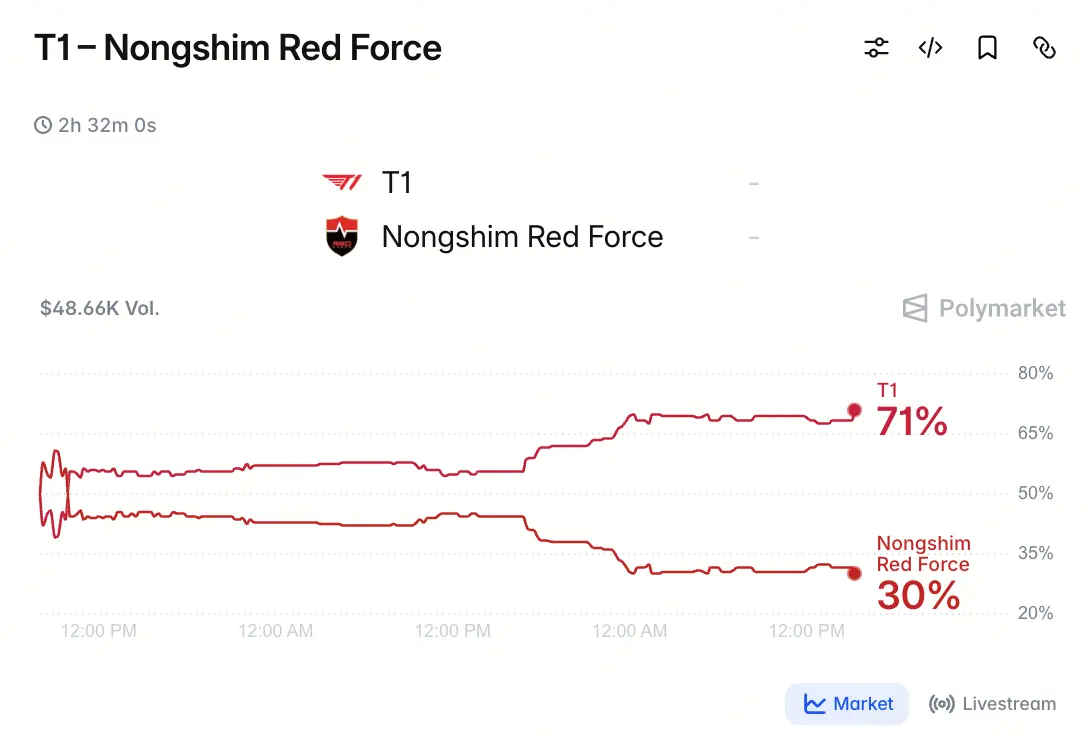
The first layer is consensus—the market broadly believes T1 is the stronger side. Historical head-to-head records, ranking gaps, and recent form all support this view. The second layer is disagreement—still, 30% of the capital is betting that NS can win. This 30% is not irrational betting; it is based on a comprehensive consideration of factors such as the uncertainty of BO1, KeSPA Cup’s special format, and possible lineup rotations.
In prediction markets, fully unanimous expectations often imply low pricing efficiency—because if everyone thinks a certain outcome is inevitable, no one is willing to provide liquidity in the opposite direction. The minority 30% backing NS actually indicates that the market is still functioning effectively, and after sufficient two-sided competition, both bulls and bears converge on the current equilibrium price.
The relationship between predicted probability and the actual direction of the match
It’s important to clarify that a 71% predicted probability does not mean T1 has a 71% chance of winning the match—there is a subtle but important conceptual difference between the two. The prediction market price reflects the collective judgment of market participants, not the objective probability that the event will occur. The market price may deviate from true probability due to information asymmetry, insufficient liquidity, or biases in group perception.
For investors and esports fans paying attention to this match, understanding the market’s pricing logic is more valuable than merely focusing on the numbers themselves. Why does the market give 71% instead of 80% or 60%? Which factors support this figure? Which unknown variables could cause the price to swing dramatically before the game? These questions go deeper analytically than simply asking who will win.
FAQ
Q1: How is Gate prediction market win-rate data derived?
Gate prediction market win-rate data comes from the collective betting behavior of market participants. Participants bet on the outcome based on the information they each have. The market price (i.e., win rate) dynamically adjusts as buyers and sellers compete, and ultimately converges to an equilibrium level that reflects collective judgment.
Q2: Does a 71% win rate mean T1 is guaranteed to win?
No. 71% is the collective judgment of market participants, not the actual probability of the match occurring. The BO1 format itself has relatively high uncertainty, and the result of any single game is influenced by multiple variables. The value of a prediction market lies in revealing market consensus, not providing deterministic predictions.
Q3: What’s special about the group-stage format of KeSPA Cup?
KeSPA Cup group stage uses a cross-group matchup model: the 10 teams are divided into Group A and Group B, and each team plays a BO1 single-game decisive match against every team in the other group. The top four teams in each group advance, and the last-place team is eliminated. BO1 format naturally carries high uncertainty, which is an important factor to consider when understanding prediction market pricing.
Q4: What are the historical head-to-head records between T1 and NS?
The two teams have played 28 times in total: T1 won 23 games, and NS won 5. T1’s historical win rate is over 82%, which is one of the key bases for the market’s higher win probability assigned to T1.
Q5: How is a prediction market different from traditional betting platforms?
Prediction markets run on crypto assets, with higher transparency and lower participation barriers. Market pricing is formed by the collective judgment of participants rather than being set by a single institution. Gate’s esports prediction market also improves liquidity and pricing efficiency through its trading season campaign (total prize pool: 200,000 USDT).


