The ETH/BTC ratio measures how Ethereum (ETH) performs relative to Bitcoin (BTC): divide the ETH price by the BTC price to see roughly how many BTC one ETH can buy. Most exchanges also quote an ETH/BTC spot pair that surfaces this relative price in the order book.
Watching only USD charts can hide relative strength. Both assets can rise in dollars while ETH/BTC falls, and both can chop sideways in USD while the ratio swings hard. Reading the ETH/BTC ratio puts sentiment, capital rotation, and relative performance on one scale before layering charts and risk limits.
What Is the ETH/BTC Ratio?
The ETH/BTC ratio is Ethereum’s price expressed in Bitcoin. If the ratio is about 0.03, one ETH is worth roughly 0.03 BTC. That statement describes relative value at a point in time—it does not forecast direction. In glossary form—ETH/BTC: What is it?—the short answer is a relative exchange rate between two major crypto assets, not a USD price ticker and not a performance promise.
About ETH and BTC as a pair: Bitcoin is widely treated as the benchmark crypto asset, while Ethereum anchors much of smart-contract and DeFi activity. Comparing them with one ratio compresses two large markets into a single relative series that many desks label an Ethereum BTC Overview when they brief risk. Key data points people track carefully include the ratio level, its trend versus moving averages, Bitcoin dominance, and whether altcoin market cap confirms breadth—without treating any print as a live quote narrative.
Terminals often show the ratio as the ETH/BTC trading pair. The same figure can be approximated by dividing contemporaneous ETH and BTC prices in the same quote currency (for example USD or USDT). Numerators and denominators must share the same currency and timestamp, or the comparison breaks. Conversion tables and ETH to BTC calculator pages answer “how much ETH for 1 BTC” at a snapshot; educational use of those tools is to check arithmetic consistency, not to chase displayed ticks.
| Concept |
Meaning |
| ETH/BTC ratio |
ETH price ÷ BTC price |
| Plain reading |
How many BTC one ETH buys |
| Common display |
ETH/BTC pair and ratio charts |
| Not equal to |
USD return or investment advice |
The table frames ETH/BTC as a relative yardstick: it answers whether ETH is rich or cheap versus BTC, not whether an asset’s fundamentals justify a trade.
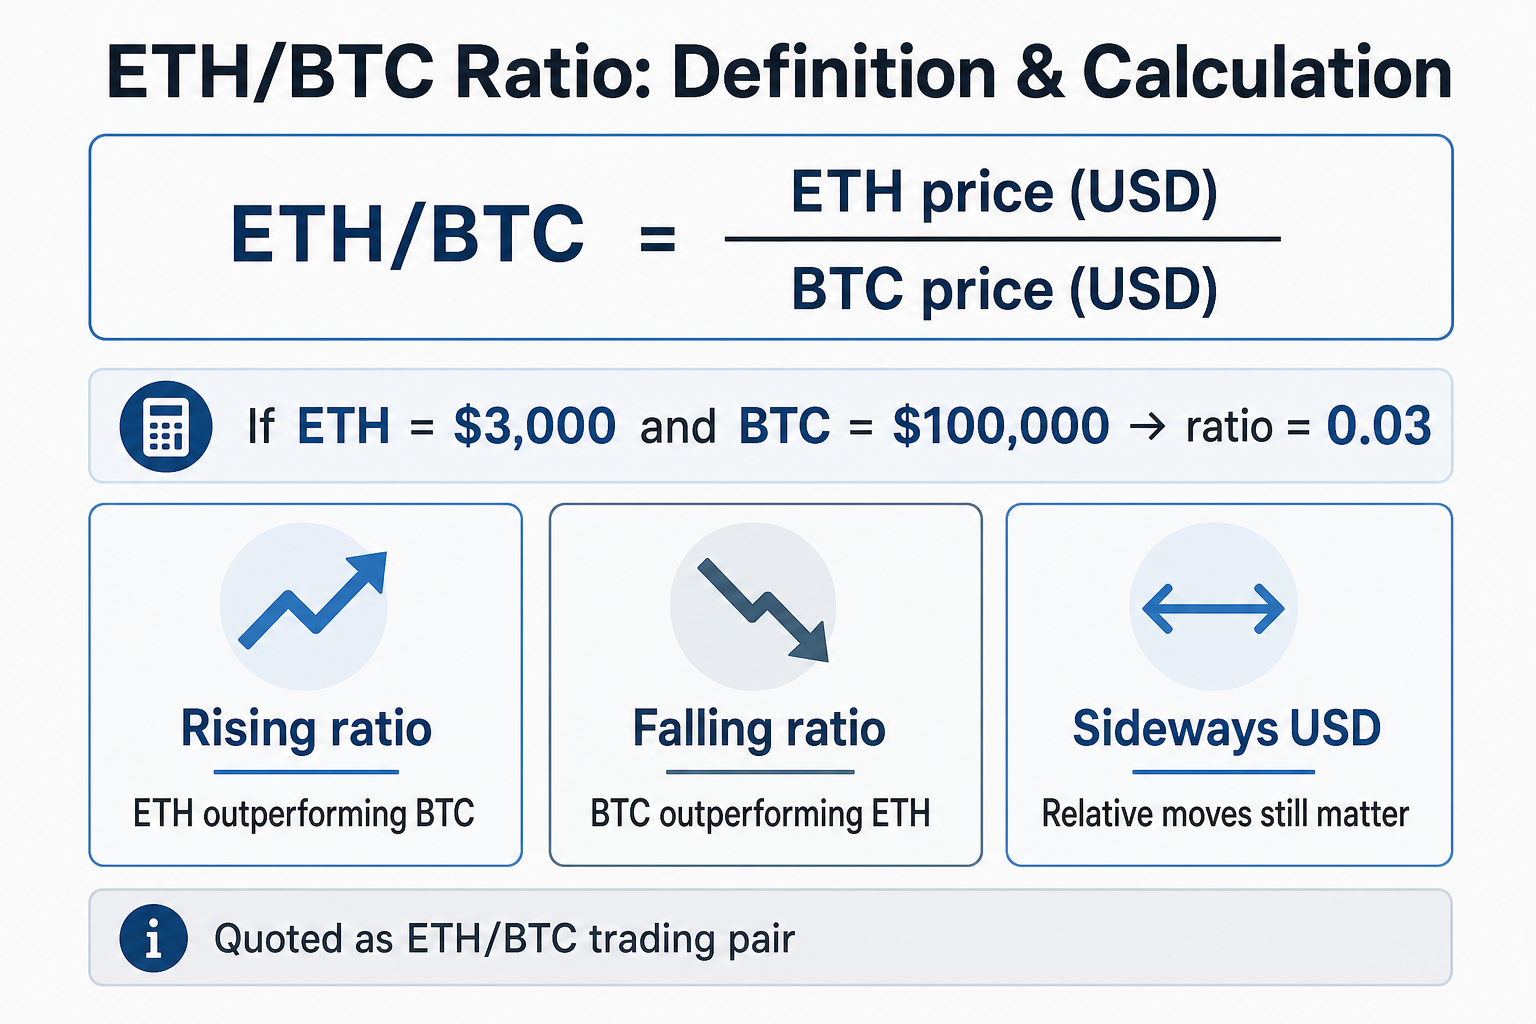
Figure 1. ETH/BTC definition and calculation: ETH price divided by BTC price, with rising, falling, and sideways-USD relative readings.
How Does the ETH/BTC Ratio Work?
Calculate the ETH/BTC ratio as current ETH price divided by current BTC price. If ETH trades near $3,000 and BTC near $100,000, the ratio is about 0.03.
When ETH’s percentage move outpaces BTC, the ratio rises. When BTC leads and ETH lags, the ratio falls. Because both prices change continuously, the ratio is a moving time series rather than a fixed constant.
On spot markets, the ETH/BTC book shows how many BTC buyers bid for ETH and how many BTC sellers ask. Spreads, trading fees, and slippage on large orders can make the realized fill differ from the mid quote, so the “screen ratio” and the “executed ratio” are not always identical. Convert Ethereum to Bitcoin (ETH to BTC) on a ticket only after you check depth; a converter page that shows ETH / BTC conversion tables is arithmetic, not liquidity. Ethereum BTC Price (ETH-BTC) labels on quote sites are snapshots—use them to verify you are looking at the cross, not as a live trading script.
Why Does the ETH/BTC Ratio Matter?
The ETH/BTC ratio is widely used to observe risk appetite shifting between Bitcoin and Ethereum. A rising ratio is often read as capital tilting toward ETH and other higher-beta assets; a falling ratio is often read as preference for relatively more defensive BTC exposure. Asset allocation is hard when both legs move in the same USD direction; the ratio helps separate “both up” from “ETH leading” without inventing a trading signal.
In cycle discussions, ETH/BTC strength sometimes appears alongside “altseason” narratives—periods when altcoins outperform BTC. Persistent weakness often coexists with BTC leadership and risk-off tone. These are observation frames, not guaranteed cause-and-effect links. Multi-year Bitcoin vs Ethereum historical performance studies can show how relative leadership rotates across cycles; those charts describe past paths and higher or lower relative stretches, not average annualised return targets to chase.
Even when USD prices drift sideways, ETH/BTC can still move sharply. Relative strength fills a blind spot left by USD-only charts: rotation between assets can be clearer than fiat-denominated noise. Compare with ETH/BTC on a dedicated chart when USD pairs look quiet, then size any operational decision against fees and liquidity rather than headline percent moves.
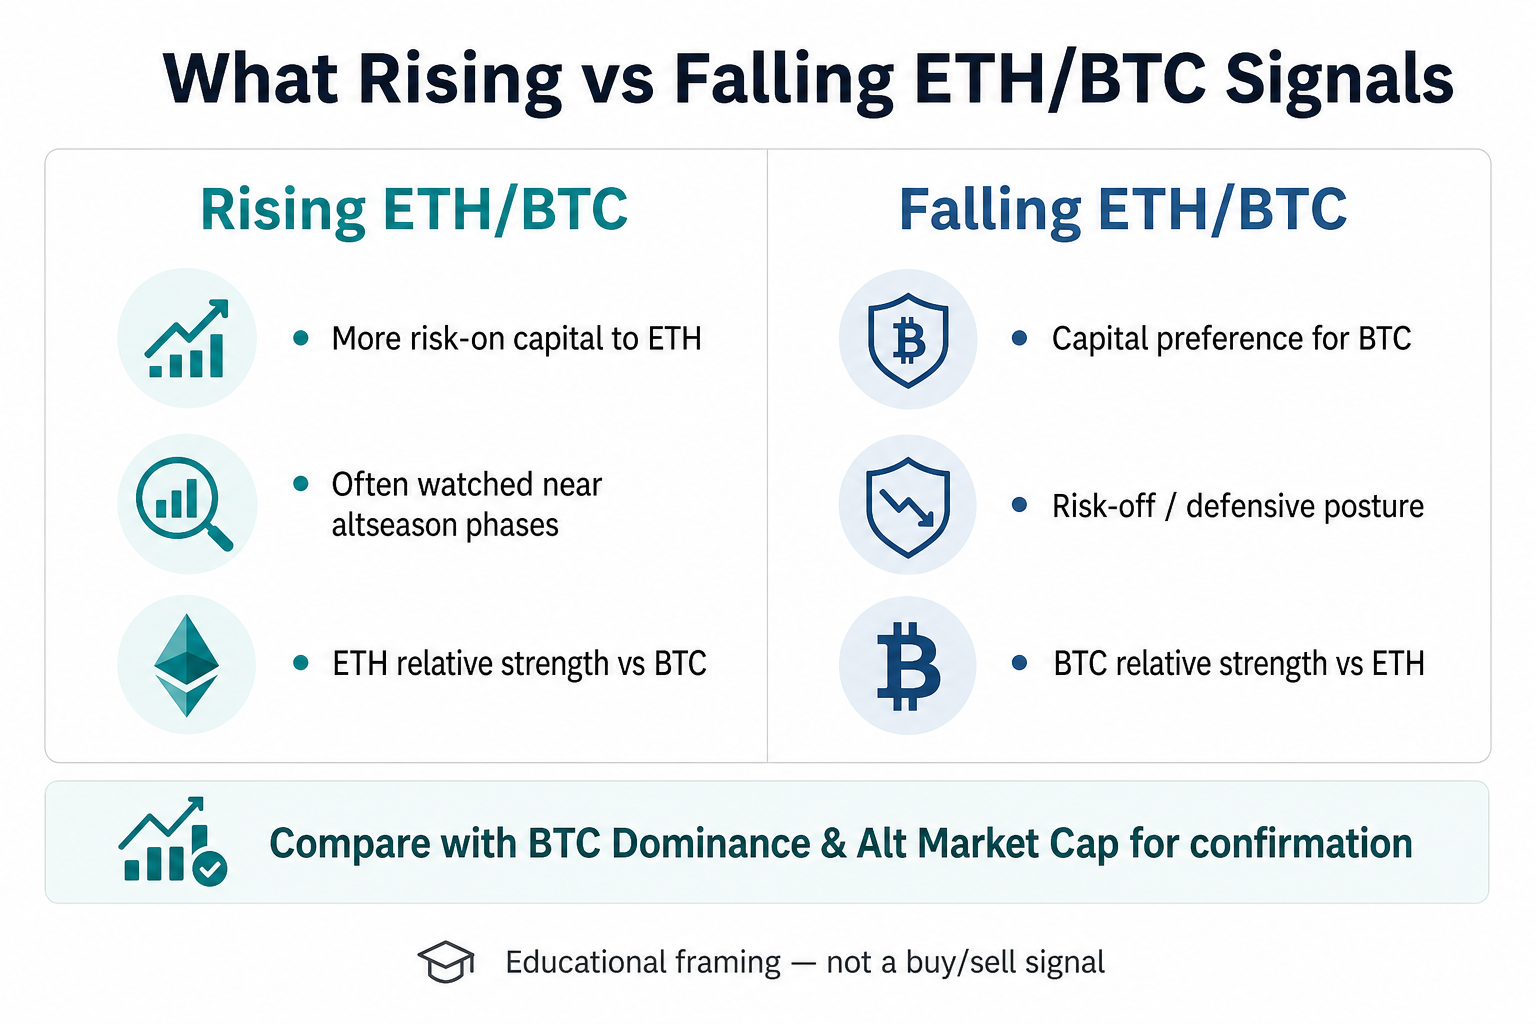
Figure 2. Common readings of rising vs falling ETH/BTC, with a reminder to confirm via Bitcoin dominance and alt market cap.
What Do Rising and Falling ETH/BTC Usually Mean?
A rising ETH/BTC ratio usually means Ethereum is outperforming Bitcoin in relative terms: ETH becomes “more expensive” when priced in BTC. A falling ratio usually means Bitcoin is relatively stronger, or ETH is lagging.
Separate absolute USD gains from relative gains. ETH can rise in dollars while ETH/BTC still falls if BTC rises faster. ETH can fall in dollars while ETH/BTC rises if BTC falls more.
A sturdier read pairs ratio direction with the trend tools, Bitcoin dominance, and altcoin market-cap checks in How to analyze the ETH/BTC ratio, instead of treating one spike as a conclusion.
How Does ETH/BTC Relate to Capital Rotation and Altseason?
Capital rotation describes preference migrating among BTC, ETH, and broader altcoins. ETH/BTC is often treated as the first relative-strength gate on that path: many observers watch BTC first, then whether ETH catches up or leads, then whether strength spreads further.
Altseason has no single official definition; it usually means a stretch when altcoins outperform BTC. ETH/BTC strength can be an early or accompanying signal in that discussion, or it can reflect ETH-specific narratives that never broaden.
If ETH/BTC rises while alt market cap expands and Bitcoin dominance eases, a risk-on diffusion story is more coherent. If the ratio rises alone while alt caps stall, the move may be idiosyncratic to ETH rather than a broad alt rally.
What Are the Limits and Risks of Using ETH/BTC?
The ETH/BTC ratio is a market measure with lag and noise—not a forecasting oracle. Historical supports, moving-average crosses, and RSI extremes can fail. Correlations shift with liquidity regimes, regulation, and major protocol events.
Quote noise matters: cross-exchange spreads, stablecoin depegs, and thin books in stress can separate the displayed ratio from tradable prices. Leverage, funding rates, and wicks can distort short-horizon readings.
Equating the ratio with trade instructions amplifies bias. A better use is as a relative-strength dashboard, then add position caps, exit rules, and horizon discipline—and verify book depth, fees, and slippage before execution. Educational frameworks are not return promises.
| Risk type |
How it shows up |
| Misread signals |
Treating one spike as an order |
| Inconsistent inputs |
Mixing timestamps or quote currencies |
| Liquidity & slippage |
Large fills away from mid |
| Regime breaks |
Old patterns failing in new macro settings |
The table sets boundaries: ETH/BTC supports relative comparison; it should not carry the full decision weight alone.
Conclusion
The ETH/BTC ratio divides ETH price by BTC price to show Ethereum’s strength versus Bitcoin, often via the ETH/BTC pair. Rising and falling readings help observe rotation between BTC and ETH (and broader alts), but only alongside trend tools, dominance context, and liquidity reality. The ratio supplies a relative lens—not a guarantee of returns. Ethereum to Bitcoin FAQs below restate the same boundaries in search-style answers so each block stays self-contained.
FAQ
What is the ETH/BTC ratio?
The ETH/BTC ratio is Ethereum (ETH) price divided by Bitcoin (BTC) price, showing roughly how many BTC one ETH is worth. Exchanges often quote it directly as the ETH/BTC pair. It reflects relative performance, not USD returns by itself. Other glossary terms in the same family include ETHBTC, ETH-BTC, and Ethereum Bitcoin cross rate—labels for one relative idea.
How do you calculate the ETH/BTC ratio?
Divide contemporaneous ETH price by BTC price using the same quote currency (for example USD or USDT). If ETH is $3,000 and BTC is $100,000, the ratio is about 0.03. Spreads, fees, and slippage can make the filled ratio differ slightly from the mid quote. An ETH to BTC converter or conversion table is only a calculator for that division; guide yourself with consistent timestamps rather than mixing snapshots.
What does a rising ETH/BTC ratio mean?
A rising ETH/BTC ratio usually means Ethereum is outperforming Bitcoin. Market commentary often links that to risk appetite tilting toward ETH or early altseason talk. USD gains in ETH do not guarantee a higher ratio if BTC rises faster. Confirm with Bitcoin dominance and alt market cap where possible, and represent the move as relative strength rather than a mandatory rotation trade.
What does a falling ETH/BTC ratio mean?
A falling ETH/BTC ratio usually means Bitcoin is relatively stronger or Ethereum is lagging. Commentary often pairs that with risk-off tone or BTC preference. It remains a relative-strength description and does not alone imply buying or selling either side. A lower ratio can coexist with higher USD prices for both assets when BTC leads the advance.
Can the ETH/BTC ratio predict altseason?
ETH/BTC strength sometimes appears around altseason discussions, but it is not an official definition of altseason and does not guarantee broad alt gains. If the ratio rises while alt market cap does not expand, the move may be ETH-specific. Predictive claims sit outside the metric’s reliable boundary. Historical performance windows across years can illustrate rotation patterns without licensing forecasts.
Where can you view the ETH/BTC ratio?
View it on exchange ETH/BTC spot charts or on tools such as TradingView, CoinMarketCap, and CoinGecko. Check timeframe, quote convention, and whether the series is a live pair or a synthetic index, and account for fees and liquidity when translating charts into fills. Frequently asked questions on those sites often mix converter widgets with education; keep the educational ETH/BTC chart separate from any promotional news module.