The Uncomfortable Truth About Most Crypto Traders
Most people think losing money in crypto comes from bad timing.
Buying the wrong coin.
Entering too late.
Missing the exit.
But after watching this market for years, the pattern is much simpler.
Most traders lose for one reason:
They trade when the market is most exciting.
Excitement in crypto usually means one thing — the move is already mature.
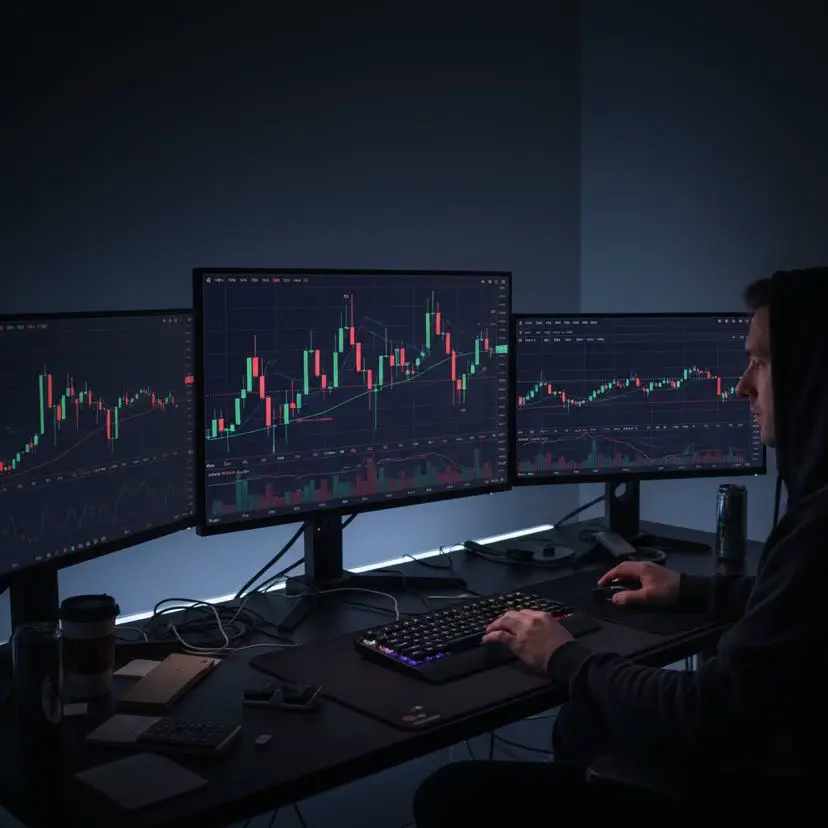
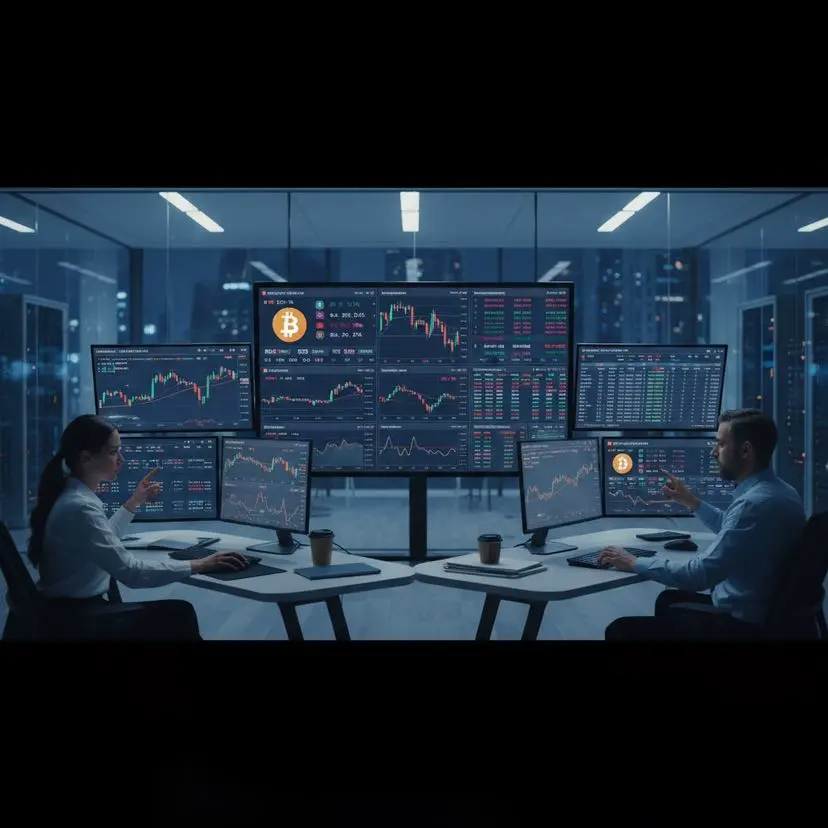
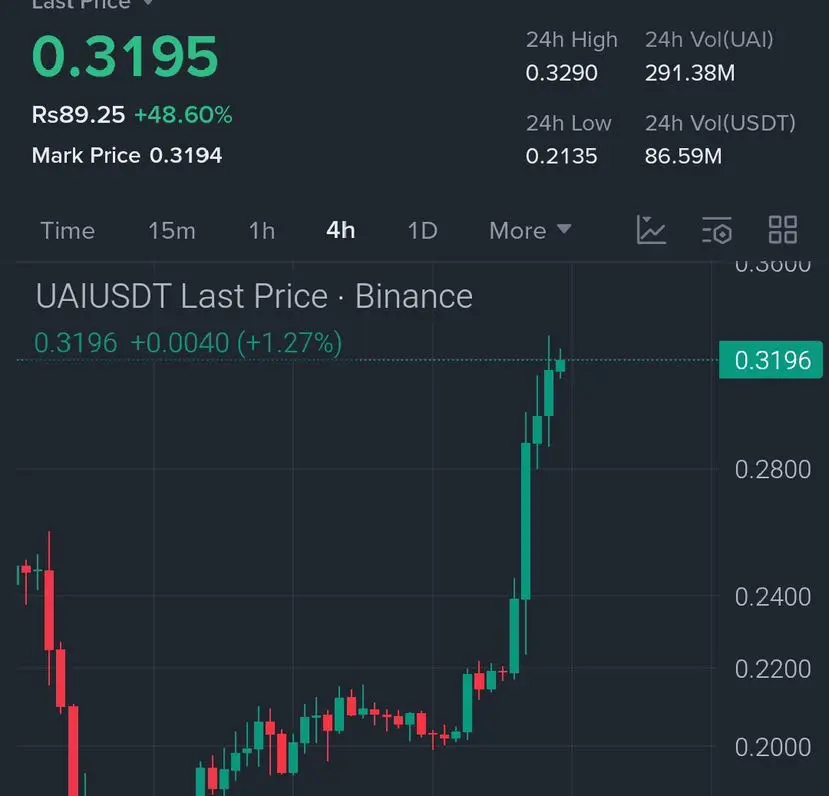
When Bitcoin starts trending strongly, attention grows.
When altcoins start pumping, social media explodes.
When candles get bigger, more people enter.
That’s when participation peaks.
And ironically, that’s when risk becomes the highest.
The market doesn’t punish beginners for being wrong.
It punishes them for arriving after the easy part is over.
By the time the average trader feels confident: • Liquidity has already rotated
• Early buyers are already in profit
• Leverage is already crowded
The chart looks strongest right before it becomes fragile.
This is why so many traders feel like the market is “against them.”
It isn’t.
They’re just reacting to emotion instead of structure.
Professional traders don’t get excited when price moves fast.
They get cautious.
Because fast moves attract attention. And attention attracts late buyers.
Late buyers become liquidity.
Crypto is not designed to reward excitement.
It rewards patience during the quiet phases — when no one is talking about the move yet.
That’s when opportunity usually begins.
Not when the candle is already on the screen.
#GateFebruaryTransparencyReport #GlobalOilPricesSurgePast$100
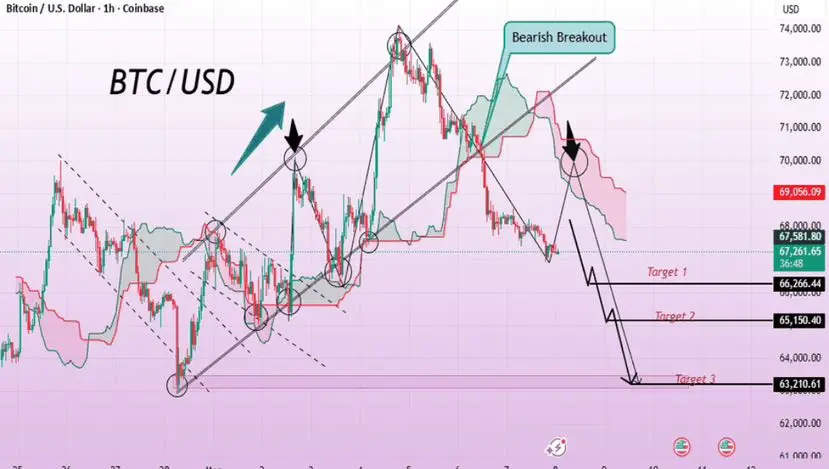
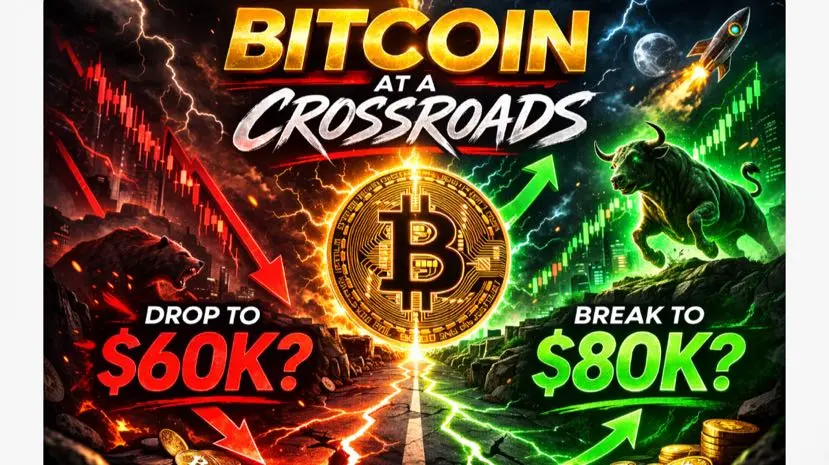
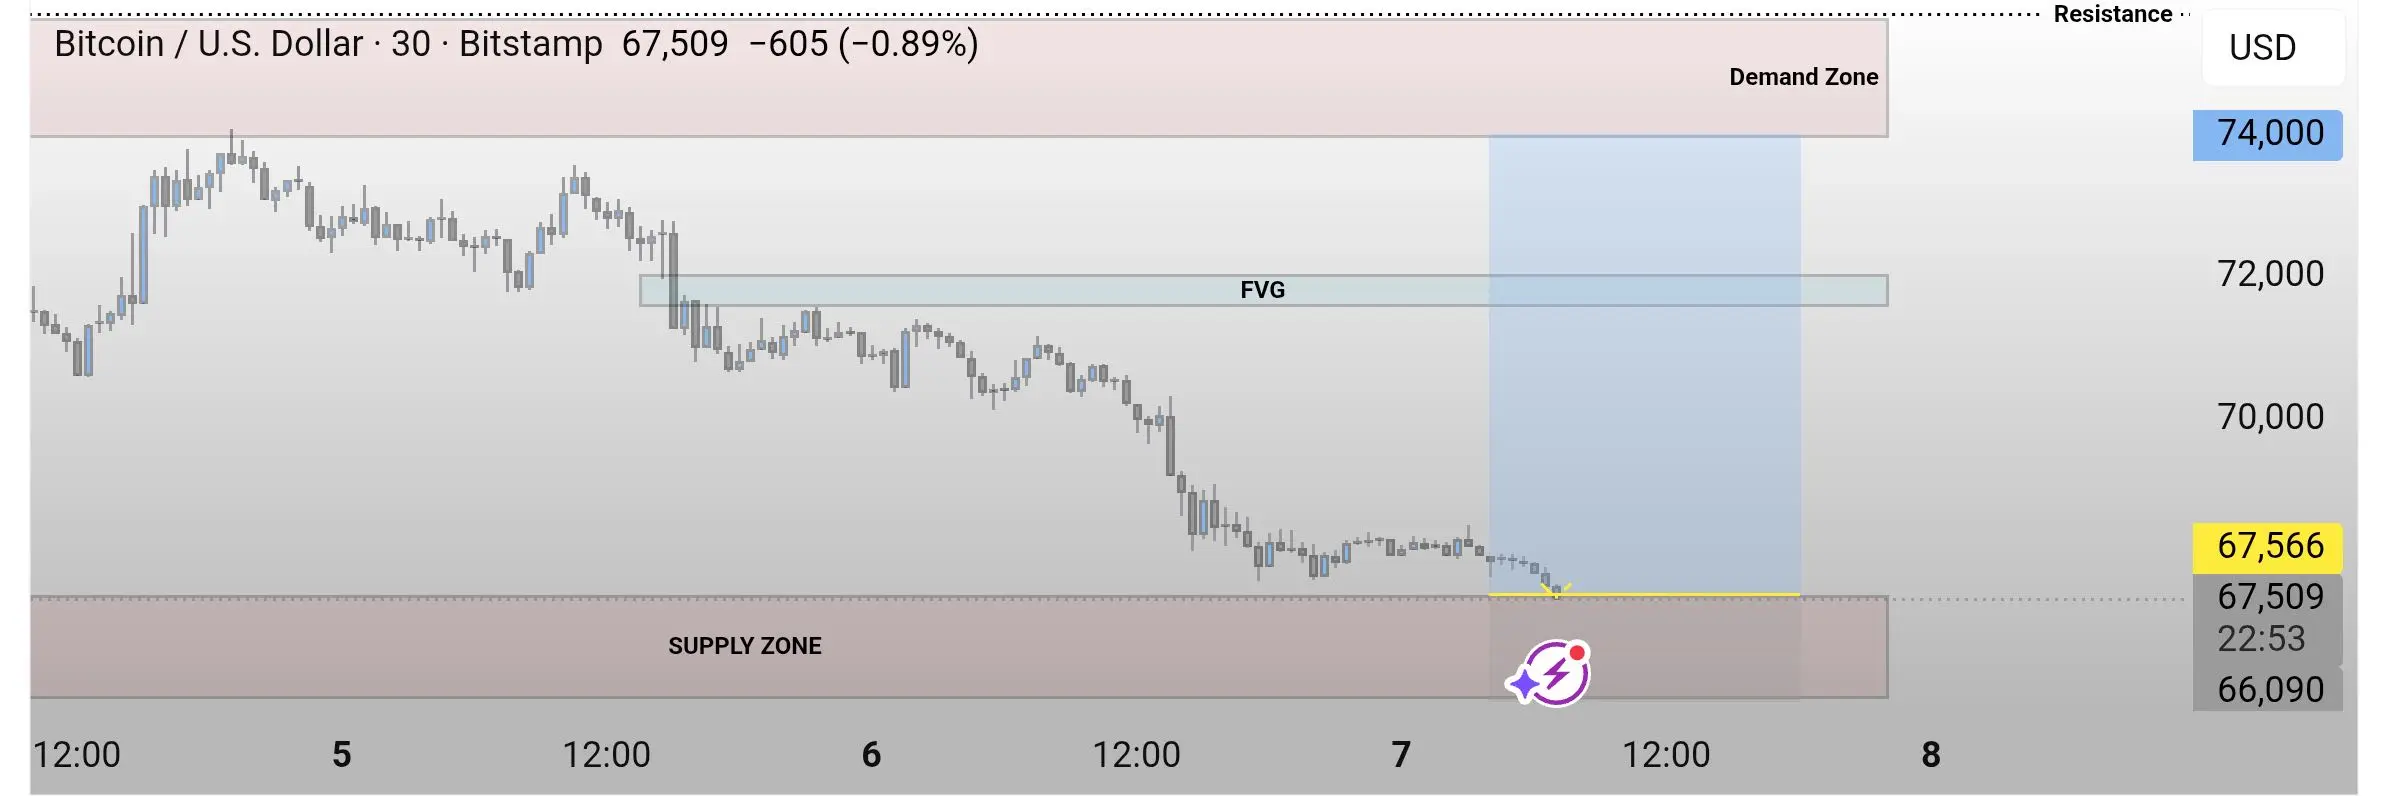
$BTC
Most people think losing money in crypto comes from bad timing.
Buying the wrong coin.
Entering too late.
Missing the exit.
But after watching this market for years, the pattern is much simpler.
Most traders lose for one reason:
They trade when the market is most exciting.
Excitement in crypto usually means one thing — the move is already mature.
When Bitcoin starts trending strongly, attention grows.
When altcoins start pumping, social media explodes.
When candles get bigger, more people enter.
That’s when participation peaks.
And ironically, that’s when risk becomes the highest.
The market doesn’t punish beginners for being wrong.
It punishes them for arriving after the easy part is over.
By the time the average trader feels confident: • Liquidity has already rotated
• Early buyers are already in profit
• Leverage is already crowded
The chart looks strongest right before it becomes fragile.
This is why so many traders feel like the market is “against them.”
It isn’t.
They’re just reacting to emotion instead of structure.
Professional traders don’t get excited when price moves fast.
They get cautious.
Because fast moves attract attention. And attention attracts late buyers.
Late buyers become liquidity.
Crypto is not designed to reward excitement.
It rewards patience during the quiet phases — when no one is talking about the move yet.
That’s when opportunity usually begins.
Not when the candle is already on the screen.
#GateFebruaryTransparencyReport #GlobalOilPricesSurgePast$100
$BTC