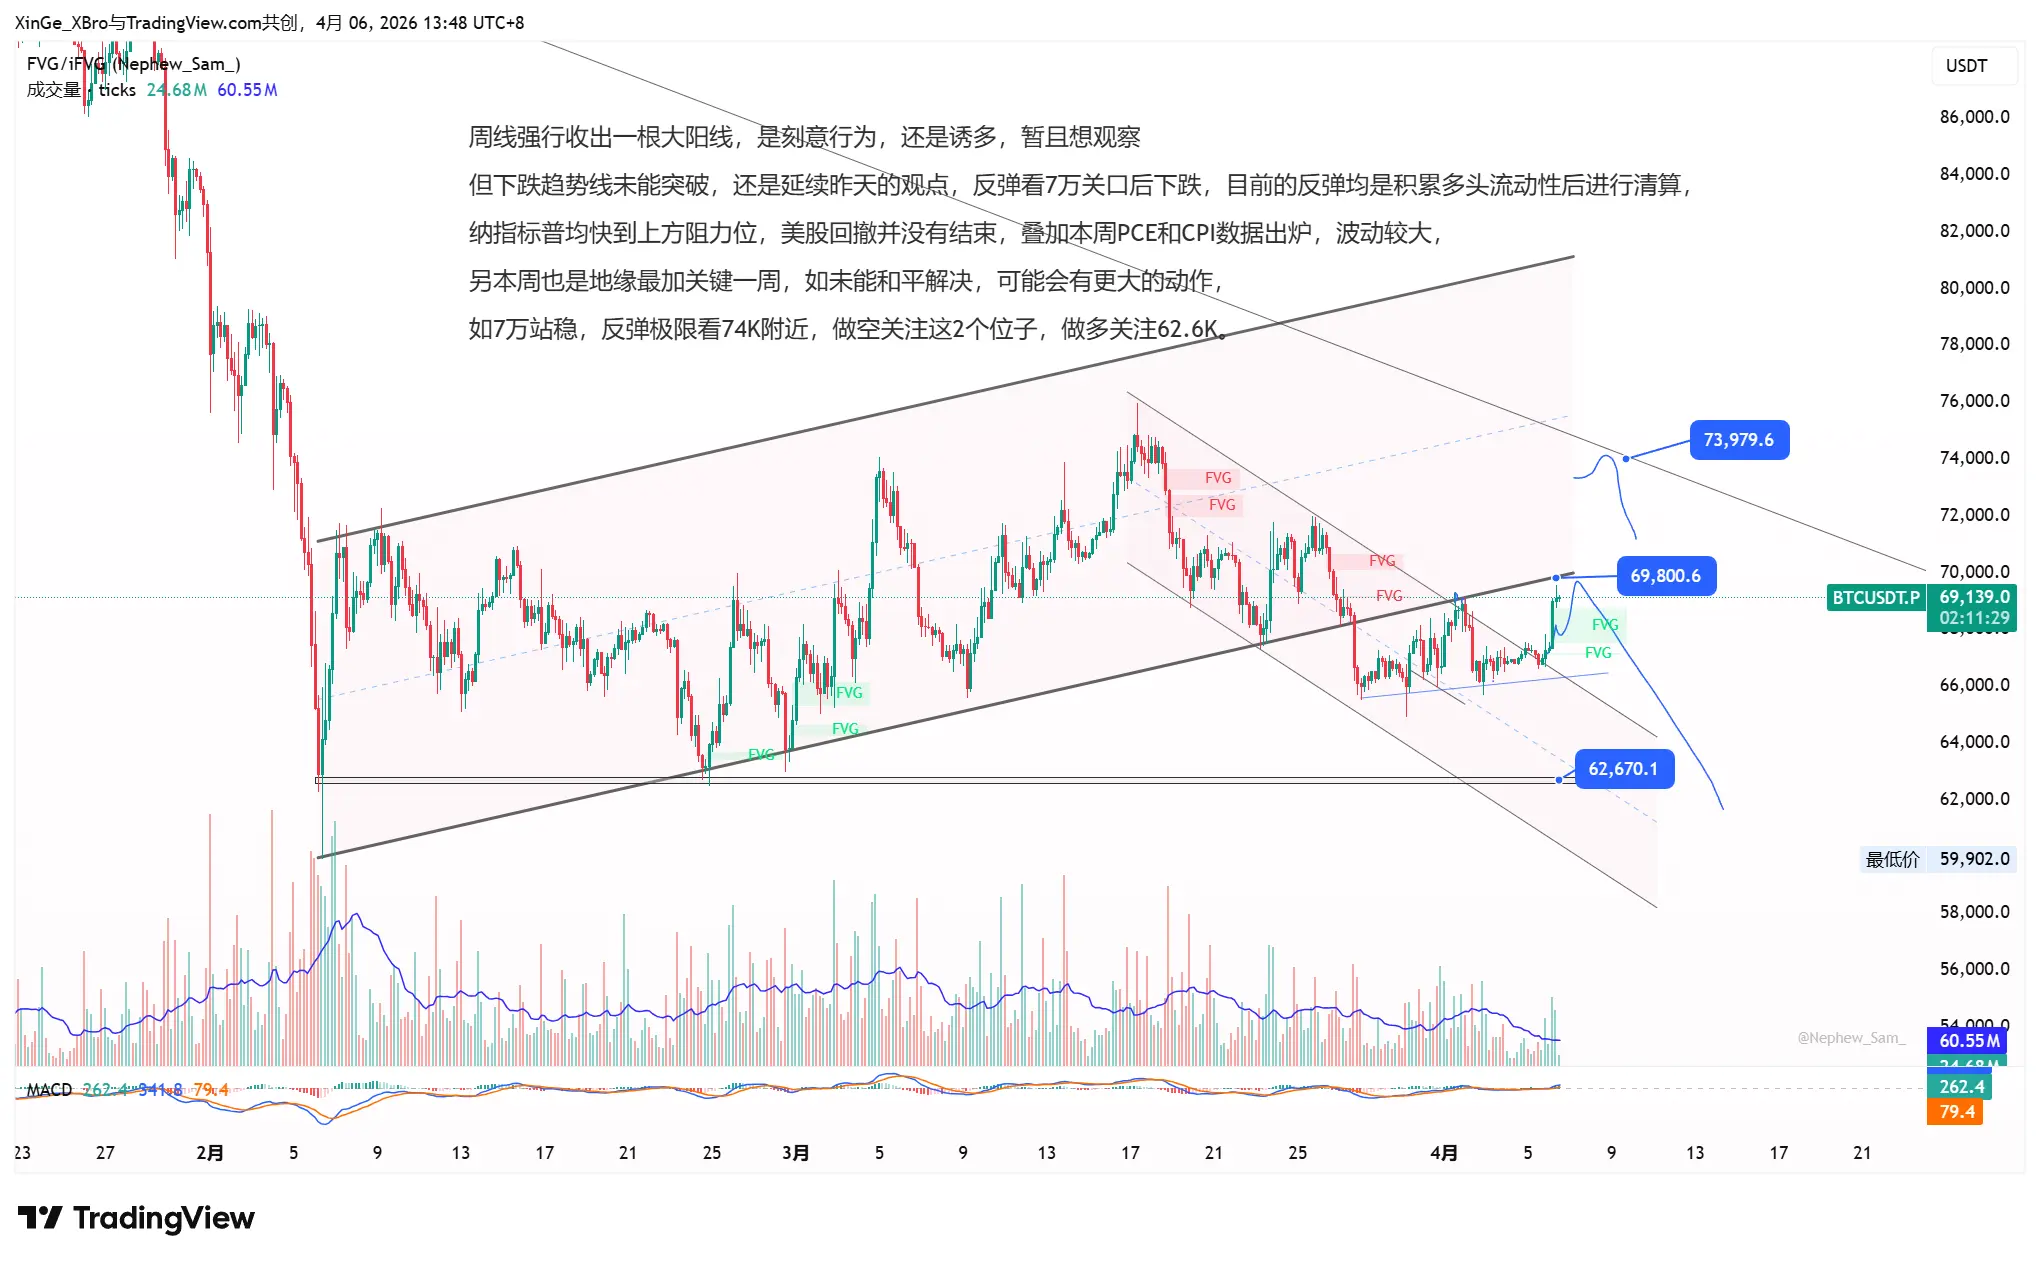
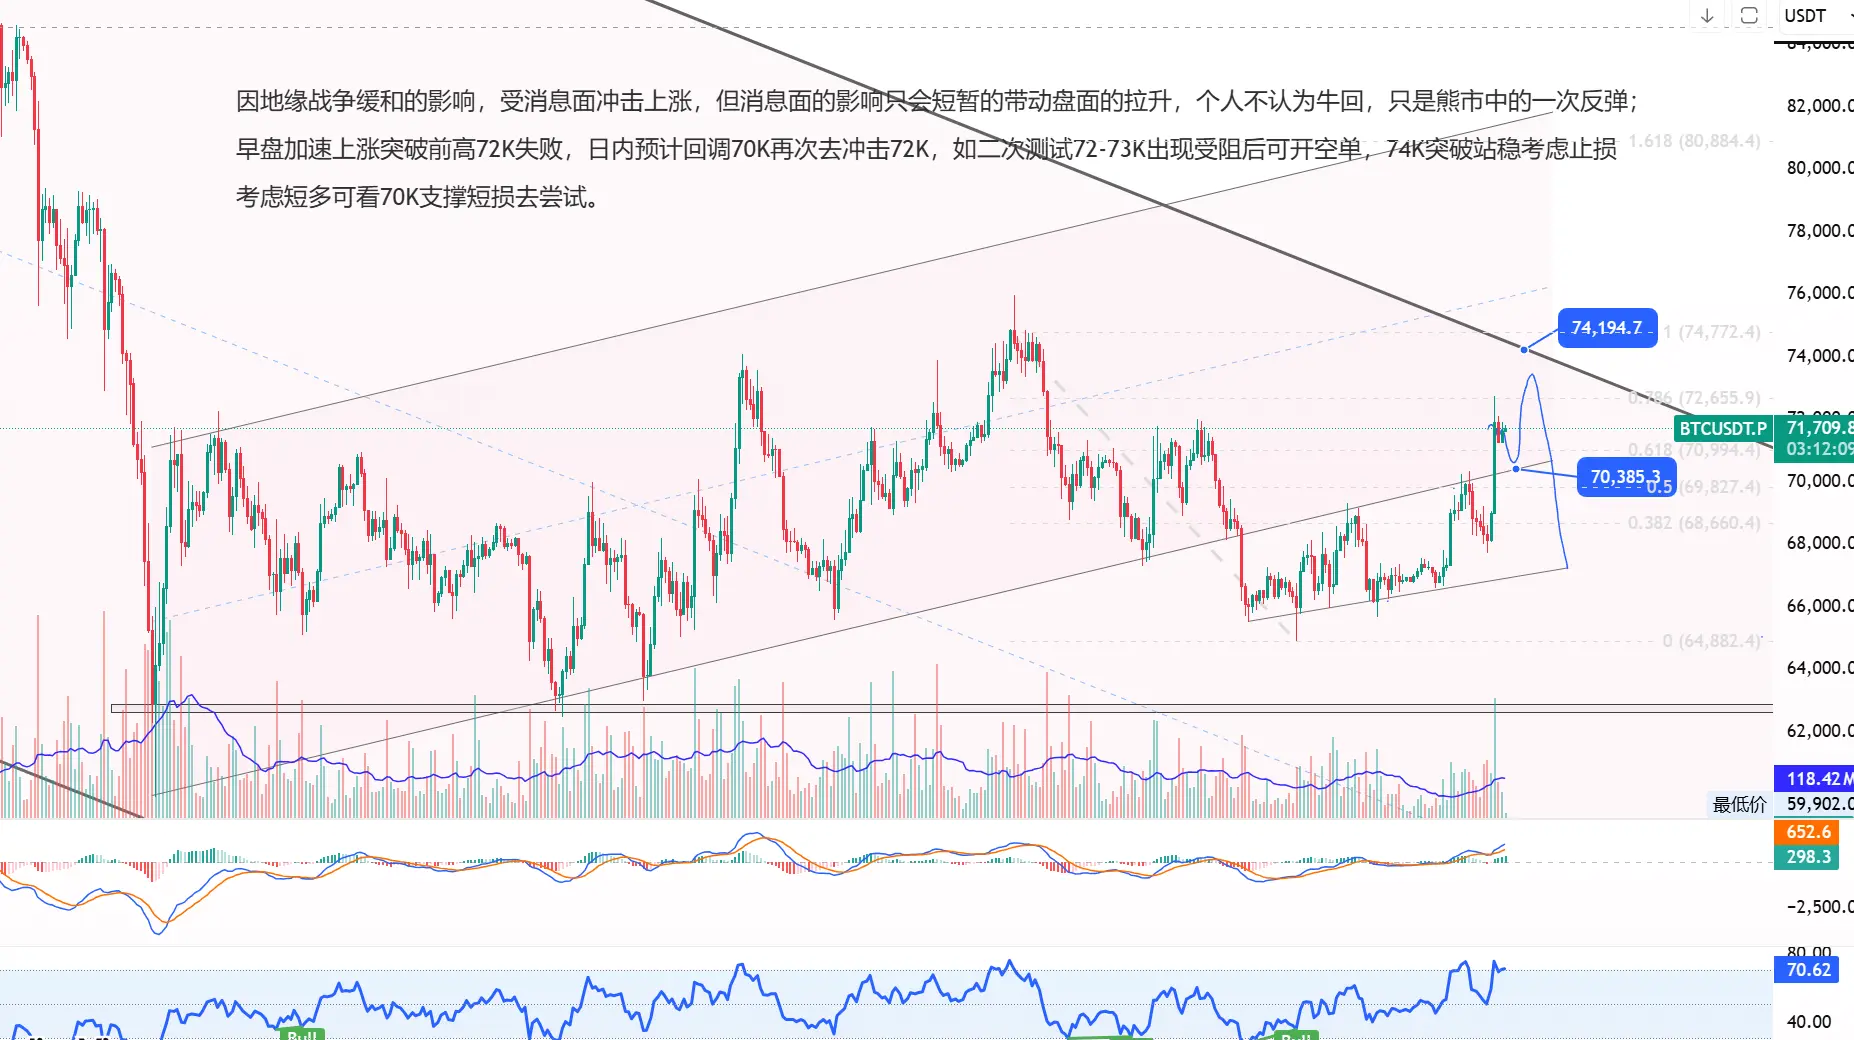
The weekly chart forcibly closed with a large bullish candle. Is this intentional behavior or a trap to lure buyers? For now, I want to observe.
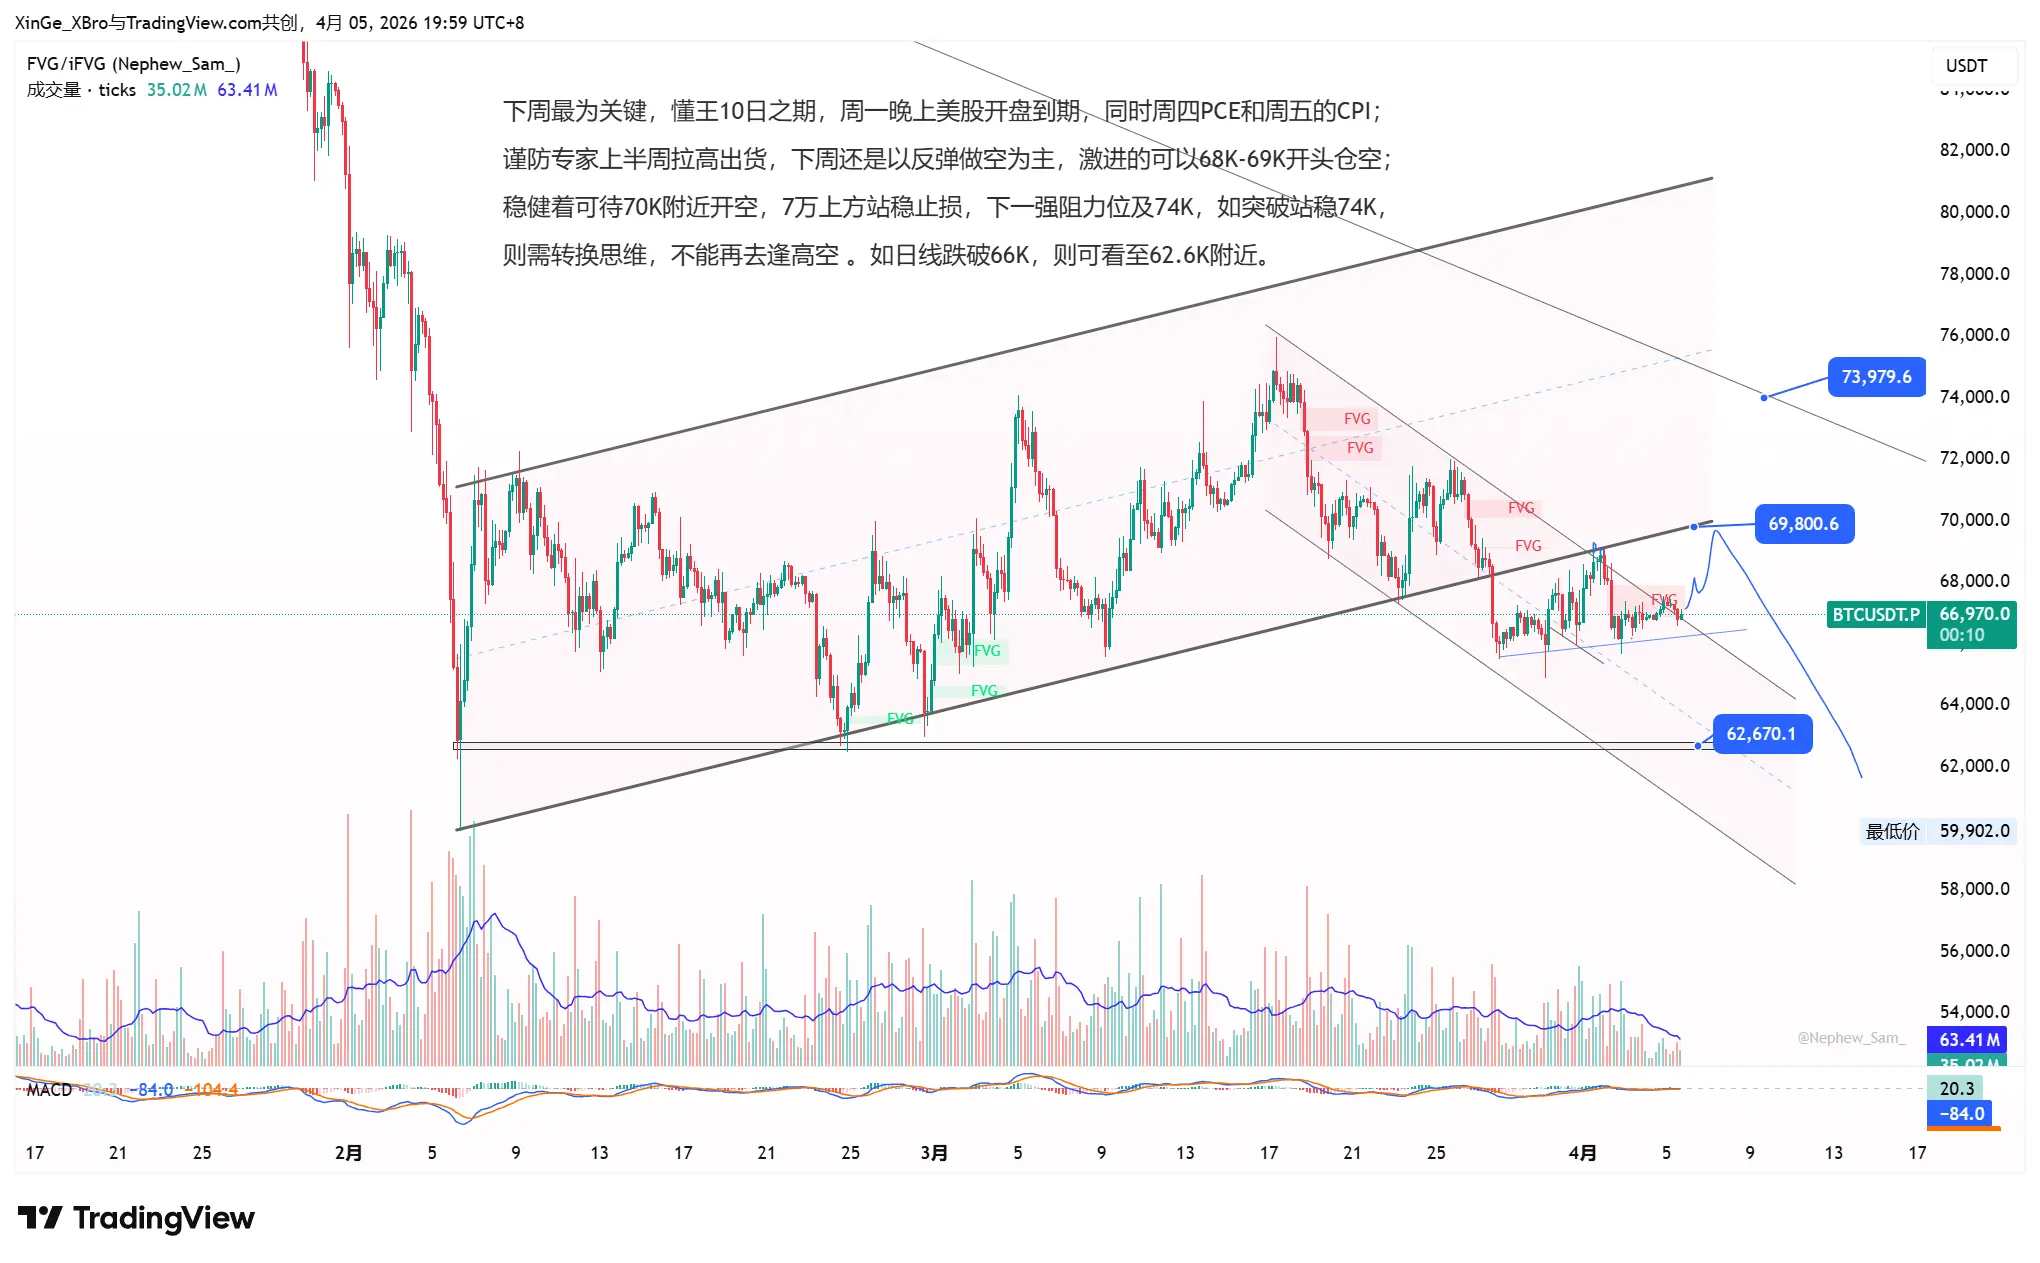
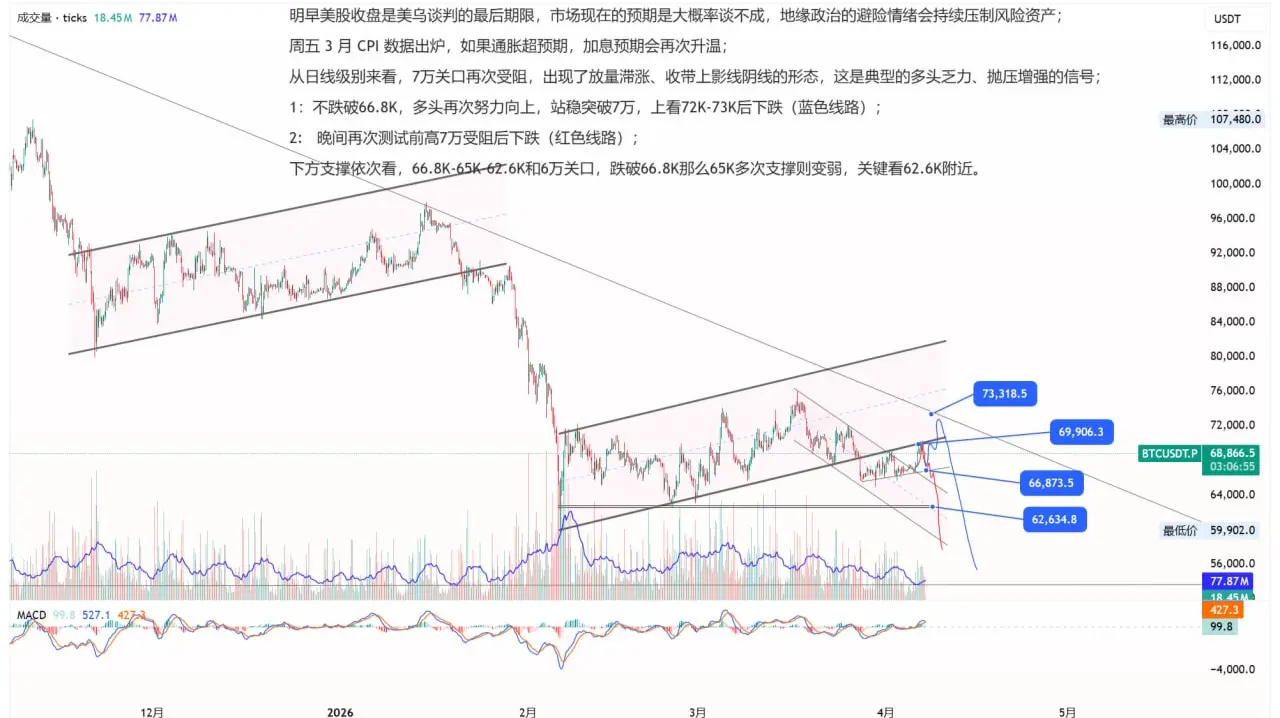
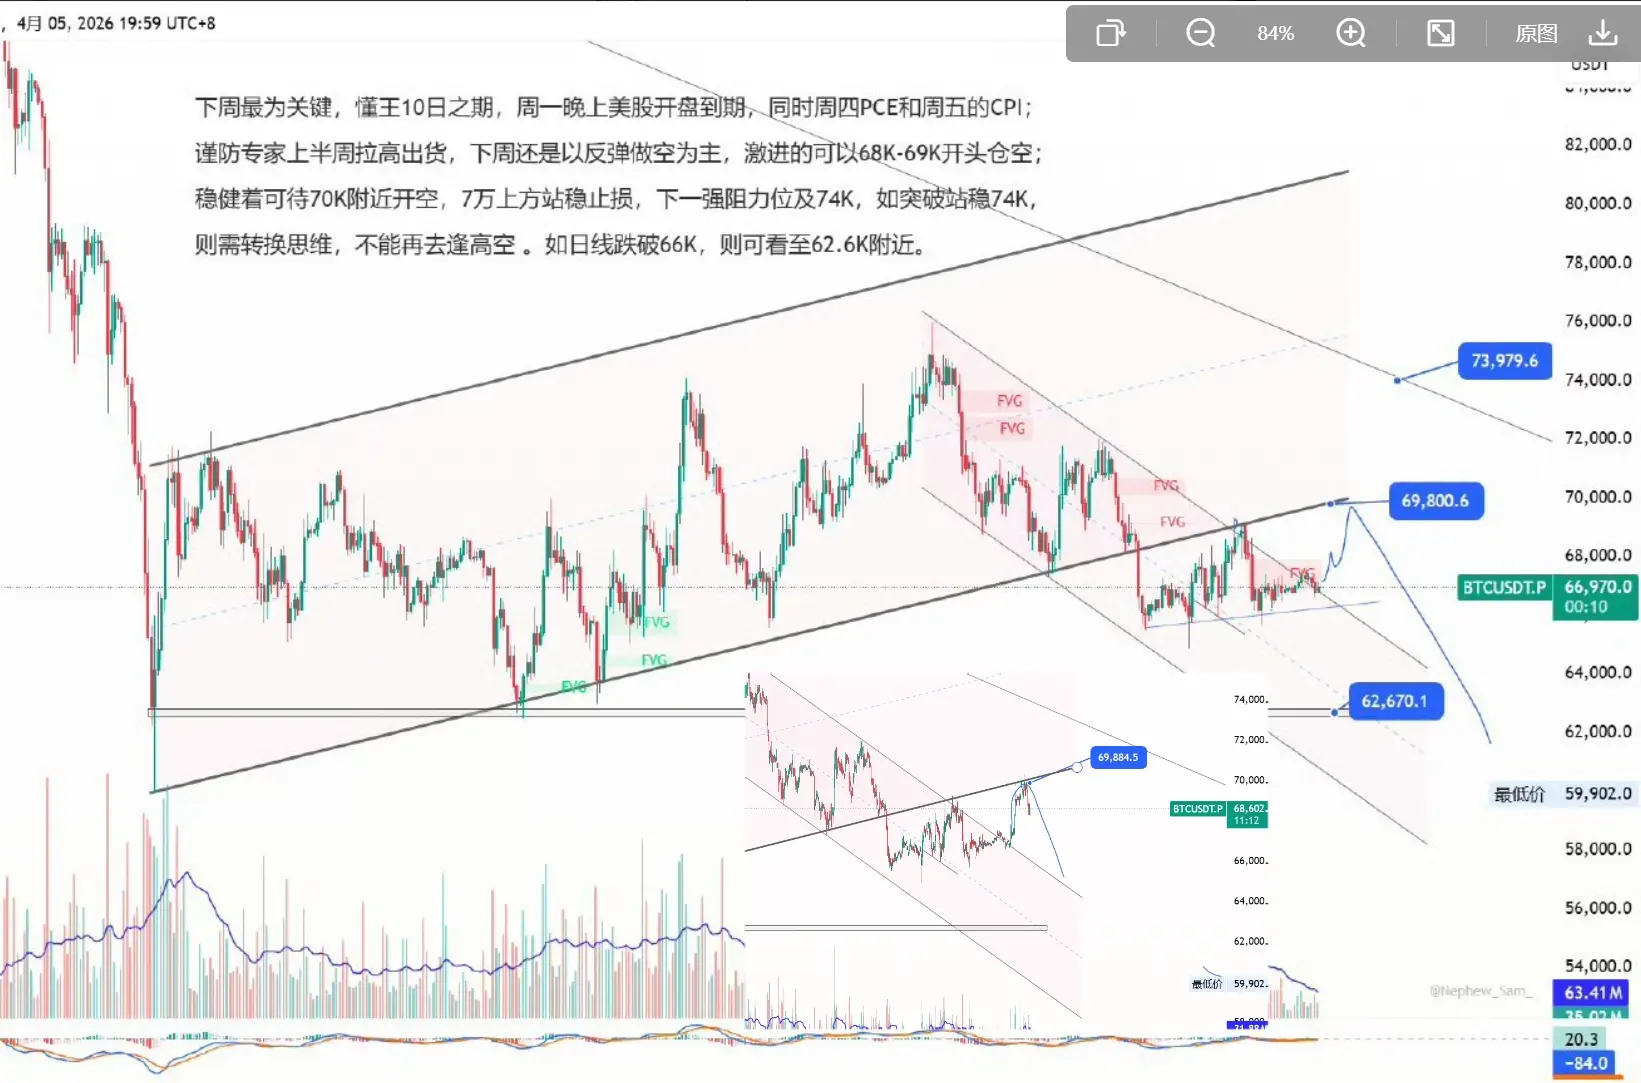
But the downward trend line has not been broken, so I still stick to yesterday's view: after a rebound to the 70k level, expect a decline. Currently, the rebound is just an accumulation of bullish liquidity before a liquidation.
The NASDAQ and S&P 500 are approaching resistance levels. The US stock market's pullback is not over yet. Coupled with this week's PCE and CPI data releases, volatility is expected to be high.
Additionally, this week is the most critical week geopolitically. If a peaceful resolution is not reached, larger movements may occur.
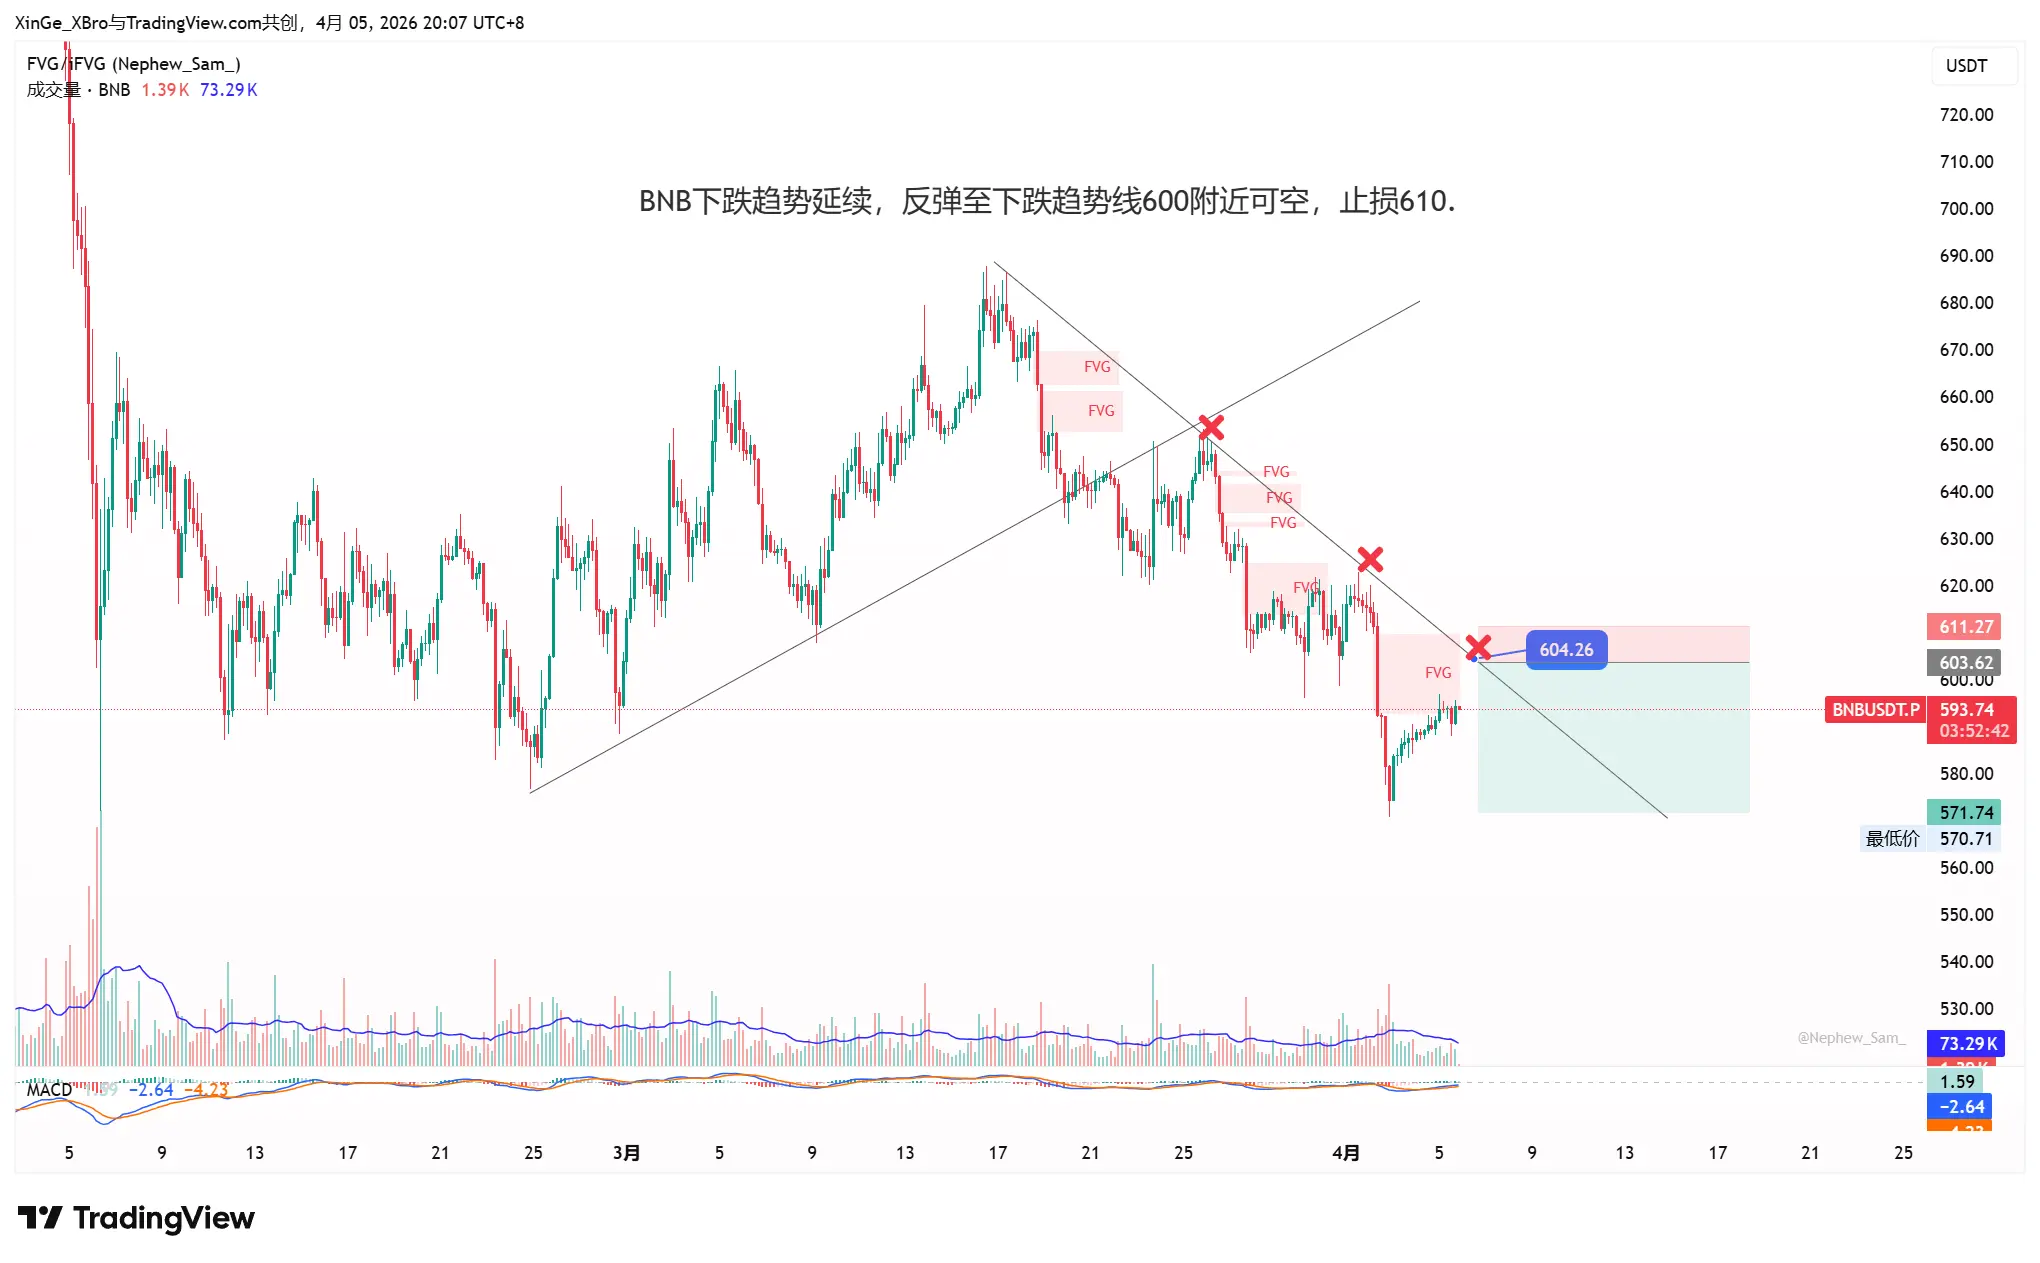
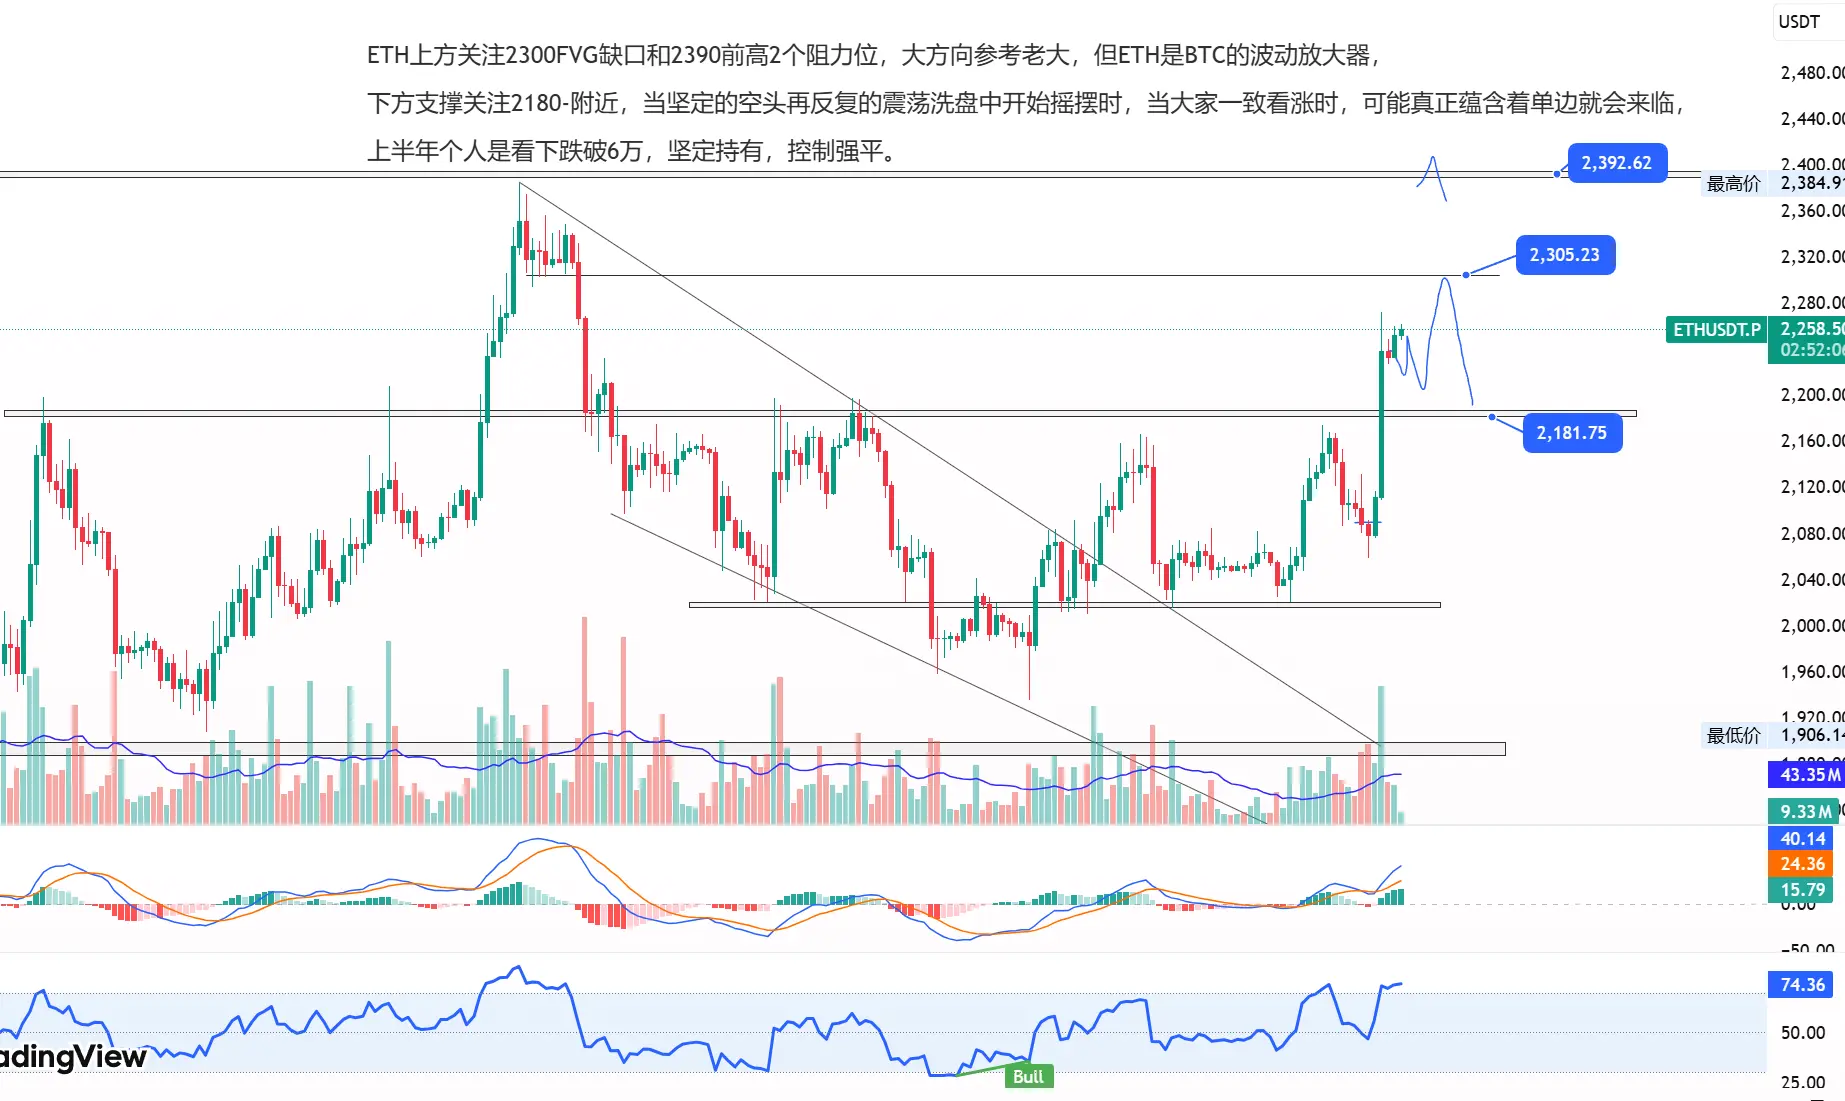
If the 70k level holds, the rebound limit is around 74K. For short positions, focus on these two levels; for long positions, watch 62.6K. $BTC $ETH #加密市场行情震荡
But the downward trend line has not been broken, so I still stick to yesterday's view: after a rebound to the 70k level, expect a decline. Currently, the rebound is just an accumulation of bullish liquidity before a liquidation.
The NASDAQ and S&P 500 are approaching resistance levels. The US stock market's pullback is not over yet. Coupled with this week's PCE and CPI data releases, volatility is expected to be high.
Additionally, this week is the most critical week geopolitically. If a peaceful resolution is not reached, larger movements may occur.
If the 70k level holds, the rebound limit is around 74K. For short positions, focus on these two levels; for long positions, watch 62.6K. $BTC $ETH #加密市场行情震荡