
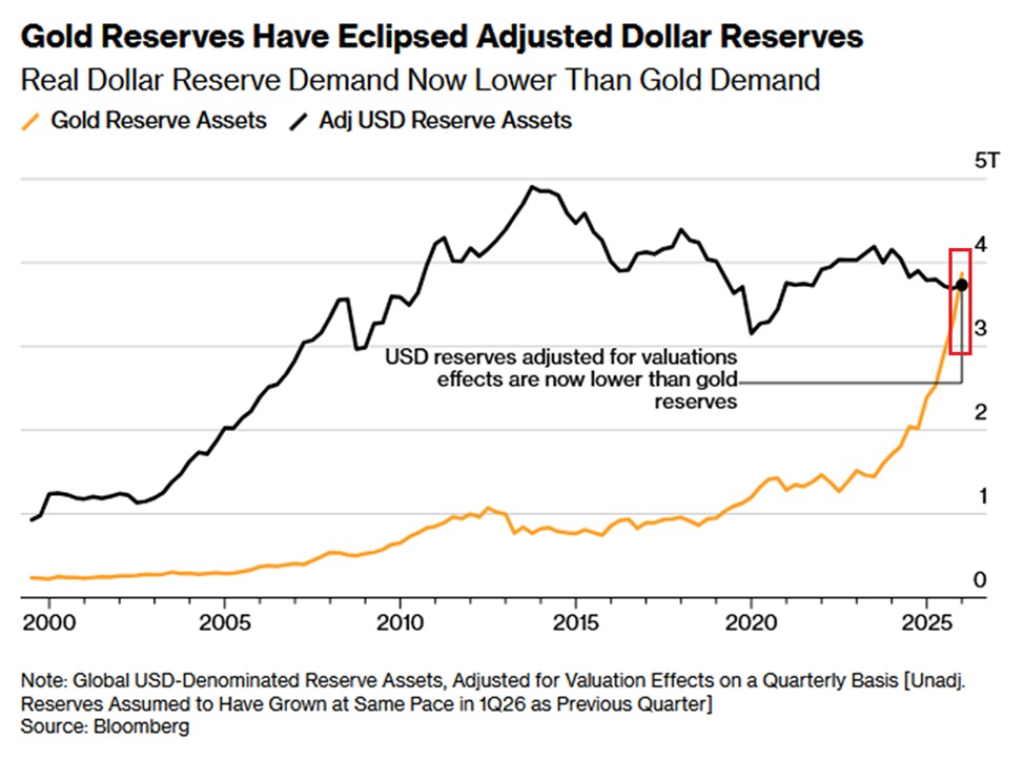
A single chart shared on X by The Kobeissi Letter tells a story the world’s central banks have been writing for four years. Gold reserve assets now exceed valuation‑adjusted US dollar reserves for the first time on record. Official gold reserve assets reached $3.87 trillion.
Valuation‑adjusted US dollar reserves stand at $3.73 trillion. That is a $140 billion gap in gold’s favor. The chart makes a critical distinction. Standard dollar reserve figures include interest earned on holdings like US Treasuries. Adjusted reserves remove that interest. They show only what central banks are actively adding to their dollar reserves.
By that measure, demand for dollar reserves has fallen below demand for gold. The adjusted line tells the truth about central bank behavior, not just accumulated returns. Since 2022, gold reserve assets have tripled. Central banks bought at a record pace. Prices surged. Meanwhile, USD reserve assets declined by $300 billion. The trigger is named in the tweet: the seizure of Russian assets in 2022, new sanctions, and growing geopolitical uncertainty.
Source: X/@KobeissiLetter
Central banks in non‑Western countries drew one conclusion – dollar reserves can be frozen or confiscated. Gold cannot. The chart ends in 2026. The note explains that unadjusted reserves are assumed to have grown at the same pace in the first quarter of 2026 as the previous quarter.
That is a conservative estimate. The actual gap could be wider. The crossover between the gold line and the adjusted dollar line is sharp. It happens in late 2025 or early 2026. Before that, the two lines moved in rough parallel.
After the Russian asset freeze, they diverged. The tweet from The Kobeissi Letter sums it up: “Gold is reshaping the global financial system.” Central banks are accumulating gold at an unprecedented pace. Adjusted dollar reserves are shrinking.
For the first time, one line sits below the other. That is not a temporary blip. It is a structural change. And the chart proves it.
Read also: Gold Price Prediction: The Logarithmic Secret That Predicts Gold’s $10,000 Bull Run
Disclaimer: The information on this page may come from third parties and does not represent the views or opinions of Gate. The content displayed on this page is for reference only and does not constitute any financial, investment, or legal advice. Gate does not guarantee the accuracy or completeness of the information and shall not be liable for any losses arising from the use of this information. Virtual asset investments carry high risks and are subject to significant price volatility. You may lose all of your invested principal. Please fully understand the relevant risks and make prudent decisions based on your own financial situation and risk tolerance. For details, please refer to
Disclaimer.
