Original Title: Awaiting Liquidity
Original Authors: Chris Beamish, CryptoVizArt, Antoine Colpaert, Glassnode
Original Compilation: AididiaoJP, Foresight News
Bitcoin has stabilized around $70,000 with improved capital flows and easing seller pressure. However, spot trading volume remains low, and supply pressure above the market indicates that stronger demand is still needed to sustain a lasting recovery.
Summary
-
Bitcoin has gradually stabilized after a sharp sell-off that touched around $67,000, rebounding toward $70,000, but the upward momentum remains hesitant.
-
Unrealized losses have increased but are still within normal historical ranges, indicating market pressure but not full capitulation.
-
A large portion of short-term holders’ supply is concentrated between approximately $93,000 and $97,000, forming a key resistance zone above.
-
Realized losses remain high but show no signs of panic, suggesting the current phase is orderly risk reduction rather than frantic selling.
-
Spot trading volume stays subdued, with no significant increase during the price rebound, reflecting lack of market confidence and selective bottom-fishing behavior.
-
Funds on US spot trading platforms have shifted from continuous net outflows to slight net inflows, indicating institutional capital may be beginning to re-enter.
-
Perpetual contract funding rates remain negative, signaling persistent bearish sentiment and cautious positioning in derivatives.
-
Open interest in futures remains relatively low, suggesting limited leverage expansion supporting this rebound.
-
In options markets, skew indicators are stabilizing, and implied volatility fluctuates within a range, indicating reduced demand for downside hedging.
-
Market maker gamma positions have slightly turned positive, showing improved liquidity and a more balanced market structure.
On-Chain Insights
Higher Lows, Heavy Resistance
Despite ongoing geopolitical tensions causing uncertainty in equities, energy, and commodities markets, Bitcoin has been making higher highs and higher lows since early March, forming a constructive structure within the $60,000 to $70,000 range.
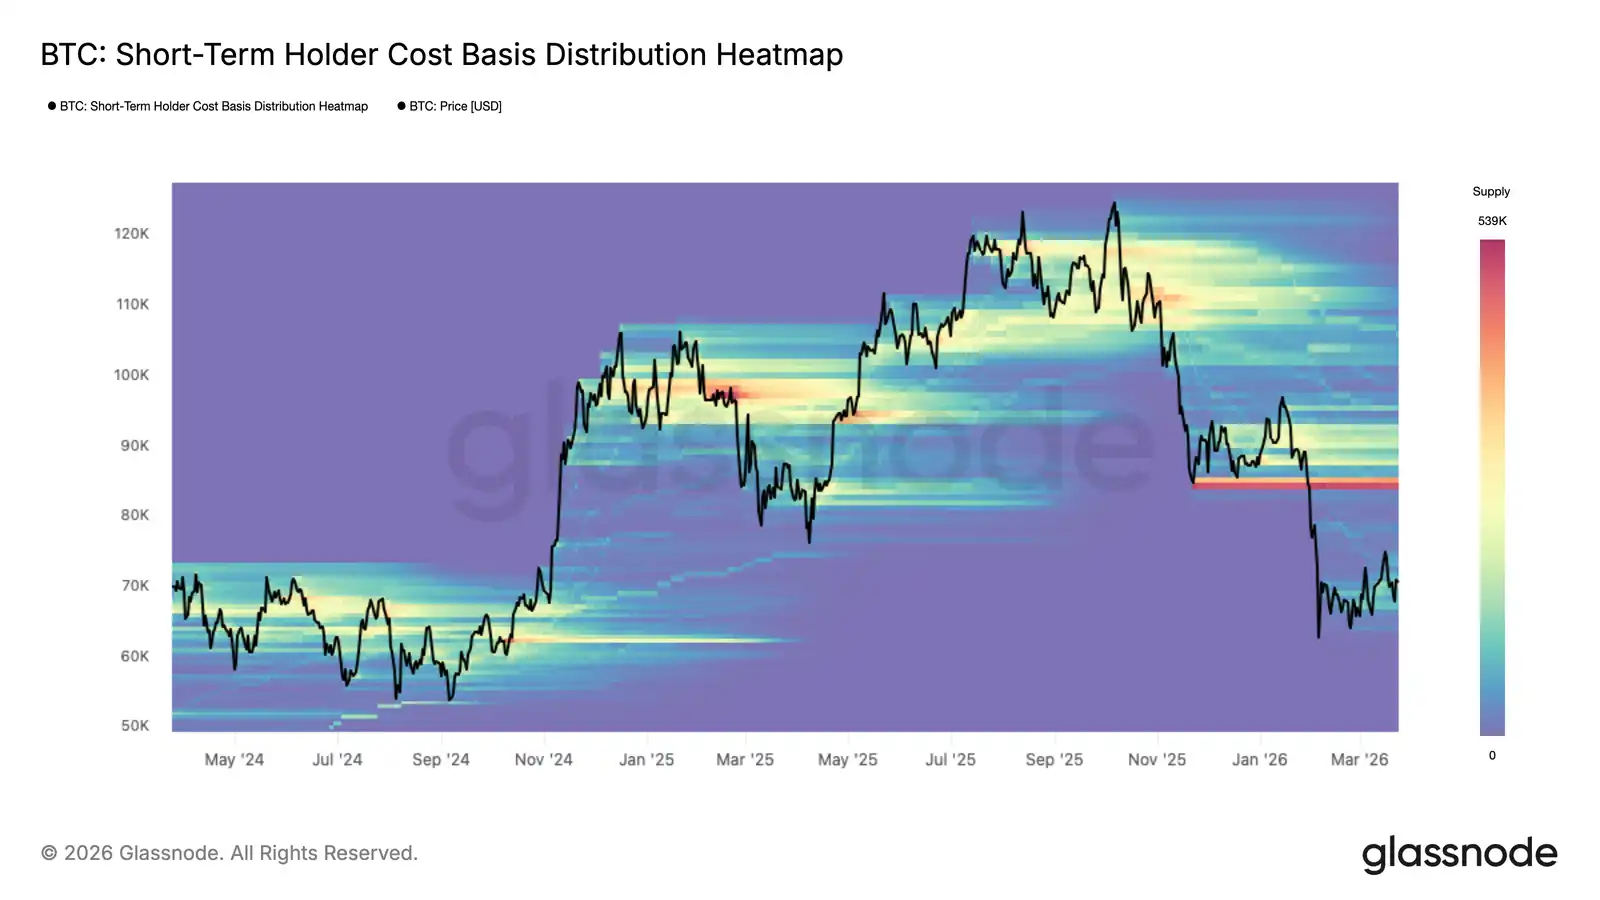
If this resilience continues, it could lay a relatively solid foundation for a long-term upward trend. A heatmap of recent supply distribution among short-term holders highlights price zones where supply has recently been acquired, helping identify potential supply and demand levels from new entrants’ perspectives.
Currently, new accumulation zones are gradually forming, though modest in size, enough to explain some recent upward momentum. However, medium-term risks remain, notably a large supply concentrated between approximately $84,000 and $97,000. Whether prices rebound to this zone or face renewed selling pressure, this group could amplify sell-offs.
Medium-Term Range
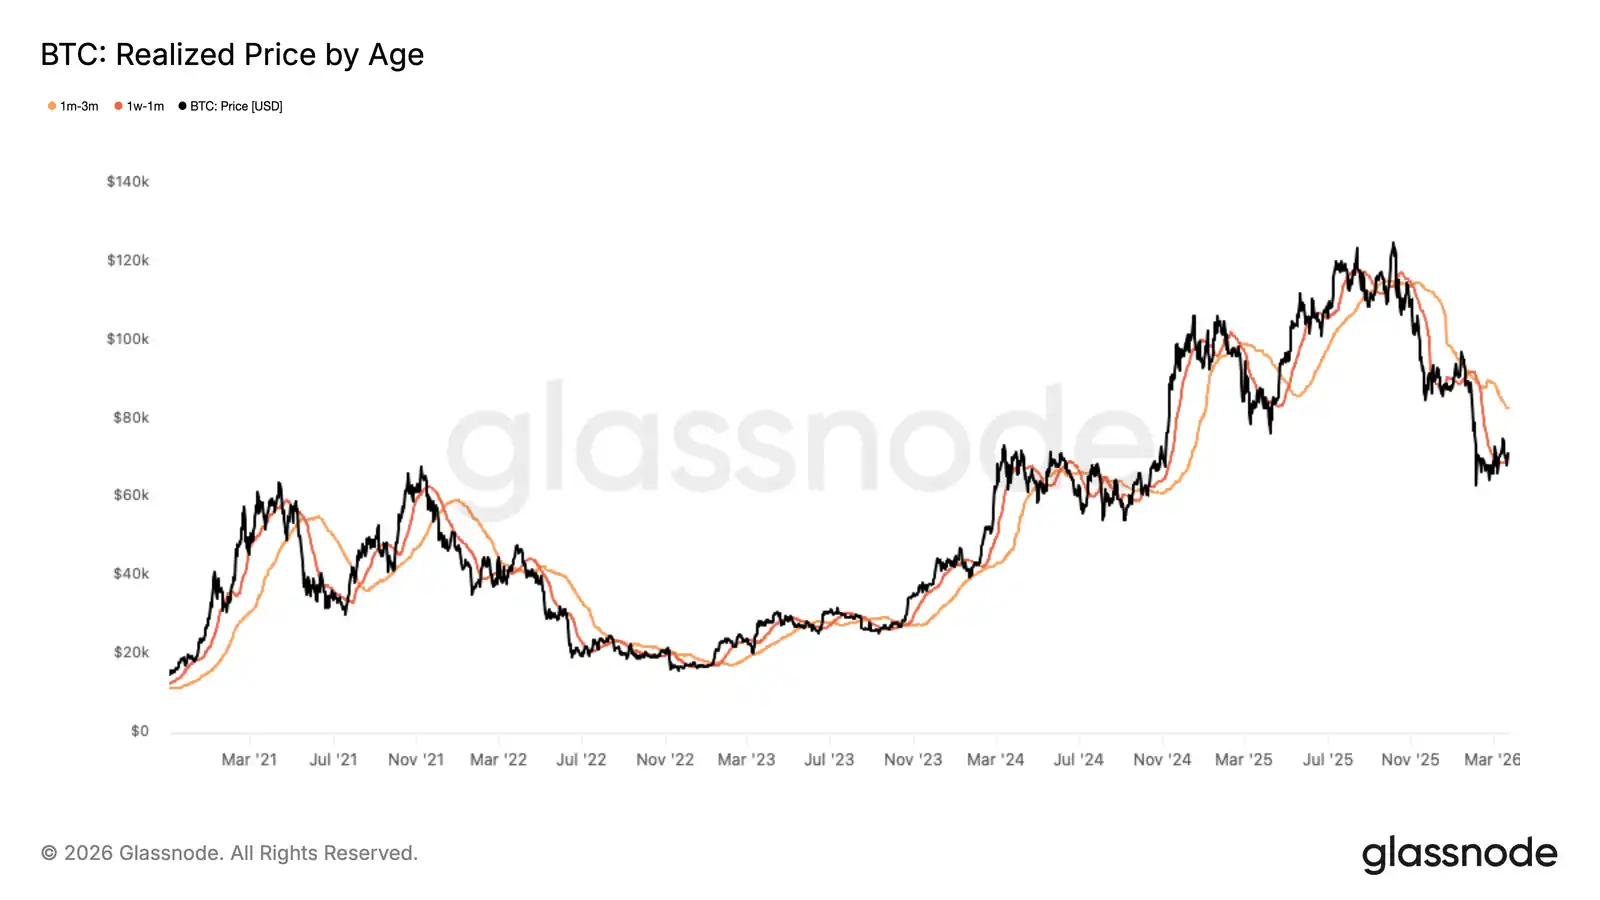
Building on the supply dynamics, a realized price decomposition based on holding periods offers a more detailed view of investor cost bases, helping delineate support and resistance levels from a behavioral standpoint.
Currently, holders with 1 week to 1 month of holding have an average cost basis around $70,200, forming a support zone; those holding 1 to 3 months average around $82,200, reinforcing the resistance above.
Together, these levels define the most probable medium-term trading range. However, given the limited size of current accumulation zones, the support at $70,200 needs to be tested; a break below could signal further downside risk.
Fear Intensifies, No Capitulation Yet
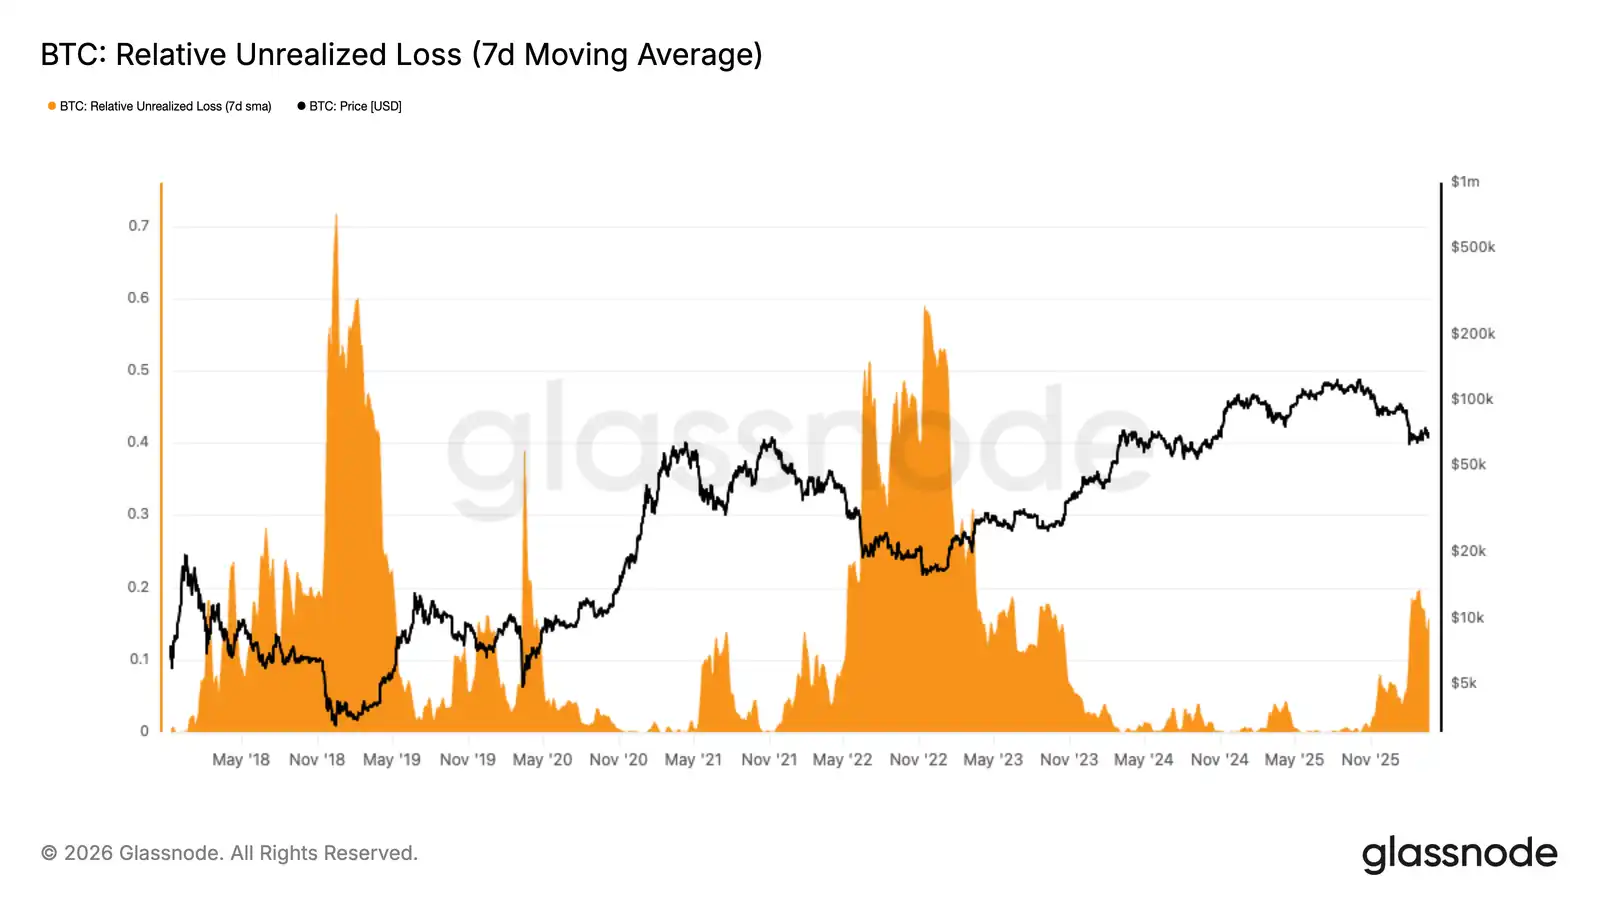
Extending from the detailed cost basis metrics, profit and loss indicators provide a macro view of market greed and fear, offering insights into potential cycle phases. The ratio of total unrealized losses to market cap is a key indicator of potential selling pressure and market sentiment.
Over the past two months, this indicator has remained above 15% of market cap, similar to levels seen in Q2 2022. This suggests a high fear environment but not yet at the extreme capitulation levels seen during events like the FTX collapse.
Historically, resolving current unrealized losses typically takes time, further price adjustments, or both. While a quick V-shaped reversal is possible, it would require a substantial influx of new capital in the short term.
Profit Flow Dwindles
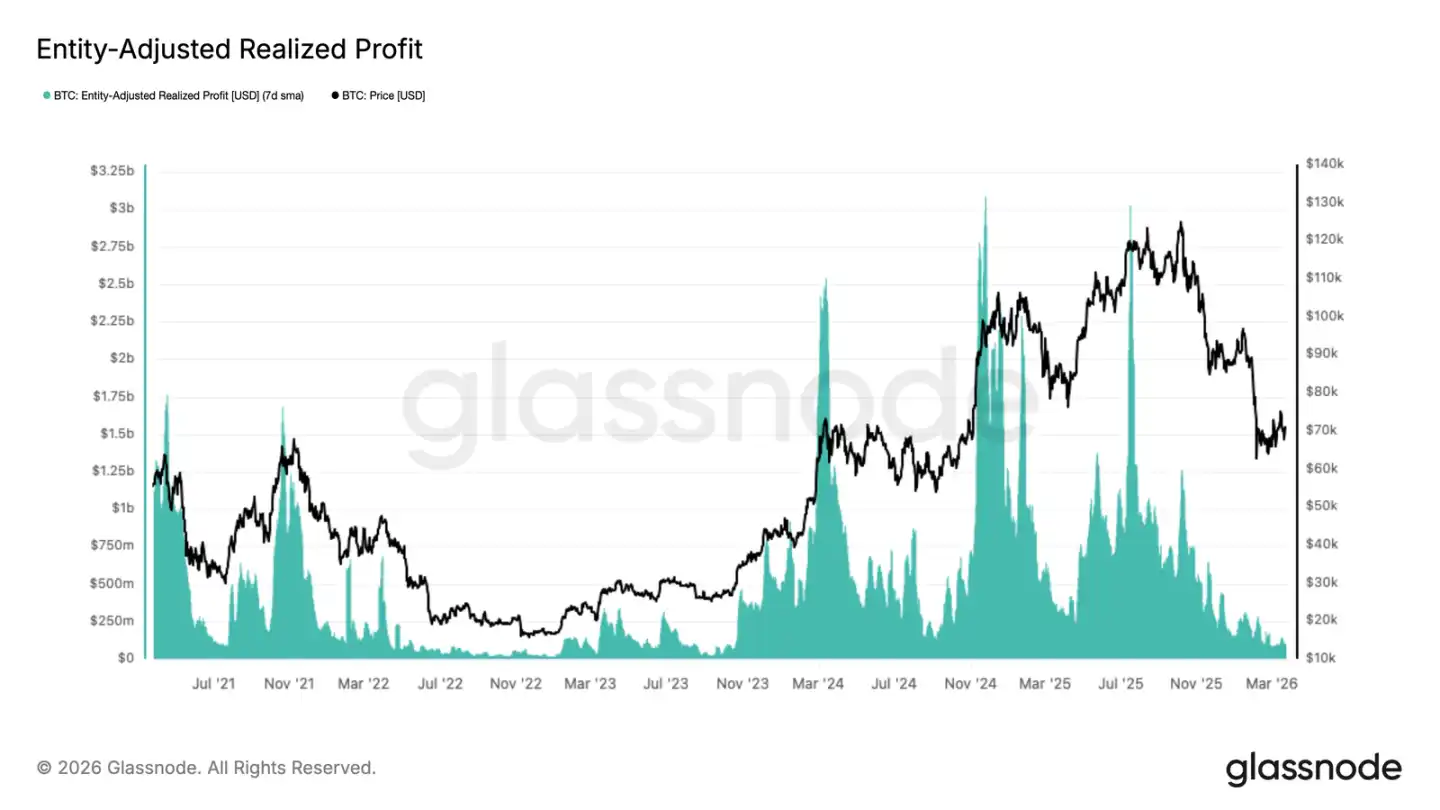
Amid rising unrealized fear, realized profits have been shrinking significantly since Q4 2025, further confirming demand weakness.
Adjusted for exchange internal transfers, the realized profit (smoothed with a 7-day moving average) accurately reflects real profit-taking activity. It has fallen from a peak of about $3 billion daily in July 2025 to less than $10 million now, a decline of over 96%.
Such a sharp contraction is typical of late-stage bear markets, where profit-taking sellers have largely exited, and on-chain liquidity hits cyclical lows. While this environment reduces short-term selling pressure, it also indicates a lack of fresh capital supporting ongoing recovery.
Off-Chain Insights
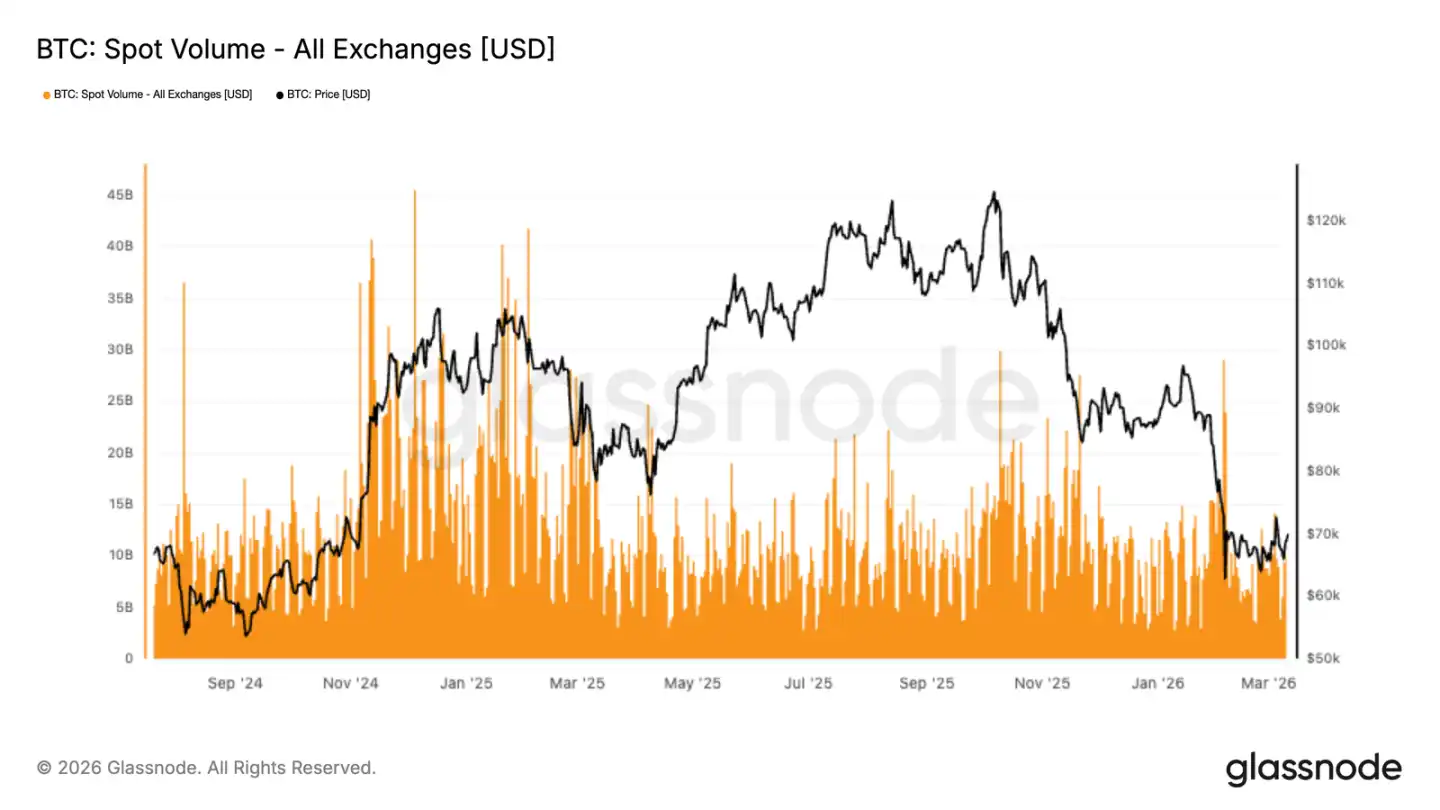
Spot Volume Remains Low
After prices plunged to around $67,000, overall spot market activity stayed muted. During the subsequent rebound, major exchanges saw only modest volume increases. Occasional short-lived spikes reflect passive reactions rather than sustained confidence-driven buying.
Compared to the more active participation during earlier upward moves, current spot volume remains weak. The recent price rise near $70,000 appears driven mainly by selective dip-buying and short-term repositioning, not broad-based demand.
The divergence between a stabilizing price trend and low spot activity suggests the market is still rebalancing. Until spot trading expands more consistently, the upward momentum may remain fragile, with derivative flows and liquidity playing a larger role than organic accumulation.
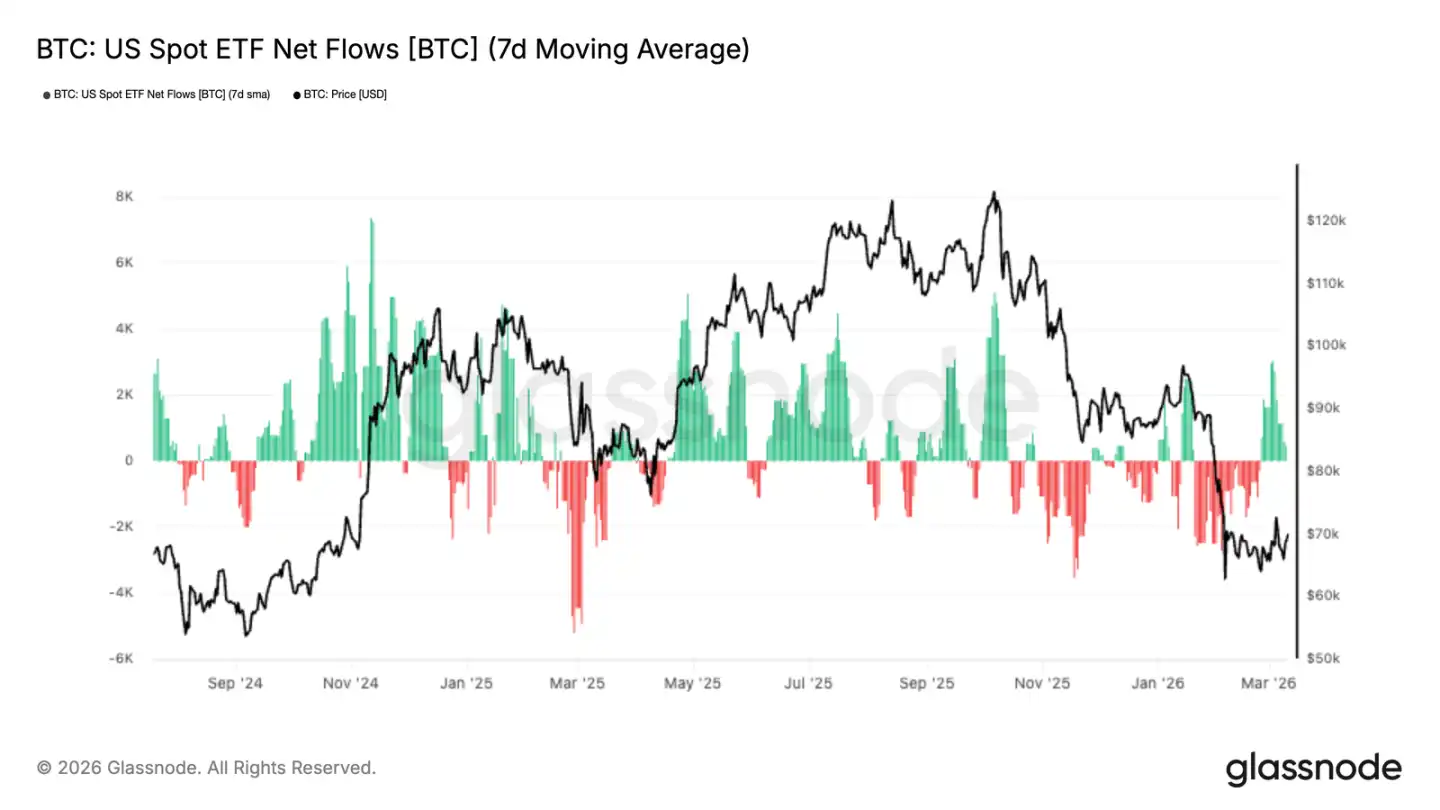
Platform Fund Flows Rebound
After a prolonged period of net outflows, US spot trading platform funds have recently shown signs of improvement, with the 7-day moving average turning slightly positive. This suggests that as Bitcoin stabilized and rebounded from around $67,000, institutional demand may be gradually returning.
While the absolute scale of inflows remains modest compared to previous accumulation phases, the directional shift is noteworthy. Prior net outflows coincided with weak prices and low market sentiment, whereas recent inflows indicate that traditional market participants are tentatively re-engaging.
This shift is significant because platform fund demand has become a key support in the current cycle. Sustained net inflows could confirm growing institutional confidence and increased exposure.
Overall, the recovery remains early and modest, but the change in fund flows signals a positive structural shift compared to the recent persistent outflows.
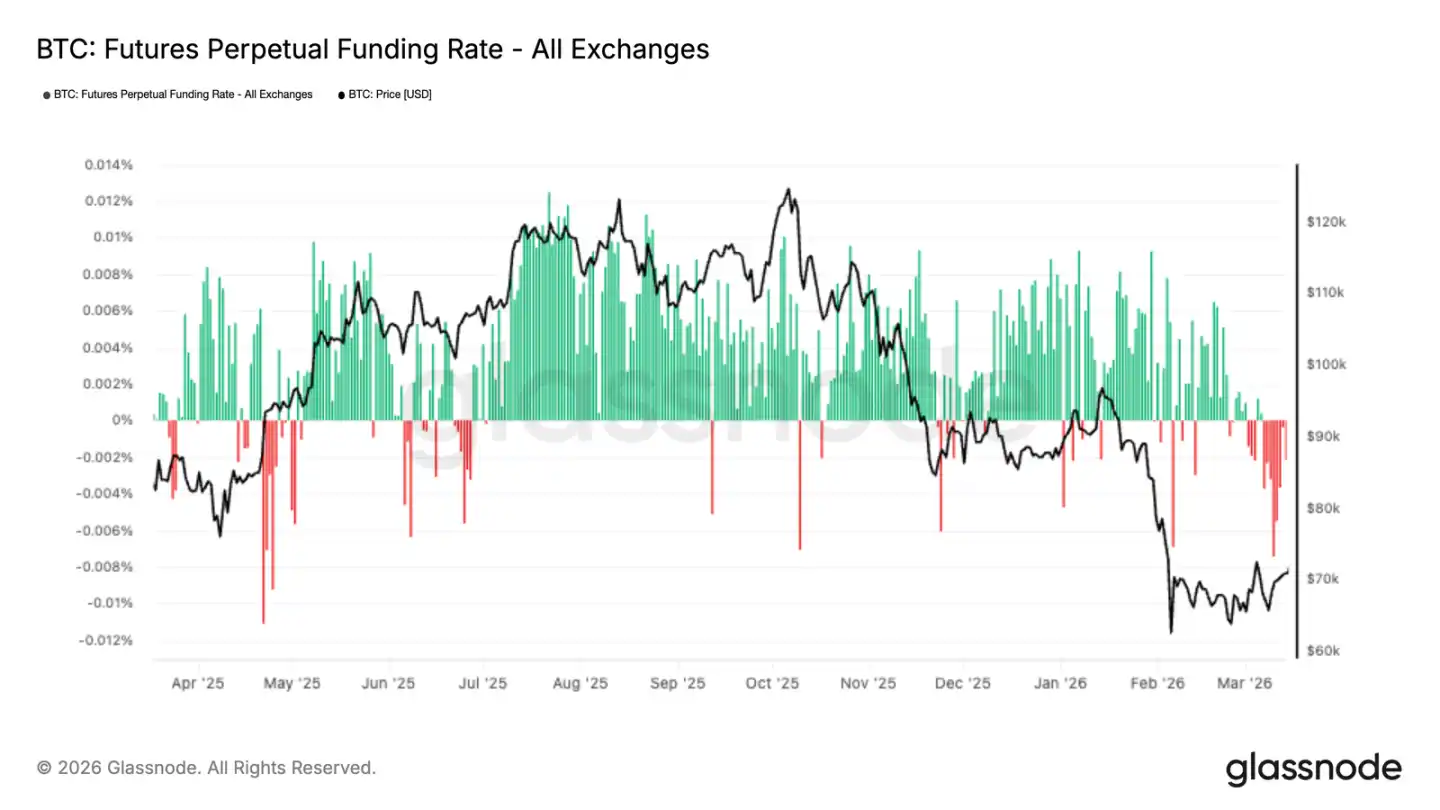
Persistent Negative Funding Rates
Despite Bitcoin’s stabilization and partial recovery from recent dips, perpetual contract funding rates remain in negative territory. This indicates that short positions still dominate, with traders willing to pay funding costs to maintain downside exposure.
Continued negative funding rates reflect cautious sentiment among derivatives market participants. Even as the price structure improves, traders show little enthusiasm for rebuilding long positions. This contrasts with previous recovery phases where funding rates normalized or turned positive as sentiment improved.
From a positioning perspective, sustained negative rates could act as a bullish driver if they persist, signaling crowded short positions and potential for short squeezes. Conversely, they also highlight lingering market skepticism, especially among leveraged traders.
Overall, derivatives positioning remains defensive, with spot and platform fund flows showing some stabilization but overall risk appetite still leaning bearish.
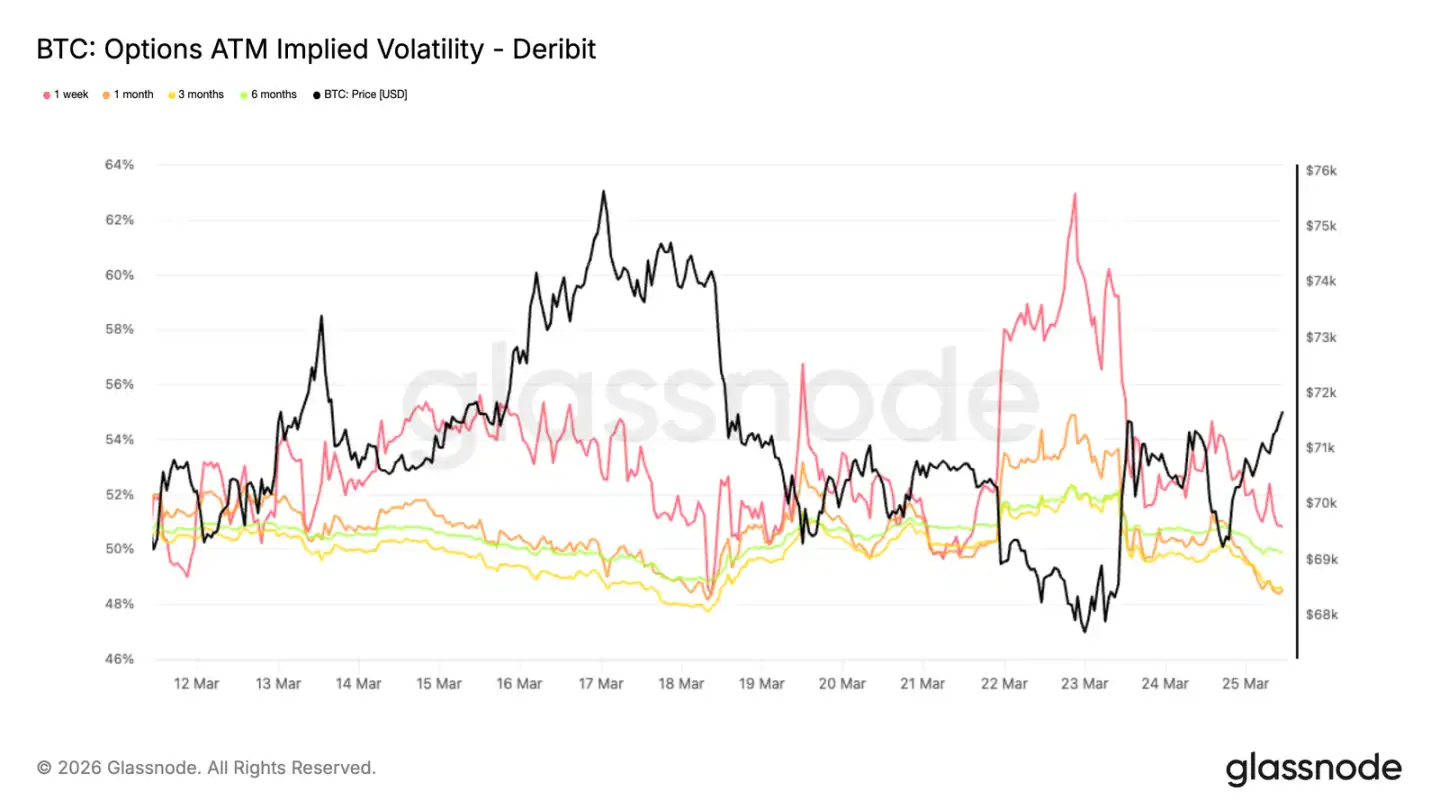
At-the-Money Implied Volatility: Rangebound, Awaiting Direction
In options markets, Bitcoin’s at-the-money implied volatility exhibits similar characteristics to spot, oscillating within a range and showing mean reversion tendencies. The front-end of the volatility curve reacts most strongly to macro events and short-term news.
One-week implied volatility is relatively volatile but remains within a narrow 50-60% range. Longer-dated implied volatility stays below 50%, with limited differences across maturities.
Overall, implied volatility remains subdued, indicating the market is waiting for new catalysts to reprice two-way risks. Long-term implied volatility levels are restrained, suggesting no structural change in long-term risk perception. Short-term volatility is mainly driven by near-month trading activity. In this environment, volatility tools are more used for short-term hedging than for expressing long-term directional views.
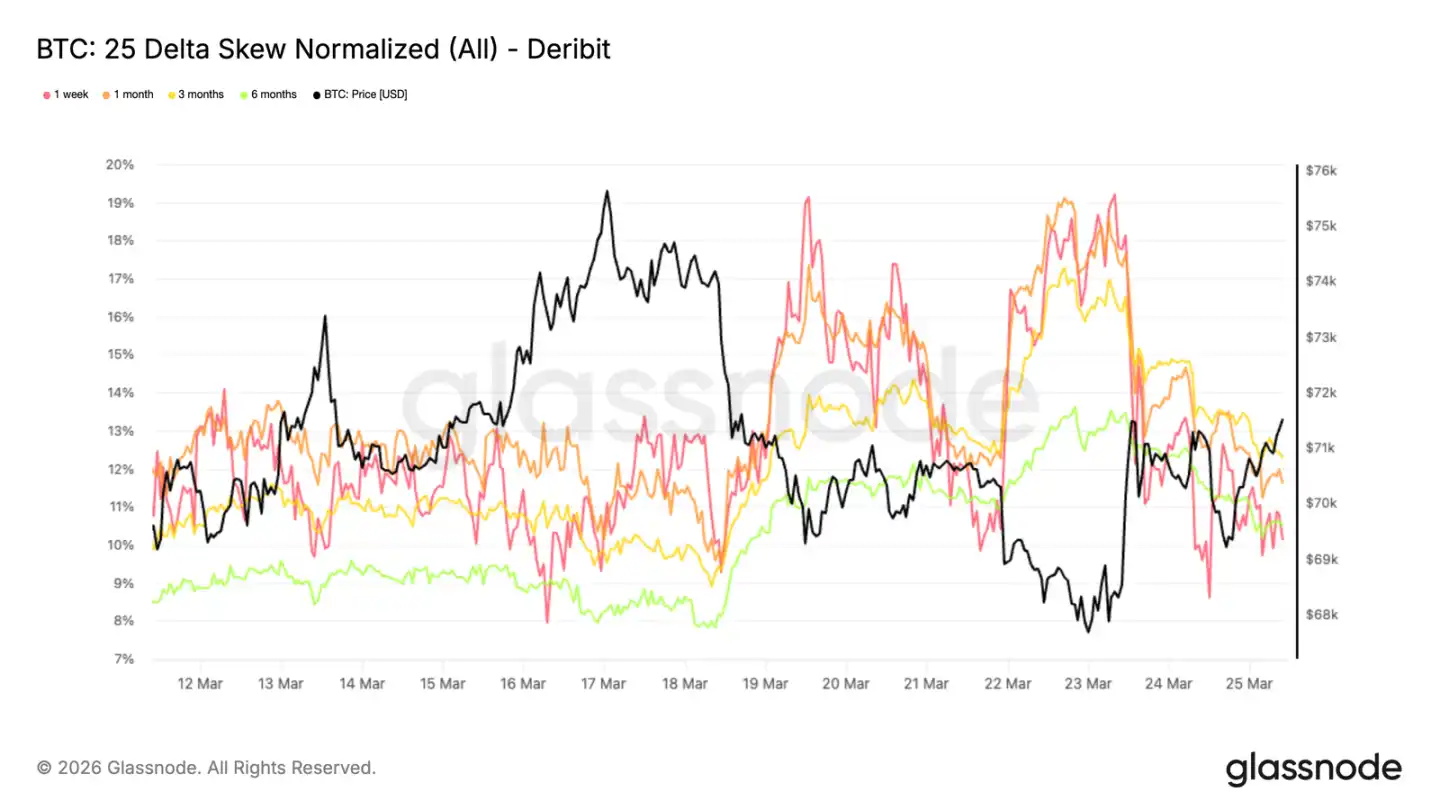
25 Delta Skew: Downside Protection Still Dominant
During a brief uptick in volatility this week, the skew indicator widened toward puts, confirming that the recent volatility revaluation was primarily driven by demand for downside protection.
The 25 delta skew (measuring the relative cost of at-the-money puts versus calls) spiked to 18-19% for 1-week and 1-month maturities when Bitcoin fell below $68,000. This clearly indicates that, amid rising geopolitical uncertainty, market demand for short-term downside hedges surges once prices weaken.
Subsequently, skew levels receded but remained relatively high, with maturities clustered around 10-12%. The convergence of skew across different maturities suggests that market participants prefer downside protection not only in near-term options but also across longer horizons, reflecting a persistent risk-averse stance.
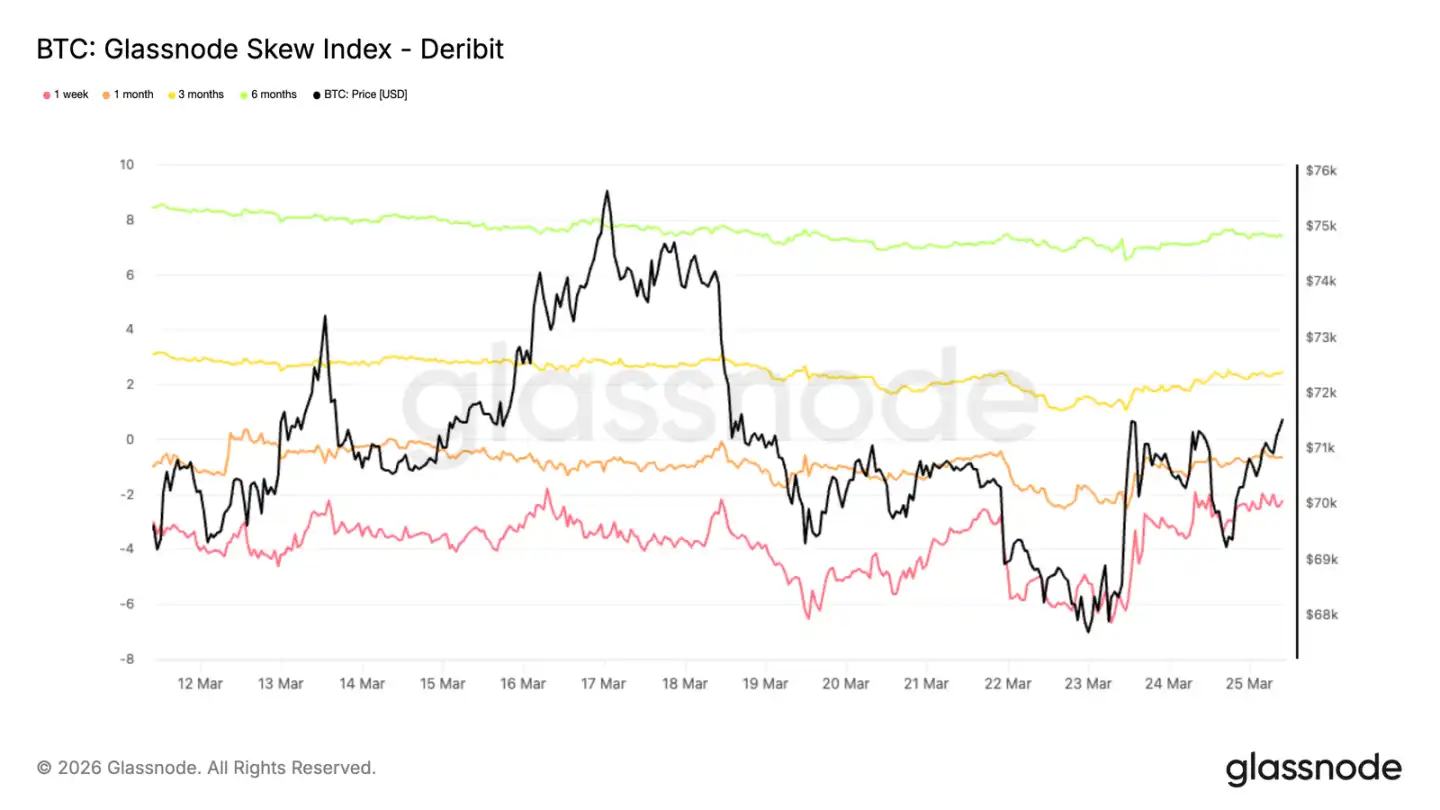
Skew Index Shows Different Sentiments
The skew index offers another perspective on options market sentiment. Unlike the 25 delta skew, this index weights low delta options more heavily, providing a fuller picture of tail risk pricing. Currently, the 1-week and 1-month skew index readings remain in the put-biased zone, while the 3- and 6-month readings (around 2.4% and 7.4%) have shifted toward call bias (calculated as calls minus puts).
This creates a clear divergence: while 25 delta skew indicates a bearish tilt across maturities, the skew index’s longer maturities suggest that the market is pricing higher upside tail risk in the longer term. Although short-term options remain skewed toward downside, the overall structure hints at a balanced or slightly optimistic long-term outlook, with market participants using deep out-of-the-money calls to capture asymmetric upside potential.
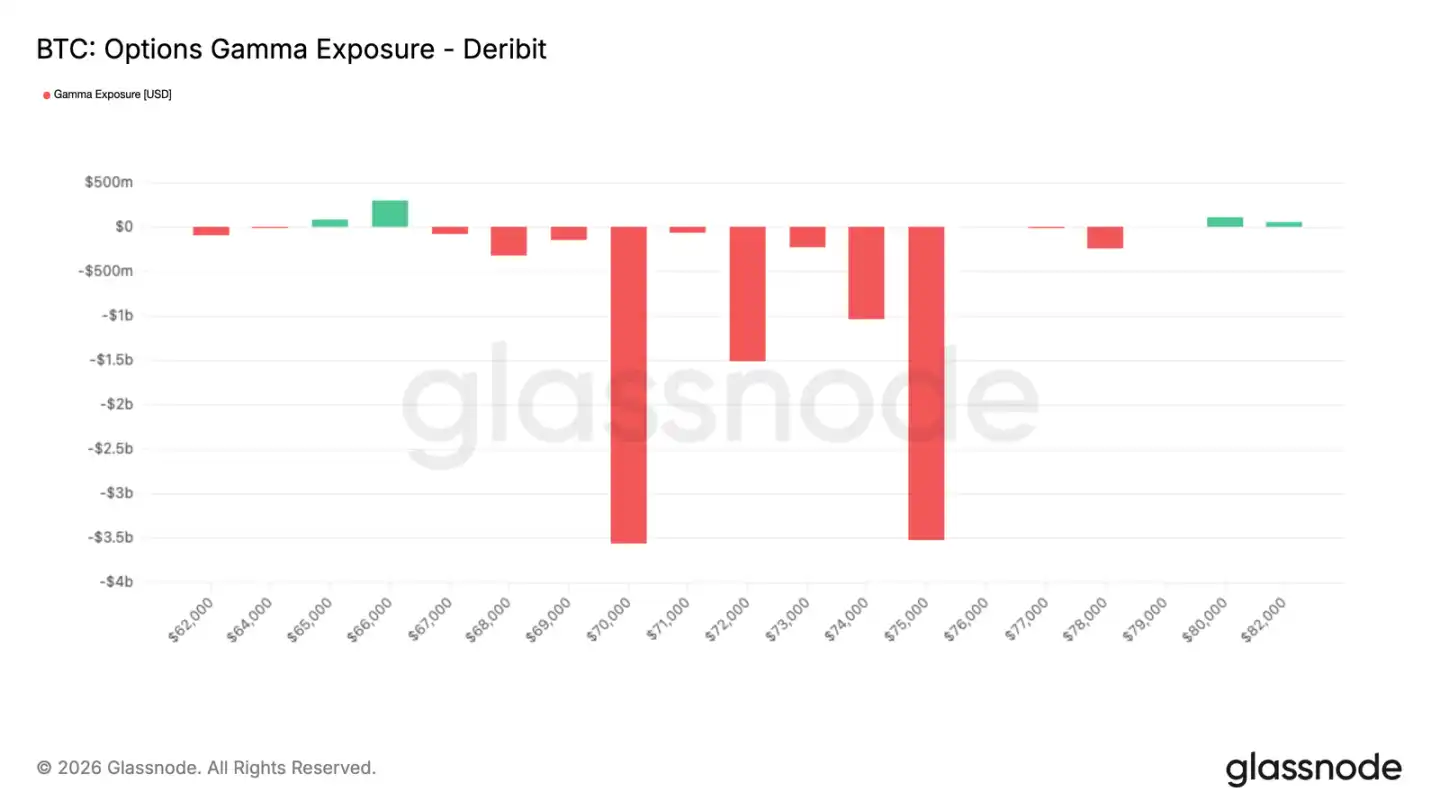
Market Maker Gamma: Expiry Will Reset Market Structure
Friday, March 27, marks the expiration of weekly, monthly, and quarterly options, often causing significant price impacts. As options market size continues to grow, market maker hedging behavior increasingly influences short-term price movements. Currently, with less than 48 hours to expiry, market makers hold a net short gamma position, with risk concentrated between $70,000 and $75,000. In this zone, especially in less liquid conditions, prices could experience accelerated two-way volatility.
Notably, the scale of expiring positions is substantial. About $10 billion in market maker short gamma positions are about to settle, removing a key mechanical driver of price. Once these positions are closed, the market’s hedge-driven price responsiveness should diminish, making it more sensitive to external factors. In this context, macroeconomic developments could become the primary influence on Bitcoin’s next equilibrium.
Conclusion
After a sharp correction, Bitcoin shows some positive signs: prices are stabilizing, platform fund flows are improving, and derivatives positioning is no longer one-sided. The recent selling pressure appears to be easing, and the market is becoming more balanced compared to a week ago.
However, the environment is not yet conducive to a confident breakout. Spot volume remains low, open interest has not expanded significantly, and overhead supply persists. Overall, the market structure is healing, but a sustained upward trend requires stronger participation confirmation.
Currently, the market exhibits constructive features but has not yet shifted decisively bullish. Continued demand recovery could create opportunities, but confirmation of a genuine rebound depends on a significant increase in spot trading volume and ongoing capital inflows.
Original Link
Click to learn more about Rhythm BlockBeats job openings
Join the Rhythm BlockBeats official community:
Telegram Subscribe: https://t.me/theblockbeats
Telegram Group: https://t.me/BlockBeats_App
Twitter Official: https://twitter.com/BlockBeatsAsia
