
Market technician Patrick Karim shared a striking long-term chart this week with a simple message:
“Crude Oil. Whatever happens on the Monday open is irrelevant on the longer-term roadmaps. The pathway for higher prices for crude oil has been laid out by silver & gold.”
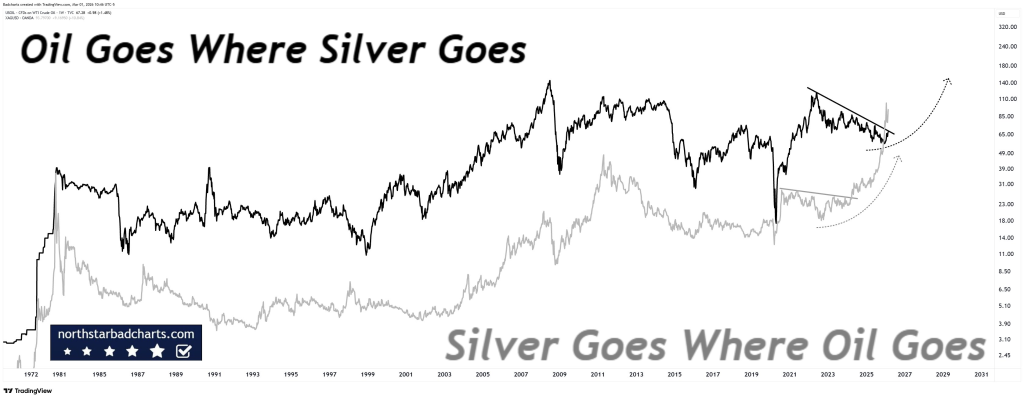
The chart compares decades of price action between crude oil and silver. One line tracks oil. The other tracks silver. The message is visual and blunt: major structural moves in silver tend to precede or align with large directional changes in oil.
This is about multi-year structure.
What the Long-Term Chart Is Showing
The chart stretches back to the 1970s. Across multiple cycles (inflation spikes, recessions, commodity booms, and crashes) oil and silver move in broad alignment during major macro phases.
When precious metals enter structural uptrends, oil often follows.
Right now, silver has already broken into a powerful bull phase. After consolidating for years, it exploded higher, printed new highs, corrected sharply, and is now rebuilding structure near key resistance. The longer-term pattern shows higher highs and higher lows across the macro timeframe.
Oil, by contrast, has been compressing.
Source: X/@badcharts1
On Karim’s chart, crude appears to be forming a large multi-year consolidation with a descending trendline capping recent rallies. Price has pulled back from prior highs but has not broken down structurally. It looks coiled.
There’s also a curved projection sketched on the right side of the chart. That projection mirrors silver’s prior breakout path and implies that oil could follow a similar expansion phase once resistance gives way.
The implication is clear: metals have already signaled the inflationary pressure. Oil may simply be lagging.
Read also: ChatGPT Predicts the Price of Silver and Gold If the U.S.–Iran War Escalates Further
Why Silver and Gold Could Be Leading
Precious metals tend to respond first to monetary instability, currency debasement fears, and geopolitical stress. They move when capital seeks protection.
Energy often reacts later, when inflation pressure feeds directly into supply chains and real-economy pricing.
Silver’s breakout above long-standing resistance indicates that liquidity conditions and inflation expectations are shifting. Gold has also remained structurally strong despite volatility in equities and crypto.
If metals are in the early phase of a broader commodity cycle, oil would not stay suppressed for long.
Karim’s point about the Monday open being irrelevant speaks to this idea. Short-term gaps driven by headlines do not change multi-year trend structure. Weekly and monthly charts define the real roadmap.
As long as crude oil holds its long-term support zones and continues compressing beneath that descending resistance, the setup resembles a classic coil before expansion.
A decisive breakout above that multi-year trendline would likely trigger momentum flows and repositioning across commodity markets.
If silver continues higher, Karim’s thesis indicates oil will not remain behind for long.
Read also: Strait of Hormuz Freeze: Oil Tankers Turn Back as War Risk Insurance Vanishes Overnight
Disclaimer: The information on this page may come from third parties and does not represent the views or opinions of Gate. The content displayed on this page is for reference only and does not constitute any financial, investment, or legal advice. Gate does not guarantee the accuracy or completeness of the information and shall not be liable for any losses arising from the use of this information. Virtual asset investments carry high risks and are subject to significant price volatility. You may lose all of your invested principal. Please fully understand the relevant risks and make prudent decisions based on your own financial situation and risk tolerance. For details, please refer to
Disclaimer.
Related Articles
Bitcoin Gets Its Own ‘Fear Gauge’ as Cboe Announces BITVX Index
Cboe Global Markets is bringing Wall Street’s favorite volatility playbook to bitcoin, announcing plans to launch a new index designed to track the market’s expected price swings using options tied to the popular Ishares Bitcoin Trust ETF.
BITVX: Cboe Applies VIX Methodology to Bitcoin ETF
Coinpedia19m ago
Strategy’s Michael Saylor Reveals $1.28B Bitcoin Purchase, Holdings Reach 738,731 BTC
Michael Saylor, executive chairman of Strategy, posted a brief but blunt update that stopped scrolling feeds: “Strategy has acquired 17,994 BTC for ~$1.28 billion at ~$70,946 per Bitcoin. As of 3/8/2026, we hodl 738,731 $BTC acquired for ~$56.04 billion at ~$75,862 per Bitcoin.” The numbers speak fo
BlockChainReporter30m ago
ETH 15-minute increase of 1.96%: On-chain large fund inflows and technical breakthroughs jointly amplify the rally
2026-03-09 19:15 to 19:30 (UTC), ETH achieved a short-term return of 1.96%, with the price range between 2010.14 and 2050.5 USDT, and an amplitude of 2.01%. Trading volume during this period significantly increased, market attention rapidly grew, and price fluctuations drew high investor interest.
The main driver of this movement was multiple large transfers of over 10,000 ETH on the blockchain, primarily flowing to a major exchange, indicating institutional or large investor accumulation, with positive capital inflows. At 19:15, ETH suddenly
GateNews2h ago
BTC 15-minute increase of 1.42%: On-chain capital inflow and technical breakout points resonate to trigger buying interest
From 19:15 to 19:30 on March 9, 2026 (UTC), the BTC price experienced a 15-minute return of +1.42%, with trading ranges between 68,377.3 and 69,365.3 USDT, and a volatility of 1.44%. This fluctuation far exceeds the regular intraday volatility levels, with market attention significantly heightened, and short-term buying surges intensifying the volatility.
The main driver of this movement was net inflow of on-chain funds, triggered by large transfers from major holder accounts, along with buy orders breaking through key technical resistance levels.
GateNews2h ago
Dogecoin Tests $0.090 Support After 3.4% Drop as Traders Watch Key Price Range
Dogecoin is currently trading at $0.09061 which is a drop of 3.4 percent, and the price is close to the important level of $0.09011 support.
The chart indicates a series of tests of the support zone of $0.089-$0.090, and the closest resistance is represented by $0.09353.
A hold of
CryptoNewsLand2h ago
Cardano Sees 1.7B ADA Traded as Price Tests Key Support
Key Insights
Cardano recorded more than 1.7 billion ADA in trading volume within 24 hours as market sentiment weakened and traders reacted cautiously.
On-chain data shows roughly 230 million ADA sold during the past week, which intensified selling pressure and pushed prices lower.
Cardano
CryptoFrontNews2h ago