
Altcoins have been stuck in the shadow of Bitcoin for years. Since the 2021 cycle peak, altcoin dominance has been in a steady downtrend.
Every rally attempt failed. Every breakout faded. Capital kept flowing back into BTC. For many investors, it has felt like a long grind with no real relief.
But now, one chart is starting to look very different.
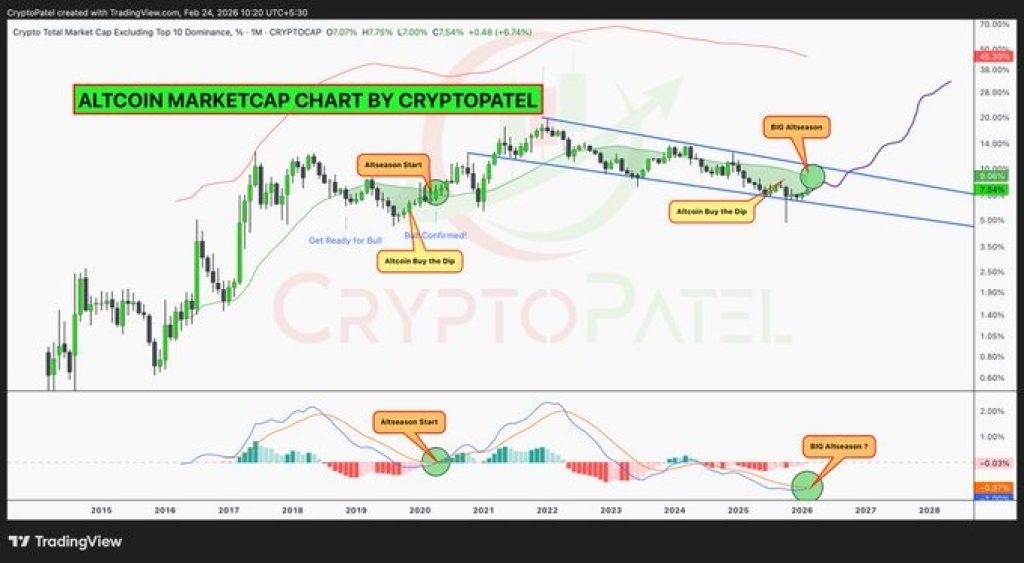
Crypto Patel shared a long-term altcoin dominance chart that shows a five-year descending trendline nearing a break.
More importantly, the MACD on the higher timeframe is about to print a bullish cross, the same type of signal that appeared before the 2020–2021 altcoin explosion.
Looking at the chart, altcoin dominance has respected a falling resistance line since the previous cycle high. Every time dominance pushed into that trendline, sellers stepped in.
Now price is pressing against it again. The structure shows repeated higher lows forming near support while resistance has remained flat.
That compression matters. When a market spends years building pressure under a descending line, the eventual break can be aggressive.
The chart even highlights previous “altseason start” zones in 2017 and 2020. Both were preceded by similar compression phases.
Source: X/CryptoPatel
However, below the chart, the MACD indicator is turning higher.
In both 2017 and 2020, a bullish MACD cross on the higher timeframe aligned with altcoin dominance breaking upward. What followed were massive expansions across the alt market, with many coins posting 10x to 20x moves.
Right now, the MACD is curling up again.
Volatility has been contracting for months. Dominance is sitting near a key inflection point. Liquidity appears to be building above current levels. This type of setup does not guarantee an explosion, but historically, this is how they begin.
_****Pi Network Posts Record Growth Metrics, So Why Does the Pi Coin Chart Look Dead?**
However, Altcoin dominance represents how much of the total crypto market cap is allocated outside of Bitcoin. When dominance rises, it means capital is rotating into altcoins.
For years, Bitcoin has controlled the narrative. But if dominance breaks this five-year trendline, it would signal a shift in market structure.
That shift is what traders call “altseason.”
It does not happen overnight. It starts quietly, often when sentiment is still skeptical.
Early or Late?
The chart does not promise 20x moves. Markets do not repeat perfectly.
But the technical structure looks similar to previous cycle turning points. A multi-year downtrend is being tested. Momentum is turning. Compression is extreme.
If dominance breaks and holds above resistance, the rotation into altcoins could accelerate quickly. After five years of underperformance, altcoins are back at a decision point.
Whether this becomes the next explosive phase or another fakeout depends on one thing: can dominance finally close above that long-standing resistance?
If it does, the market structure changes.
Disclaimer: The information on this page may come from third parties and does not represent the views or opinions of Gate. The content displayed on this page is for reference only and does not constitute any financial, investment, or legal advice. Gate does not guarantee the accuracy or completeness of the information and shall not be liable for any losses arising from the use of this information. Virtual asset investments carry high risks and are subject to significant price volatility. You may lose all of your invested principal. Please fully understand the relevant risks and make prudent decisions based on your own financial situation and risk tolerance. For details, please refer to
Disclaimer.
Related Articles
鏈上熱到爆、以太幣卻漲不動?專家揭「致命死穴」:恐下探 1,500 美元
CryptoQuant 報告指出,以太坊面臨「採用悖論」,雖然網路活躍度創新高,但幣價卻下滑。若熊市持續,到第三季末以太幣可能跌至 1,500 美元。智能合約活躍度上升與以太幣價格脫鉤,交易所流入量更能反映價格動態。投資需求疲軟,資金持續流失是主要隱憂。
区块客1m ago
Dogecoin (DOGE) phát tín hiệu khởi sắc khi dòng tiền nhà đầu tư cá nhân quay lại
Dogecoin (DOGE) is experiencing a recovery, currently up over 2% and nearing the psychological $0.1000 mark. Increased speculative activity is attracting traders to the derivatives market, and technical indicators suggest a cautious positive outlook for DOGE.
TapChiBitcoin11m ago
DePIN and AI Lead the Charge – Analyzing the Top Weekly Crypto Gainers
The cryptocurrency market serves as an indicator for new technological trends, and weekly data for the cryptocurrency market collected by CoinMarketCap show that investor sentiment has recently changed a lot. The market remains directionless overall, yet an exclusive set of projects, particularly in
BlockChainReporter11m ago
Liệu RAVE có sẵn sàng tăng 30% sau khi lấy lại được mức hỗ trợ này?
RaveDAO (RAVE) hiện đang giao dịch ở mức $0,2475 sau khi ghi nhận mức tăng ấn tượng 16,45%. Đáng chú ý, sự gia tăng mạnh mẽ trong hoạt động thị trường đã được ghi nhận, với khối lượng giao dịch tăng vọt 125%, đạt $88,15 triệu. Điều này phản ánh sự quan tâm lớn từ các nhà đầu tư và nhà giao dịch đối
TapChiBitcoin1h ago
+112 Billion Shiba Inu (SHIB) in 24 Hours Returns Notorious 80 Trillion Threshold - U.Today
Shiba Inu finally recovering
Shiba Inu are ready to sell
More than 112 billion SHIB tokens were transferred to exchanges in the past day, bringing total exchange reserves back above the 80 trillion SHIB threshold, indicating a discernible change in Shiba Inu's on-chain dynamics.
Shiba Inu final
UToday1h ago
Solana Tests $90 Resistance as Fibonacci Confluence Signals Key Turning Point
Key Insights
Solana price is nearing a major resistance near $90 where Fibonacci retracement and value area levels align, creating a decisive technical barrier.
Market structure shows the rally forming part of an ABC corrective pattern, keeping the broader consolidation intact while price tr
CryptoFrontNews1h ago