 Trusted Editorial content, reviewed by leading industry experts and seasoned editors. Ad Disclosure
Bitcoin is struggling to hold the $65,000 level as market sentiment drifts toward apathy following weeks of muted price action and declining participation. Volatility has compressed noticeably, and traders appear hesitant to commit fresh capital while macro uncertainty and liquidity constraints continue to weigh on risk assets. The lack of decisive momentum has left Bitcoin consolidating near a technically sensitive zone, where both bulls and bears seem reluctant to take aggressive positions.
Trusted Editorial content, reviewed by leading industry experts and seasoned editors. Ad Disclosure
Bitcoin is struggling to hold the $65,000 level as market sentiment drifts toward apathy following weeks of muted price action and declining participation. Volatility has compressed noticeably, and traders appear hesitant to commit fresh capital while macro uncertainty and liquidity constraints continue to weigh on risk assets. The lack of decisive momentum has left Bitcoin consolidating near a technically sensitive zone, where both bulls and bears seem reluctant to take aggressive positions.
Related Reading: Every Ethereum Whale Cohort Now Underwater: ETH Capitulation Marking The Final Bottom?A recent CryptoQuant report provides additional context through on-chain positioning data. According to the analysis, during the early February correction, the indicator dropped to roughly -0.0016, reflecting measurable weakness in underlying network activity. This development occurred after Bitcoin had already closed below the Anchored Volume Weighted Average Price (AVWAP) tied to the most recent halving on the weekly timeframe — a level often monitored as a structural reference for market positioning.
Trading below this anchored metric suggests reduced conviction among market participants and potentially weaker cost-basis support. While such conditions do not necessarily imply imminent downside, they typically correspond with transitional phases marked by uncertainty, subdued participation, and cautious capital deployment as the market searches for directional clarity.
Bearish Confluence Signals Echo Prior Cycle Dynamics
The report highlights that the last comparable bearish confluence following an all-time high occurred in May 2022, a period that ultimately preceded a prolonged corrective phase. According to the analysis, this comparison is based on a combination of structural indicators rather than isolated price action, specifically the BTC Growth Rate Difference between Market Cap and Realized Cap — an indicator developed by CryptoQuant CEO Ki Young Ju — alongside Anchored VWAP levels tied to the third and fourth Bitcoin halvings.
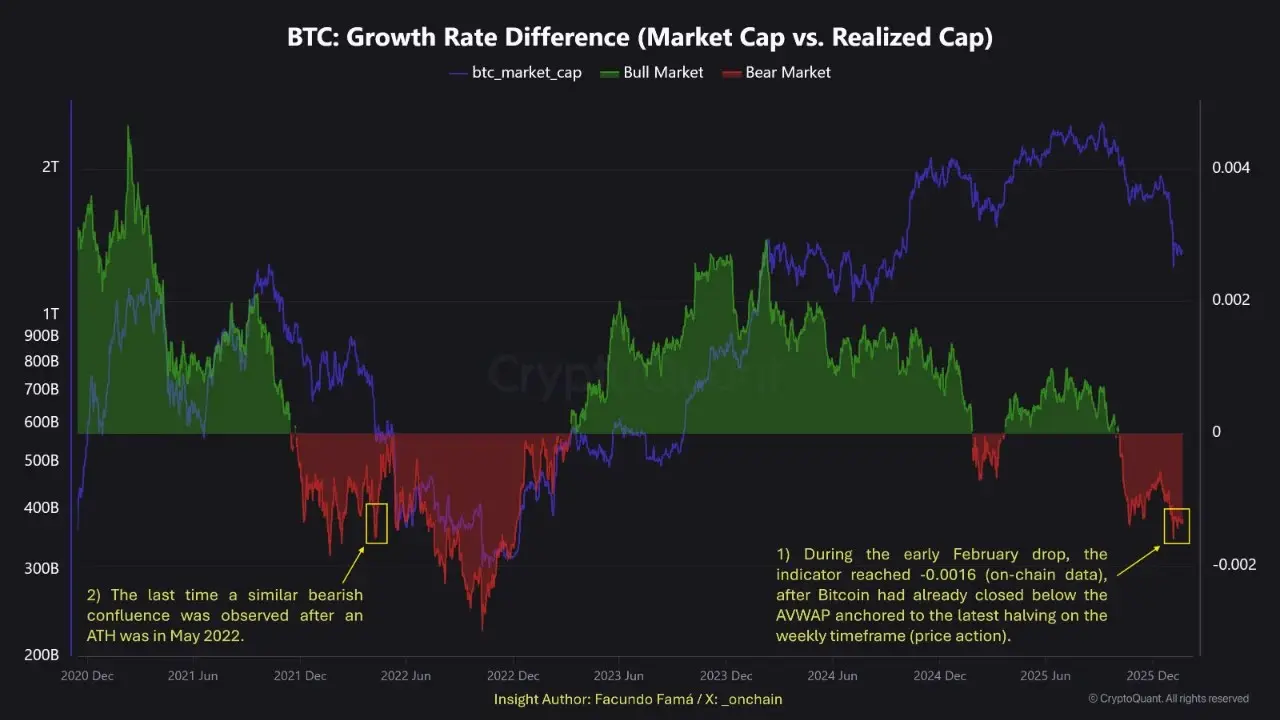 Bitcoin Growth Rate Difference | Source: CryptoQuantThe Growth Rate Difference metric evaluates whether market capitalization expansion is outpacing the underlying realized capitalization, which reflects the aggregated cost basis of coins on-chain. When this gap narrows or turns negative, it often signals weakening speculative momentum and reduced capital inflows relative to existing holder positioning.
At the same time, Bitcoin trading below key halving-anchored AVWAP levels suggests diminished structural support from long-term cost bases. Historically, these levels have functioned as reference zones for institutional and macro-oriented investors.
Together, these indicators do not guarantee further downside, but they do indicate a fragile market structure. Such conditions typically require either renewed liquidity inflows or sustained accumulation before a convincing recovery phase can develop.
Related Reading: Crypto’s Capitol Hill Crisis: How The ‘Shadow Deposit’ War Held The CLARITY Act Hostage
Bitcoin Price Tests Key Support As Downtrend Persists
Bitcoin’s weekly structure continues to reflect a corrective phase, with price struggling to stabilize near the mid-$60,000 range after a sharp rejection from the $110,000–$120,000 zone seen late last year. The chart shows a clear transition from bullish expansion to distribution, followed by a sustained sequence of lower highs and lower lows — a pattern typically associated with weakening momentum rather than consolidation.
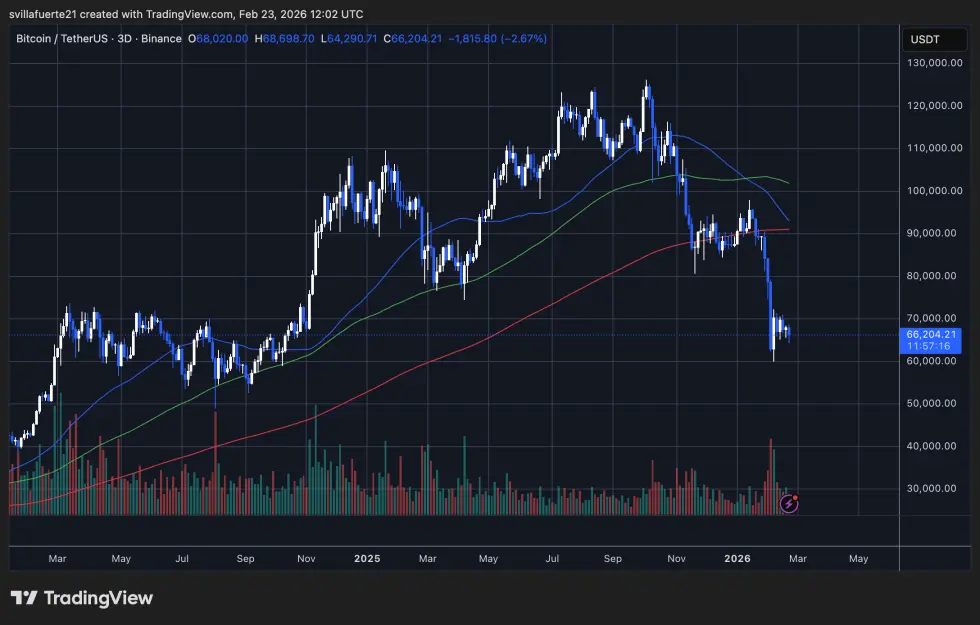 BTC testing critical demand level | Source: BTCUSDT chart on TradingView
Technically, Bitcoin is now trading below major moving averages that previously acted as dynamic support. The shorter-term average has already rolled over decisively, while the longer-term trend line remains upward sloping but increasingly distant from current price action. Sustained trading beneath these levels usually reflects cautious sentiment and reduced upside conviction.
BTC testing critical demand level | Source: BTCUSDT chart on TradingView
Technically, Bitcoin is now trading below major moving averages that previously acted as dynamic support. The shorter-term average has already rolled over decisively, while the longer-term trend line remains upward sloping but increasingly distant from current price action. Sustained trading beneath these levels usually reflects cautious sentiment and reduced upside conviction.
Related Reading: Wall Street’s Bitcoin Exit Door: How Institutional Depth Allowed LTH To Distribute Record Supply
Volume spikes during recent selloffs suggest active distribution rather than passive drift lower. However, declining participation afterward could indicate partial exhaustion of aggressive sellers, potentially opening the door for a stabilization phase if demand returns.
From a structural perspective, the $60,000–$62,000 zone appears to function as immediate support, while the $70,000–$75,000 range represents the first meaningful resistance band. Unless Bitcoin decisively reclaims higher levels with strong volume, the broader trend remains fragile, with consolidation or additional downside risk still plausible.
Featured image from ChatGPT, chart from TradingView.com
![]() Editorial Process for bitcoinist is centered on delivering thoroughly researched, accurate, and unbiased content. We uphold strict sourcing standards, and each page undergoes diligent review by our team of top technology experts and seasoned editors. This process ensures the integrity, relevance, and value of our content for our readers.
Editorial Process for bitcoinist is centered on delivering thoroughly researched, accurate, and unbiased content. We uphold strict sourcing standards, and each page undergoes diligent review by our team of top technology experts and seasoned editors. This process ensures the integrity, relevance, and value of our content for our readers.
Disclaimer: The information on this page may come from third parties and does not represent the views or opinions of Gate. The content displayed on this page is for reference only and does not constitute any financial, investment, or legal advice. Gate does not guarantee the accuracy or completeness of the information and shall not be liable for any losses arising from the use of this information. Virtual asset investments carry high risks and are subject to significant price volatility. You may lose all of your invested principal. Please fully understand the relevant risks and make prudent decisions based on your own financial situation and risk tolerance. For details, please refer to
Disclaimer.