The S&P 500 climbed to 6,976 points before retreating, while Bitcoin fell below $65,000, hitting a new low for the year, as capital shifted from cryptocurrencies into U.S. equities. AI stocks and small-cap stocks drove the index higher, with Alphabet reaching a new high. The Russell 2000 increased by 3%, indicating strong momentum among small caps. Earnings growth is expected to be 11%, with 80% of companies beating earnings estimates.
AI Stocks and Small Caps Double as Drivers for the S&P’s Record High
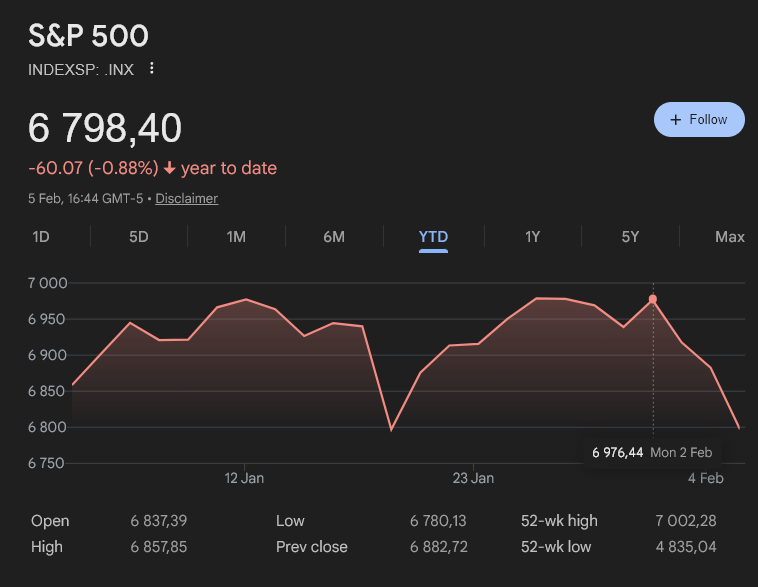
(Source: Google Finance)
The latest rally in the S&P 500 was primarily led by large technology and semiconductor stocks. Previously, investors paused briefly on AI-related stocks due to valuation concerns, but then resumed buying them. Alphabet hit a new high, Amazon’s stock rose ahead of earnings reports, and chip manufacturers generally gained, driven by expectations of stronger demand. This recovery in AI stocks shows that despite short-term valuation worries, market confidence in AI’s long-term prospects remains firm.
Beneath the surface, market breadth has also improved. Small caps outperformed the broader market, with the Russell 2000 up about 3% so far this year. This relative strength is often interpreted as a sign of confidence in domestic economic growth and supports broader market forecasts, which suggest that as long as earnings momentum continues, stocks will keep rising.
The strength of small caps is highly significant. During times of market uncertainty, investors tend to focus on large blue-chip stocks for safety, while small caps are sold off due to lower liquidity and higher risk. But when small caps begin outperforming, it signals that investors are willing to accept higher risk for higher returns—an unmistakable sign of improved risk appetite. The 3% gain in the Russell 2000, while modest, in the context of the S&P 500 reaching new highs, indicates that the rally is broadening beyond just a few tech giants.
Three Pillars Supporting the S&P 500’s Rise
AI Concept Stocks Rebound: Alphabet hits new highs, chip stocks remain strong, market regains confidence in AI
Small Caps Strengthen: Russell 2000 up 3%, improved market breadth signals increased risk appetite
Earnings Surpass Expectations: 80% of earnings reports beat estimates, with 11% growth supporting valuations
Today, earnings—not valuations—are the key driver behind this rally. Corporate performance remains the core engine of market gains. Analysts now expect companies in the S&P 500 to see nearly 11% earnings growth in the December quarter, a significant upward revision from January estimates. Market strategists citing FactSet data show that over 80% of companies have exceeded expectations so far.
Earnings-Driven 84% Return Ends Valuation Bubble Concerns
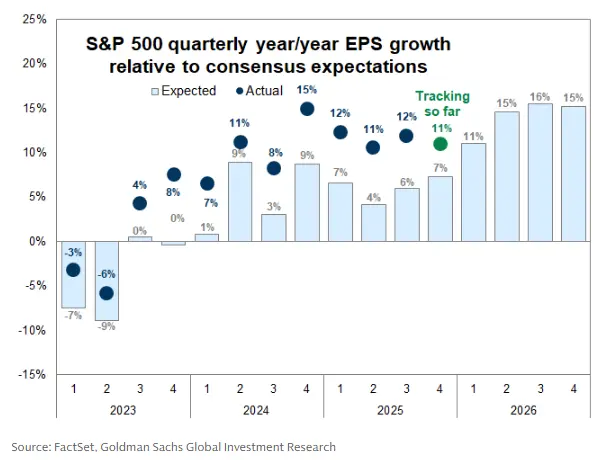
(Source: FactSet)
Recent studies indicate that earnings growth has accounted for approximately 84% of the total return of the S&P 500 during this cycle, signaling that P/E ratio expansion is no longer the main driver of stock price increases. This shift alleviates fears of an AI-driven bubble, as profits and cash flows increasingly support higher valuations.
This 84% figure is extremely significant. In past bull markets, especially during 2020-2021, stock price increases heavily depended on valuation expansion (higher P/E multiples), rather than actual earnings growth. This valuation-driven rally was very fragile; once investor sentiment shifted or interest rates rose, bubbles burst quickly. But when gains are primarily driven by earnings, the foundation is more solid—short-term corrections aside, as long as companies continue to grow profits, stock prices will eventually reach new highs.
The current situation with the S&P 500 exemplifies this. Although the index has hit new highs, the average P/E multiple has not increased and has even slightly declined. This indicates that stock prices are rising because companies are genuinely earning more, not because investors are willing to pay higher prices for the same earnings. This healthy growth structure makes the current highs less vulnerable than those in 2021.
The macroeconomic environment so far has supported the market’s risk tolerance. U.S. GDP growth remains around 3.3%, inflation trends are moderate, and productivity indicators have improved. Even with political turbulence, such as a federal government shutdown delaying key economic data releases, market confidence has not been materially shaken. This macro resilience provides a solid foundation for the ongoing rally.
Major U.S. stock indices are moving in tandem with the S&P 500, with the Dow Jones Industrial Average up over 1% year-to-date. The Nasdaq, however, has declined about 2.6%. The Nasdaq’s decline is mainly due to a correction in some tech stocks, but it does not alter the overall upward trend of the S&P 500. Investors are now awaiting upcoming economic data and Federal Reserve signals to confirm that the financial environment will continue to support the rally.
Logic Behind Capital Flows: Bitcoin Falling Below $65,000
Despite the rise in the S&P 500, the cryptocurrency market has moved in the opposite direction. Bitcoin dropped below $65,000, reaching a nearly one-year low, continuing the previous downward trend that has weighed on digital assets. The decline is driven by weakening market momentum, reduced speculative interest, and capital shifting toward stocks with clear profit growth.
This divergence highlights a clear difference in risk appetite: investors prefer trades with visible profits over liquidity-driven trades. As a non-yielding asset, Bitcoin’s value depends entirely on market consensus and liquidity conditions. When liquidity is abundant and interest rates are very low, investors are willing to hold assets that do not generate cash flow. But in the current environment, companies are generating 11% profit growth, and government bonds offer 4-5% risk-free returns, reducing Bitcoin’s relative appeal.
This stark contrast reflects an increasing divergence between traditional risk assets and cryptocurrencies—at least in the short term. While liquidity-driven rallies benefit both markets, the current environment favors assets directly linked to corporate profits. Capital is flowing from Bitcoin into stocks, not because investors suddenly distrust crypto, but because equities currently offer better risk-adjusted returns.
The S&P 500 reaching new highs increasingly relies on profit growth rather than valuation expansion. The strong performance of AI investments, small caps, and solid macroeconomic data continues to support the outlook, even as record highs serve as a reminder for investors to remain cautious. Bitcoin’s drop to a one-year low underscores the growing divergence in risk appetite, with investors favoring trades with higher profit visibility.
The S&P 500’s new highs are increasingly driven by actual earnings growth rather than valuation expansion. The robust performance of AI stocks, small caps, and resilient macroeconomic data continue to underpin the bullish outlook, even as record levels remind investors to stay cautious. Bitcoin’s decline to a one-year low highlights the widening split in risk appetite, with investors favoring assets with clearer profit prospects.
Disclaimer: The information on this page may come from third parties and does not represent the views or opinions of Gate. The content displayed on this page is for reference only and does not constitute any financial, investment, or legal advice. Gate does not guarantee the accuracy or completeness of the information and shall not be liable for any losses arising from the use of this information. Virtual asset investments carry high risks and are subject to significant price volatility. You may lose all of your invested principal. Please fully understand the relevant risks and make prudent decisions based on your own financial situation and risk tolerance. For details, please refer to
Disclaimer.