
Key Takeaways
-
Algorand (ALGO) is consolidating after a 13% decline over the past 60 days, while showing stabilization in the last month.
-
The daily chart reveals a repeating bullish fractal, similar to the setup that triggered ALGO’s 300% rally in November 2024.
-
Price is holding inside a long-term accumulation zone between $0.11 and $0.1530.
-
The 200-day moving average near $0.1912 is acting as key resistance and breakout confirmation level.
-
A successful reclaim of the 200 MA could open the path toward $0.60 and the ascending resistance trendline, while a drop below $0.11 would invalidate the bullish setup.
ALGO, the native token of Algorand’s Layer-1 blockchain, has shown steady but muted momentum over the past 30 days, helping slow down its broader correction. Despite this stabilization, ALGO remains down more than 13% over the last 60 days, keeping sentiment cautious across the market.
That said, when looking beyond short-term price noise, the daily chart is beginning to tell a familiar story. The current structure closely resembles a bullish fractal that, in the past, preceded a powerful breakout rally—raising an important question for traders: is this just consolidation, or a quiet accumulation phase before the next move?
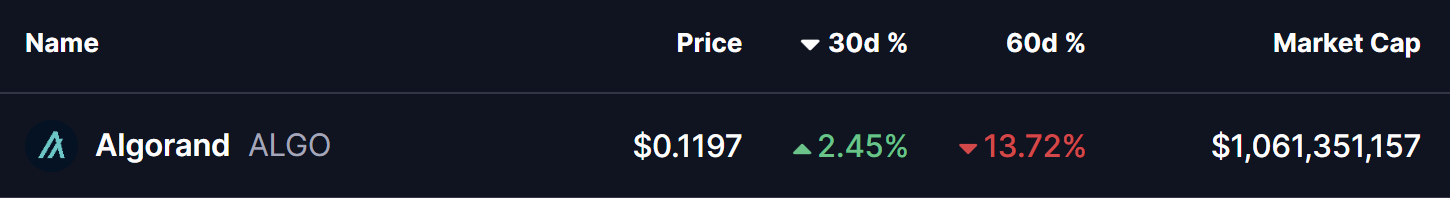
Source: Coinmarketcap
Fractal Setup Hints at a Bullish Reversal
On the daily timeframe, ALGO is displaying early signs of a repeating bullish structure, built around three key technical elements:
-
A rejection from the long-term ascending resistance trendline
-
A prolonged accumulation zone at major historical support
-
A potential reclaim of the 200-day moving average
The current corrective phase began in December 2024, when ALGO was rejected near the ascending resistance trendline around $0.60. That rejection triggered a deep pullback of more than 80%, eventually driving price back into the long-term demand zone between $0.11 and $0.1530—a region that has repeatedly acted as an accumulation area on the chart.
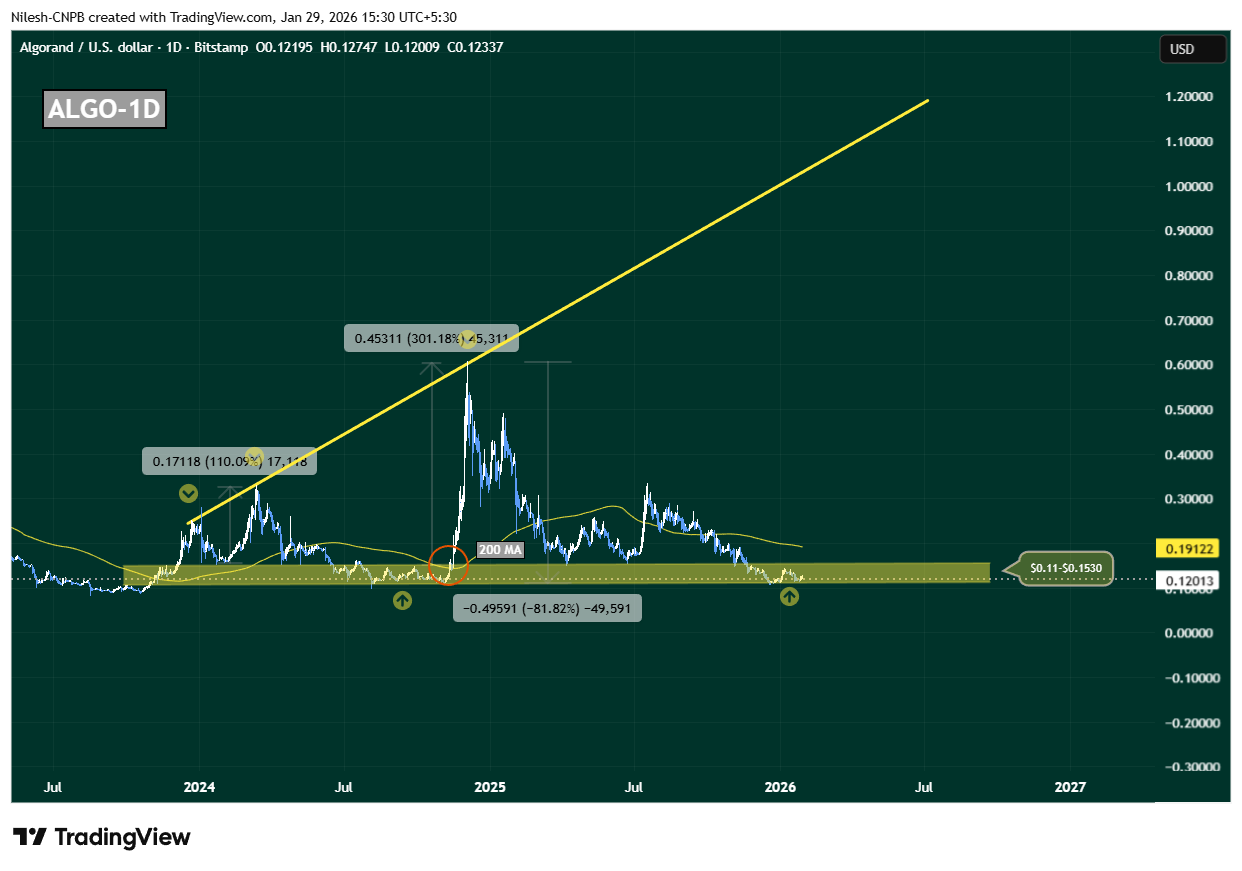
Algorand (ALGO) Daily Chart/Coinsprobe (Source: Tradingview)
This zone is not just technically important; it has also served as a launchpad during previous cycles, where downside momentum stalled and long-term buyers quietly stepped in.
History Rhymes on the ALGO Chart
What makes this setup particularly compelling is how closely it mirrors November 2024’s breakout structure. Back then, ALGO spent extended time consolidating near the same support band before reclaiming the 200-day moving average. Once that level flipped into support, price accelerated sharply—resulting in a 300% rally toward the ascending resistance trendline.
Today, ALGO is once again compressing inside this accumulation range, while the 200-day moving average sits overhead near $0.1912, acting as dynamic resistance. This alignment suggests the market may be approaching another inflection point.
What’s Next for ALGO?
At present, ALGO is hovering near $0.12, firmly inside its long-term accumulation zone. As long as price holds above this region, the broader bullish fractal remains intact.
A clean and sustained reclaim of the 200-day moving average around $0.1912 would be a critical confirmation signal. If bulls manage to flip this level into support, it would closely replicate previous breakout conditions and could trigger a sharp upside expansion. In that scenario, $0.60 becomes a realistic medium-term target, with further upside possible toward the ascending resistance trendline if momentum builds.
However, the structure is not without risk. A decisive breakdown below $0.11 would weaken the accumulation thesis, signal loss of long-term support, and open the door for deeper downside.
For now, ALGO sits at a make-or-break zone. The chart suggests patience is key—but if history repeats, this quiet phase may not last much longer.
Disclaimer: The views and analysis presented in this article are for informational purposes only and reflect the author’s perspective, not financial advice. Technical patterns and indicators discussed are subject to market volatility and may or may not yield the anticipated results. Investors are advised to exercise caution, conduct independent research, and make decisions aligned with their individual risk tolerance.
About Author: Nilesh Hembade is the Founder and Lead Author of Coinsprobe, with over 5 years of experience in the cryptocurrency and blockchain industry. Since launching Coinsprobe in 2023, he has been providing daily, research-driven insights through in-depth market analysis, on-chain data, and technical research.
Disclaimer: The information on this page may come from third parties and does not represent the views or opinions of Gate. The content displayed on this page is for reference only and does not constitute any financial, investment, or legal advice. Gate does not guarantee the accuracy or completeness of the information and shall not be liable for any losses arising from the use of this information. Virtual asset investments carry high risks and are subject to significant price volatility. You may lose all of your invested principal. Please fully understand the relevant risks and make prudent decisions based on your own financial situation and risk tolerance. For details, please refer to
Disclaimer.
Related Articles
Dogecoin Tests $0.090 Support After 3.4% Drop as Traders Watch Key Price Range
Dogecoin is currently trading at $0.09061 which is a drop of 3.4 percent, and the price is close to the important level of $0.09011 support.
The chart indicates a series of tests of the support zone of $0.089-$0.090, and the closest resistance is represented by $0.09353.
A hold of
CryptoNewsLand46m ago
PEPE Price at $0.053259 as Tight Range and Falling Volume Shape Short-Term Market Activity
PEPE was traded at $0.053259 and has recorded a 3.0 percent fall in value but it is within a thin band of support and resistance.
The market exhibited a volume of 235.15M in 24 hour trading, which is a decline of 19.16% reflecting less trading activity.
Technical indicators are not
CryptoNewsLand51m ago
XRP ETF Performance Praised as 'Really Impressive' by Bloomberg - U.Today
XRP ETFs have shown resilience amid a 45% price drop, attracting significant capital despite typical market behavior. Bloomberg's Eric Balchunas highlights strong investor support. Despite recent outflows, the funds retain substantial assets, indicating community dedication.
UToday1h ago
Crypto Shines Amid Middle East Oil Shock and Market Selloff
Bitcoin remains stable amid market turmoil fueled by rising oil prices and inflation, outperforming traditional assets. Its reduced leverage limits forced selling, attracting long-term investors eyeing potential gains in a volatile landscape.
CryptoFrontNews1h ago
XRP Holds $1.34 Support While Leverage Heatmap Highlights $1.30 Risk Zone
XRP is trading at $1.36 in a tight range of support at $1.34 and resistance at $1.37.
The heatmap data indicates that there is a huge amount of long positions in the range of $1.30.
Should prices fall to around $1.30, long positions with high leverage in this region might
CryptoNewsLand1h ago
ETH drops 1.07% in 15 minutes: whale fund concentration triggers short-term pullback
March 10, 2026, 18:00 to 18:15 (UTC), ETH's return within the 15-minute candlestick was -1.07%, with price fluctuations ranging from 2049.1 to 2073.15 USDT, an amplitude of 1.16%. During the same period, market trading volume significantly increased by over 32%, large on-chain fund flows occurred frequently, triggering short-term market sentiment fluctuations, rapidly increasing attention, and intensifying volatility risks.
The main driver of this abnormal movement is the concentrated sell-off by whale funds. On-chain data shows that within this time window, there were four large transfers exceeding 5000 ETH, all flowing to a major...
GateNews2h ago