
Looking at the weekly chart, the structure on LINK becomes pretty clear. What we are looking at is a classic head-and-shoulders pattern that has been forming since 2024.
The left shoulder took shape in the low to mid $20s, then LINK price pushed higher to form the head near the upper $20s, and after that, the right shoulder rolled over again around similar levels.
What really stands out here is the neckline. It is not flat, but slightly rising, and it comes in right around the $10 to $11 zone. That is why the LINK price is now sitting at such a sensitive level. This is not just another support. It is the level that decides whether this entire structure breaks down or not.
Why $10–$11 Is Critical For LINK, With Lower Levels Below
CryptoBullet’s main message is simple and hard to argue with. If the LINK price loses the $10–$11 support area on a weekly close, things can turn ugly quickly. On a chart like this, a weekly close matters far more than a random wick or a quick dip.
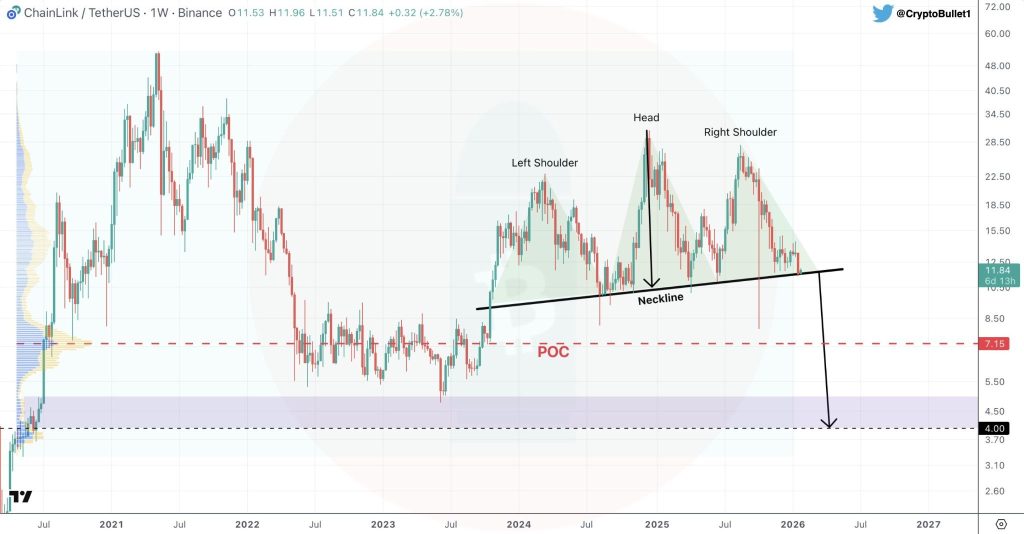
Source: X/@CryptoBullet1
Just below that, around $7.15, sits what he calls the conservative downside target. This level is not picked randomly. It lines up with the volume point of control and with the accumulation zone from 2022 and 2023. In other words, this is where LINK previously spent a lot of time trading, so if price starts sliding, that zone naturally becomes the next place the market looks toward.
If the head-and-shoulders plays out fully, the measured move points toward the $4–$5 area. That is the deeper target mentioned in the tweet, and it matches the lower demand zone visible on the chart.
Getting to that level would depend on a general softness in the crypto space, not necessarily on LINK being lagging on its own. Nonetheless, it does provide a roadmap as long as sellers are in charge.
What Needs To Happen To Avoid This Breakdown
For this bearish setup to lose its grip, the LINK price needs to hold the $10 to $11 area and start building higher lows from there. Even better would be a clean reclaim and move back above the right shoulder zone, which would start to invalidate the pattern entirely.
Until that happens, the chart is very straightforward. The LINK price is sitting right on the line that separates a messy consolidation from a full weekly breakdown, and the next few weekly closes will likely decide which side wins.
Why Chainlink’s CCIP Is Turning LINK Into a Financial Infrastructure Play_**
Disclaimer: The information on this page may come from third parties and does not represent the views or opinions of Gate. The content displayed on this page is for reference only and does not constitute any financial, investment, or legal advice. Gate does not guarantee the accuracy or completeness of the information and shall not be liable for any losses arising from the use of this information. Virtual asset investments carry high risks and are subject to significant price volatility. You may lose all of your invested principal. Please fully understand the relevant risks and make prudent decisions based on your own financial situation and risk tolerance. For details, please refer to
Disclaimer.
Related Articles
BNB Price Steady Above $633 as Bulls Face Strong Barriers
Key Insights:
BNB holds above the 50-day EMA near $633, supported by whale activity, while mixed derivatives data keep price action within a consolidation range.
Technical indicators, including RSI and MACD, show mild bullish momentum, though strong resistance levels near $662 and $680
CryptoNewsLand1m ago
Chainlink Price Tightens as $10 Resistance Holds Firm
Key Insights:
Chainlink trades between $8.5 and $10 as a tightening range signals volatility expansion, with buyers showing early strength through higher lows formation.
Open interest drops to $380 million while persistent spot outflows indicate cautious sentiment, though declining selling p
CryptoNewsLand52m ago
Solana Eyes $87 Breakout as Bullish Signals Strengthen
Solana sits near key resistance around $87 as on-chain activity and positive funding buoy bullish momentum; whale-led demand in derivatives supports a potential breakout. RSI >50 and positive MACD indicate rising upside, with a path toward $92–$97 and support near $77.
CryptoNewsLand56m ago
Dogecoin Holds Range as Volume Surge Signals Breakout Risk
Key Insights:
Dogecoin recorded over $800 million in daily transactions, reflecting one of its strongest activity spikes this year alongside rising accumulation from large holders.
Whale accumulation exceeded $330 million in one week, reinforcing demand strength while the price remains
CryptoNewsLand1h ago
Shiba Inu Price Compression Signals Imminent Breakout Phase
Key Insights:
Shiba Inu trades near $0.0000060 as tightening volatility and reduced momentum signal an approaching breakout phase after months of sustained decline.
Open interest declines to $68 million, while persistent spot outflows highlight cautious sentiment and limited conviction
CryptoNewsLand2h ago