US November PPI data exceeds expectations, leading to a decline in US stocks. However, Bitcoin has shown an independent upward trend, reaching a high of $97,924 in the past 24 hours, breaking through the 99-day moving average. What is the reason?
High US PPI index causes US stocks to fall, but Bitcoin surges
Last night, the US released the Producer Price Index (PPI) for November, with a month-over-month increase of 0.2%, higher than the market expectation of 0.1%, and an annual increase of 3.0%.
The market was still optimistic the day before about December CPI data meeting expectations, but after the PPI data was released, concerns about future rate cuts resurfaced.
The three major US indices closed lower, including the S&P which fell 0.53%, marking the first consecutive two-day decline since 2026. The Nasdaq also dropped 1%. However, Bitcoin ($BTC) has shown an independent rally, reaching a high of $97,924 in the past 24 hours, breaking through the 99-day moving average, and currently pulling back to $96,552.
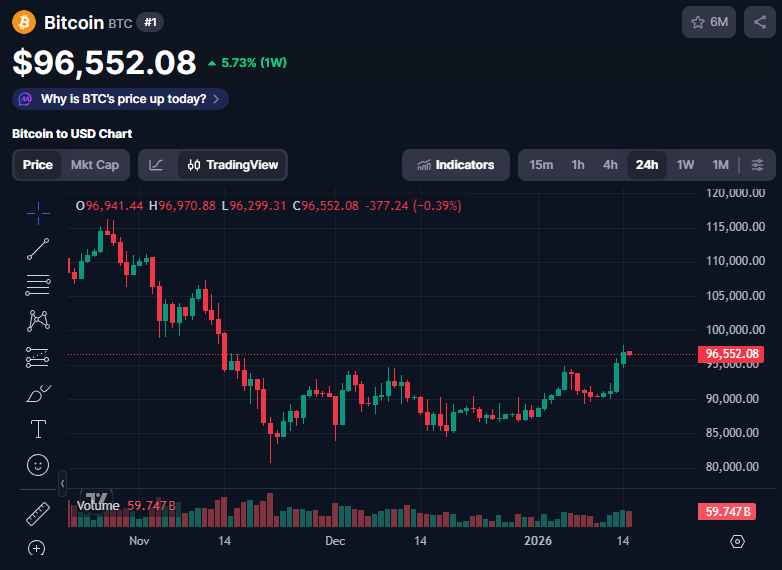
Image source: CoinMarketCap Bitcoin reached a high of $97,924 in the past 24 hours
Why did Bitcoin rise for two consecutive days?
According to comprehensive analysis from foreign media, Bitcoin’s ability to ignore the adverse PPI index and rise is mainly due to large capital inflows into Bitcoin ETFs, short squeeze effects, and the Goldilocks phenomenon.
SoSoValue data shows that US Bitcoin spot ETF saw inflows of $753 million on Tuesday, the largest single-day inflow since October 7 last year.
Analysts believe that ETF capital inflows indicate that traditional and institutional investors, after rebalancing their portfolios, are reallocating funds back into risk assets.
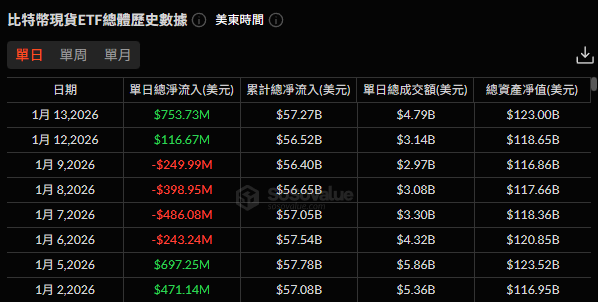
Image source: SoSoValue US Bitcoin spot ETF inflowed $753 million on Tuesday
Cointelegraph analysis points out that Coinbase premium index shows easing selling pressure from the US, and inflows into Coinbase Advanced are 2.5 times the baseline, suggesting active institutional positioning. Additionally, Binance’s hourly net buy volume exceeded $500 million, and the funding rate for perpetual contracts hit multi-month lows, reflecting excessive short positions in the market, which triggered short squeezes and pushed spot prices higher.
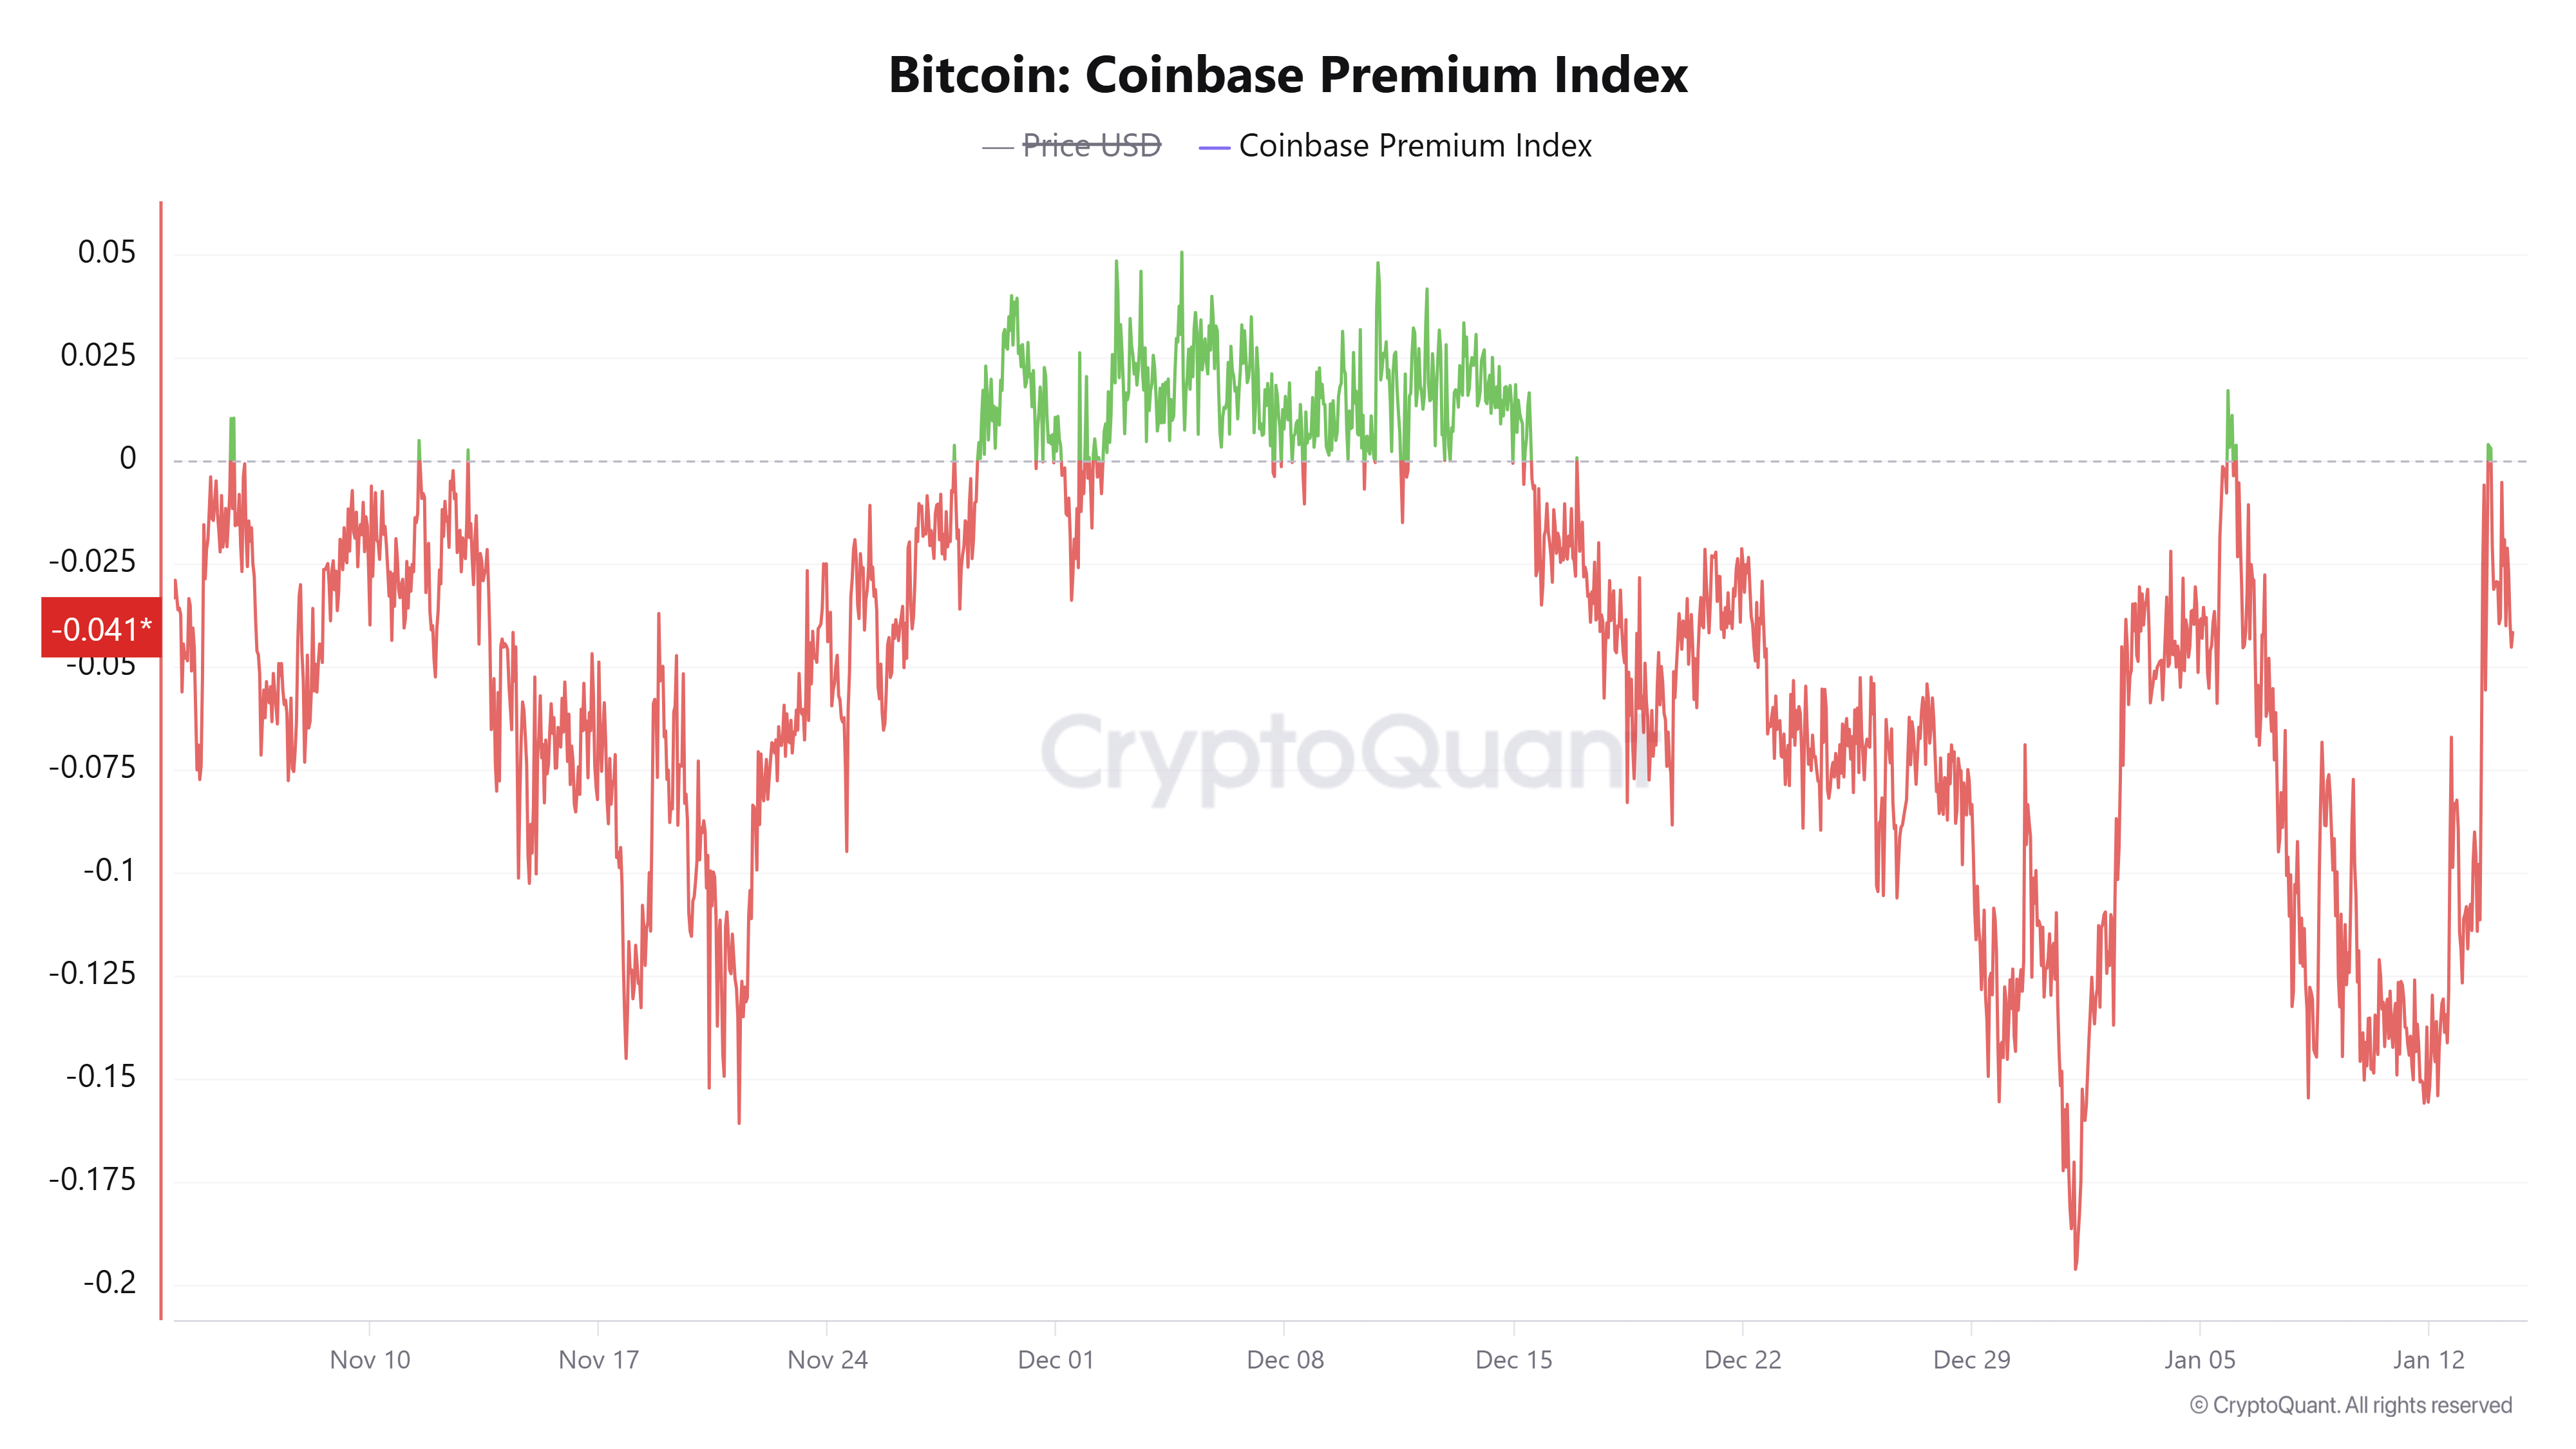
Image source: Cointelegraph Coinbase premium index shows easing US selling pressure, with inflows into Coinbase Advanced reaching 2.5 times the baseline
Crypto trading firm QCP Capital also believes that despite turbulence in Venezuela and Iran, and US involvement, the overall economic environment remains in a Goldilocks state, indicating moderate growth—neither overheating (high inflation) nor cooling (recession), low unemployment, and stable interest rates.
Furthermore, as the US advances the legislative review of the crypto market structure bill and improves regulatory transparency, investor risk appetite for cryptocurrencies and other asset classes has increased.
Does Bitcoin need to hold the $93,500 support, with $100,000 within reach?
As Bitcoin approaches its all-time high, well-known analyst Rekt Capital states that Bitcoin needs to hold the critical support level of $93,500. If the price continues to rise, there is little resistance before reaching $100,000, but between $103,300 and $107,500, there could be significant selling pressure.
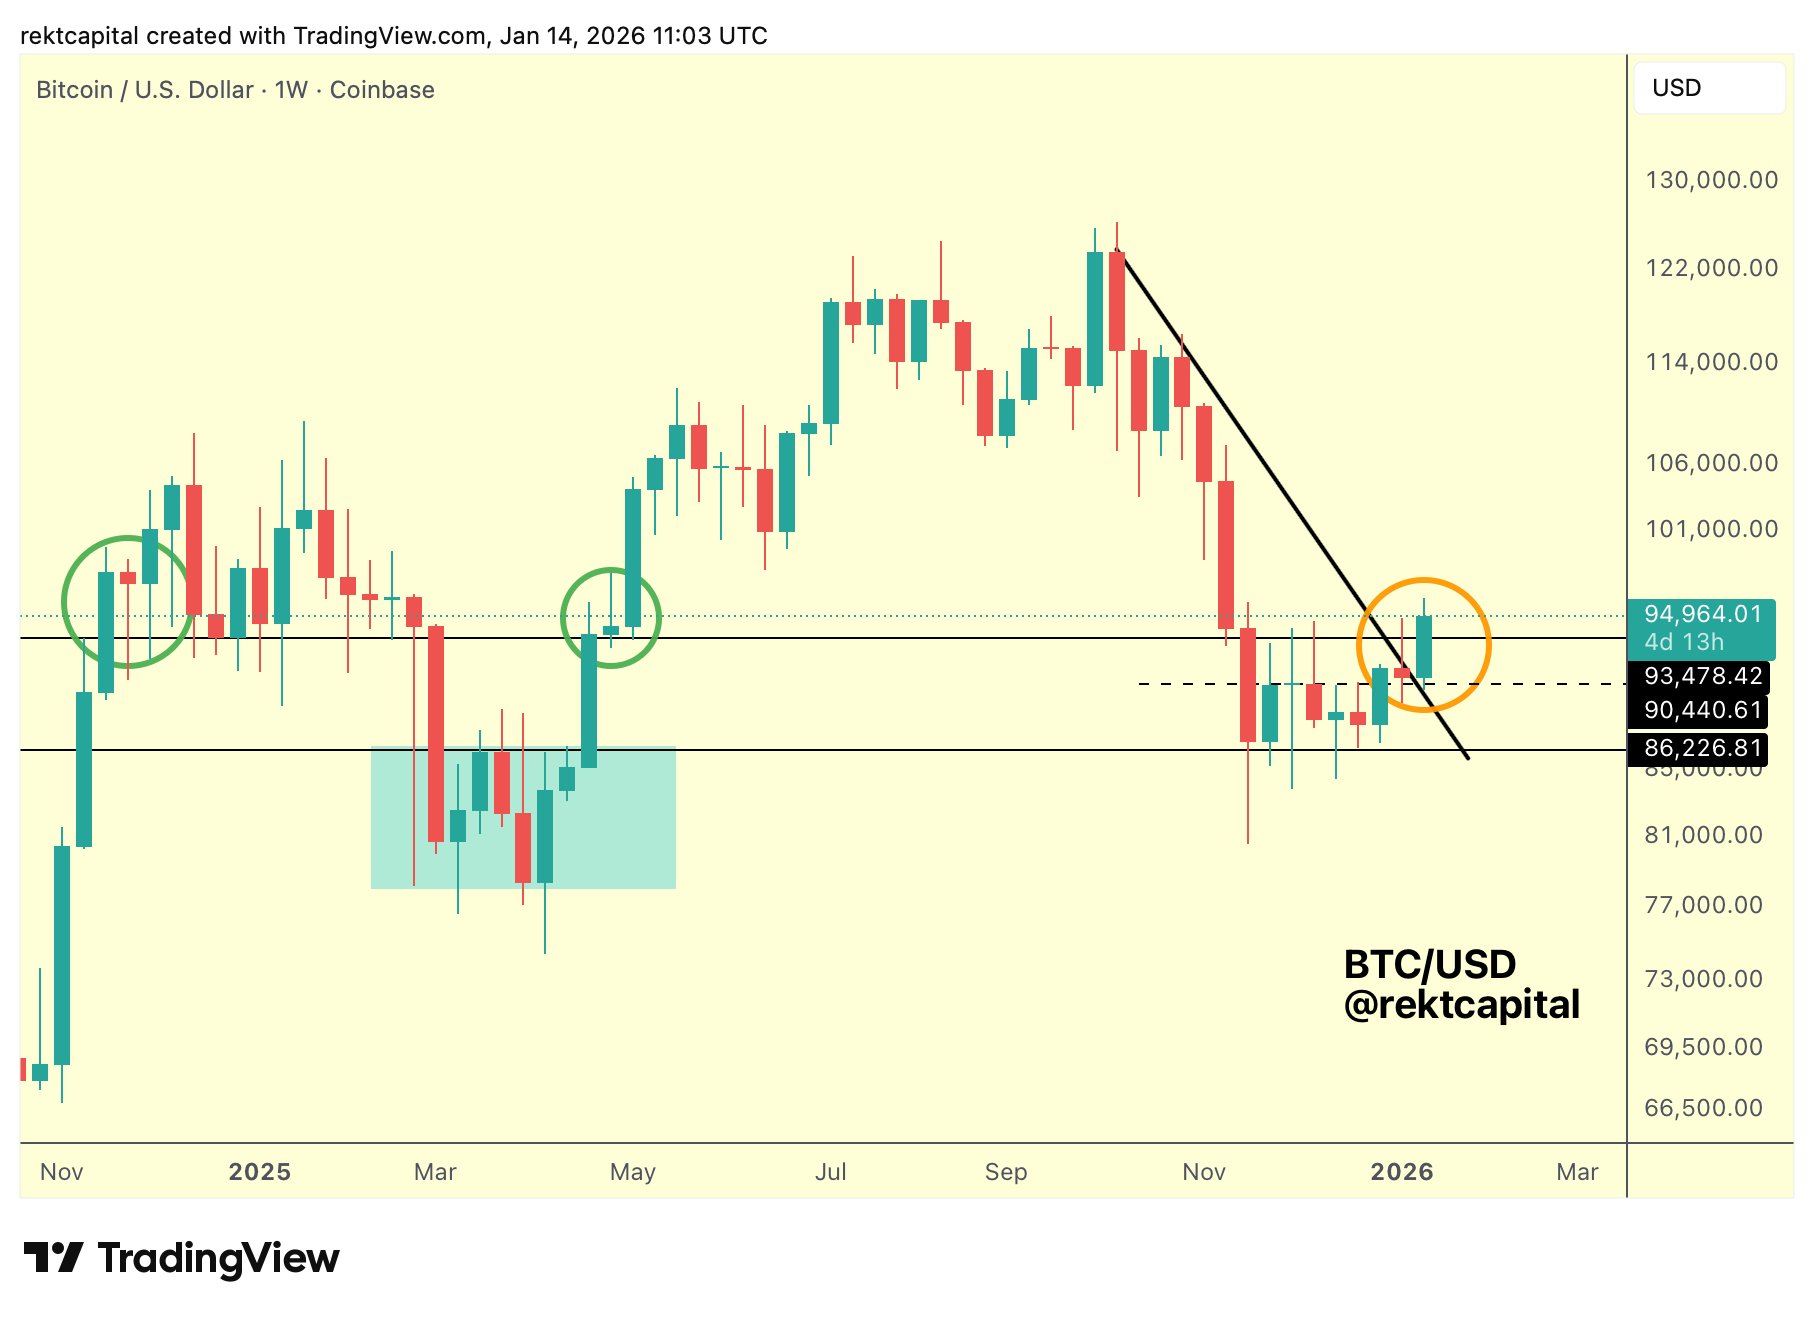
Image source: RektCapital Well-known analyst Rekt Capital states that Bitcoin needs to hold the critical support of $93,500
On the other hand, senior analyst Marcel Pechman points out that the Delta slope indicator of Bitcoin options shows that the trading price of puts remains higher than calls, indicating that professional traders are still skeptical about Bitcoin’s ability to sustain above $100,000.
Bloomberg also added that although some wealth management firms believe the US stock market is off to a good start this year, with upcoming tech earnings reports and geopolitical concerns, market volatility could increase. For Bitcoin, whether it can continue to rely on ETF capital inflows to maintain an independent trend amid these concerns will be a key focus moving forward.
Further reading:
Rumors say Venezuela has $60 billion worth of Bitcoin, will the US take it? SEC: Whether to confiscate remains to be seen
Disclaimer: The information on this page may come from third parties and does not represent the views or opinions of Gate. The content displayed on this page is for reference only and does not constitute any financial, investment, or legal advice. Gate does not guarantee the accuracy or completeness of the information and shall not be liable for any losses arising from the use of this information. Virtual asset investments carry high risks and are subject to significant price volatility. You may lose all of your invested principal. Please fully understand the relevant risks and make prudent decisions based on your own financial situation and risk tolerance. For details, please refer to
Disclaimer.
Related Articles
SIGN Spikes 61.3% As Bulls Loading Driven By Accelerating Smart Money Inflows
The price of the Sign token is edging higher, showing an interesting development in its market, according to a revelation disclosed today by market analyst AltsDaddy. The crypto asset is roaring back to life, with its price today surged to $0.052055 while its trading volume reached $202,178,087, as
BlockChainReporter5m ago
Today, the cryptocurrency Fear and Greed Index is at 12, indicating the market is in extreme fear.
Gate News Report, March 8th, according to Alternative.me data, today’s cryptocurrency Fear and Greed Index is at 12, indicating the market is in a "Extreme Fear" state. This index measures market sentiment, with lower values indicating higher levels of fear.
GateNews29m ago
CryptoQuant Analyst: Bitcoin NUPL-MVRV indicator reaches 0.33, indicating that extreme selling conditions are moderating
Gate News Announcement, March 8 — CryptoQuant analyst Axel posted on X platform that Bitcoin may have entered the mid-stage of this bear market cycle. Data shows that the NUPL–MVRV harmonic composite indicator has reached 0.33, while historical cycle bottoms typically occur around the -0.5 level. The chart indicates that the start of the bear market cycle is trending upward, suggesting that extreme selling conditions are moderating. However, the indicator remains well above historical bottom levels, indicating that a full-scale market sell-off has not yet been confirmed.
GateNews1h ago
Polkadot to Reset Tokenomics on March 12 With Major DOT Supply and Staking Changes
Polkadot will introduce a new monetary framework on March 12 that sets DOT’s supply cap at 2.1 billion and lowers emissions by 53.6%.
The overhaul will also create a Dynamic Allocation Pool and shorten the DOT unbonding period from 28 days to 24–48 hours.
On March 12, Polkadot will reset
CryptoNewsFlash5h ago
Bitcoin May Be Closer to a Bottom Than Most Think, Chart Signals
The Bitcoin price slipped about 2% today, trading slightly below $68,000 after pushing above $73,000 earlier this week, as already covered on our site. The move added fresh pressure to a market that still feels shaky, especially after several failed attempts to hold higher levels.
Still, not e
CaptainAltcoin5h ago
Dogecoin Monthly Breakdown Pattern Reappears as Price Tests $0.0918
Dogecoin is currently trading at $0.09205 at a gain of 2.3, with support of above $0.08878.
As can be seen in the monthly chart, there are recurring breakdown areas that have been followed by significant expansions in price.
The short-term trading range is narrow and the immediate point o
CryptoNewsLand5h ago