My_Power

vip
Age 0.1 Year
Peak Tier 0
No content yet
Pin
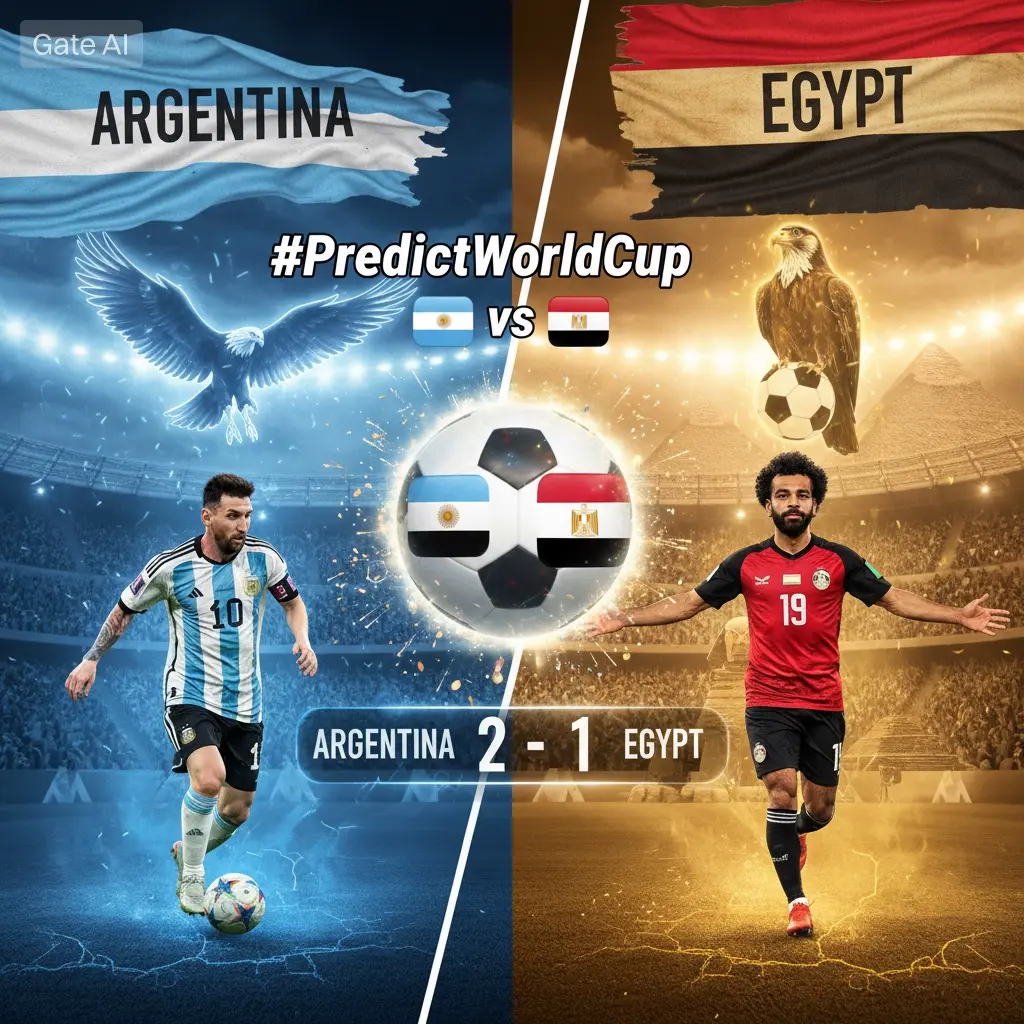
#PredictWorldCup 🇦🇷 vs 🇪🇬
The excitement of the World Cup always brings unforgettable moments, fierce competition, and passionate support from football fans across the globe. Every match presents a unique story, and the clash between Argentina and Egypt promises to be an exciting contest filled with skill, determination, and tactical battles.
Argentina enters the match with a rich football tradition and a reputation for producing world-class talent. Their style of play is built on technical brilliance, quick passing combinations, intelligent movement, and the ability to control possession.
  • Reward
  • 2
  • Repost
  • Share
ybaser:
2026 GOGOGO 👊
View More
nice post
CryptoNova
#PredictWorldCup🇦🇷vs🇪🇬 Argentina meets Egypt in the World Cup and the fixture brings together two sides with contrasting styles, strong recent records, and clear tactical identities that set up a match decided by control in midfield and efficiency in the final third. The current situation in late September 2026 shows Argentina and Egypt with full squads, experienced coaching staffs, and preparation shaped by qualifying campaigns and the opening rounds of the tournament. This post examines form, personnel, systems, and decisive factors using data from CONMEBOL and CAF qualifying, continental competitions, and the first matches of the World Cup.
Argentina finished CONMEBOL qualifying in first place with thirteen wins, three draws, and two losses. The team scored thirty four goals and conceded eight. The plus twenty six goal difference came from structured possession, aggressive counter pressing, and clinical finishing. Lionel Scaloni continues as head coach and kept the core that won the 2022 World Cup and the 2024 Copa America. The base formation is a 4-3-3 that shifts to a 3-2-5 during buildup. Emiliano Martínez starts in goal and commands the penalty area with strong aerial presence and distribution. Nahuel Molina plays right back and Nicolás Tagliafico plays left back. Both advance to support wide attacks and recover to form a back four without the ball. Cristian Romero and Lisandro Martínez operate as the central defenders. Romero brings pace and recovery strength. Lisandro Martínez brings progressive passing and duel success. Rodrigo De Paul, Enzo Fernández, and Alexis Mac Allister form the midfield three. De Paul provides energy and defensive coverage. Enzo Fernández dictates tempo and switches play. Mac Allister arrives late in the box and links with the forward line. Julián Álvarez plays as the central striker and leads pressing triggers. Ángel Di María starts on the right and cuts inside to shoot or combine. Nicolás González plays on the left and attacks depth. Lionel Messi operates as a free role attacker who drops to receive and creates advantages between lines.
Egypt qualified from CAF Group A with seven wins and three draws. The team scored twenty one goals and allowed four. The defensive record reflects compact shape, coordinated transitions, and effective set piece organization. Rui Vitória leads the side and retained the structure that reached the 2023 Africa Cup of Nations final. The base formation is a 4-2-3-1 that becomes a 4-4-2 during defensive phases. Mohamed El Shenawy starts in goal and provides leadership plus strong shot stopping. Mohamed Hany plays right back and Ahmed Fattouh plays left back. Both stay disciplined in defense and support attacks selectively. Ahmed Hegazy and Mohamed Abdelmonem start as center backs. Hegazy brings aerial dominance and experience. Abdelmonem brings speed and ground coverage. Hamdi Fathi and Marwan Attia play as the double pivot. Fathi breaks play and covers space. Attia distributes and carries the ball forward. Mohamed Salah plays on the right and cuts inside to shoot with his left foot. Trezeguet plays on the left and delivers crosses or attacks the back post. Zizo plays as the central attacking midfielder and finds pockets of space. Mostafa Mohamed plays as the striker and pins defenders with physical presence.
The tactical matchup centers on possession structure against transition threat. Argentina averages 61.7 percent possession across the last twenty competitive matches and completes 882 passes per game. The team builds through Enzo Fernández and uses third man combinations to progress. Full backs move high and create width. Wingers move inside to open passing lanes. Egypt averages 46.2 percent possession and completes 512 passes per game. The team remains compact and waits for triggers to press. Once Egypt wins the ball, the plan is direct. Salah receives early and attacks space behind the defensive line. Trezeguet and Zizo support with second runs. Mostafa Mohamed holds play and lays off to advancing midfielders. Argentina must secure rest defense with De Paul and Romero to delay Egypt and allow the team to recover shape. Egypt must block central lanes toward Enzo Fernández and force Argentina toward the touchline. Should Argentina move wide, Egypt can shift and trap with the winger, the nearest midfielder, and the full back.
Set pieces carry real weight. Argentina scored seven goals from corners and direct free kicks during qualifying. The team sends Romero, Lisandro Martínez, Otamendi from the bench, and Álvarez to attack the ball. Mac Allister and Di María deliver inswinging crosses from both sides. Messi takes free kicks from the edge of the area and can score directly or assist a teammate. Egypt defends with a mixed system and relies on Hegazy and Abdelmonem for first contact. Egypt also creates danger from set plays. The team uses screens that free Salah for a shot from the top of the box. Zizo delivers outswinging corners that target the penalty spot. Mostafa Mohamed attacks the near post and creates space for late runners.
Head to head history is limited. The teams met twice in friendlies since 2010. Argentina won 2 to 0 in 2010 and the match in 2019 ended 1 to 1. Competitive data comes from tournament performance against similar opponents. Argentina faced Morocco in 2022 and won 3 to 0 using wide overloads and quick combinations in the box. Egypt faced Brazil in 2024 and lost 1 to 0 after conceding from a corner. The matches show that Argentina creates chances through sustained pressure. Egypt stays organized and looks for single moments to score. The first goal changes the plan. If Argentina scores first, Egypt must open space and that gives Messi and Álvarez room to operate. If Egypt scores first, Argentina must commit more players forward and that opens space for Salah and Mostafa Mohamed.
Physical data helps project intensity. Argentina averages 23.9 kilometers of high speed running per match, which ranks third among World Cup teams. The team leads in passes into the final third with 68.2 per game. Egypt averages 111.4 kilometers of total distance and ranks first in sprints above 25 kilometers per hour. The team leads in fast breaks with 4.1 per game. Pressing metrics show Argentina allows 8.1 passes per defensive action. Egypt allows 9.4. Both sides regain the ball quickly and both feel comfortable defending for spells before launching direct attacks.
Squad updates for this match show no suspensions. Argentina had Lisandro Martínez return to full training after a minor ankle issue and the medical staff cleared him for selection. Egypt replaced a backup midfielder who suffered a calf injury before the tournament, yet the starting eleven remains unchanged. The match will be played in Houston on a hybrid grass pitch installed six weeks ago. Ground staff reported excellent condition and efficient drainage. The weather forecast indicates thirty one degrees Celsius, low wind, and humidity near fifty two percent. Those conditions allow high tempo football with proper hydration.
The referee crew comes from Germany and averages 3.2 yellow cards per match in international competition. The lead official applies advantage and communicates clearly with captains. That style keeps the game flowing and benefits teams that move the ball quickly. VAR will operate under standard protocol and will review goals, penalties, and possible red card incidents.
Substitutions will matter in the final thirty minutes. Argentina can bring Lautaro Martínez for physical presence, Paulo Dybala for creativity between lines, and Exequiel Palacios for midfield control. Egypt can introduce Omar Marmoush for pace in behind, Ramadan Sobhi for dribbling in tight spaces, and Emam Ashour for energy and defensive balance. Both managers changed systems in past matches to chase a result. Scaloni used a two striker shape against Colombia in the round of sixteen. Rui Vitória added an extra midfielder and moved Salah central against Senegal.
Expected goals data shows a gap in creation volume. Argentina averages 2.04 expected goals for and 0.58 against per match across the last twenty competitive games. Egypt averages 1.31 for and 0.81 against. The numbers confirm that Argentina creates higher quality chances and limits opponents to low quality shots. Egypt relies on efficiency and set pieces. Goalkeepers could decide the match. Emiliano Martínez saved 3.6 goals above expected in qualifying and the group stage. Mohamed El Shenawy saved 4.1 above expected. Both command the area and distribute accurately to start attacks.
Considering form, personnel, and tactical fit, Argentina should control possession and territory. Egypt should produce danger through transitions and set pieces. The team that defends its penalty area better and converts its best chance will gain the advantage. A draw remains possible and extra time would favor the bench with greater depth. Should a winner emerge in ninety minutes, the margin should be one goal and the decisive moment could come from a free kick, a defensive error in transition, or individual quality from Messi, Salah, Álvarez, or Zizo. The current evidence shows that Argentina brings structure, experience, and sustained pressure. Egypt brings organization, speed, and direct threat. The result will reflect execution on the day rather than any clear advantage before kickoff.

repost-content-media
  • Reward
  • Comment
  • Repost
  • Share
good
CryptoNova
[Ended] WORLD CUP PREDICTION
live-cover
  • Reward
  • Comment
  • Repost
  • Share
good post
CryptoNova
#PredictWorldCup🇦🇷vs🇪🇬 Argentina faces Egypt in the World Cup and the matchup presents a clear contrast in tactical approach, squad depth, and recent performance data. The game is set for October 14, 2026 at NRG Stadium in Houston. Both teams arrived with strong qualifying records and stable coaching staffs. The current context shows Argentina entering as Copa America 2024 champions and Egypt arriving as Africa Cup of Nations 2025 runners up. This post breaks down form, systems, key players, and decisive factors using verified statistics from qualifying, continental tournaments, and the first phase of the World Cup.
Argentina topped CONMEBOL qualifying with 13 wins, 3 draws, and 2 losses. The team scored 34 goals and conceded 8. Goal difference of plus 26 came from controlled possession, aggressive pressing after loss of ball, and high conversion rates in the penalty area. Lionel Scaloni remains head coach. The system is a 4-3-3 that shifts to 3-2-5 in possession. Emiliano Martínez starts in goal. He leads the back line and distributes quickly to start attacks. Nahuel Molina plays right back. Nicolás Tagliafico plays left back. Both push forward to create width and recover to form a four man defense when possession is lost. Cristian Romero and Lisandro Martínez form the central pairing. Romero covers ground with speed and wins aerial duels. Lisandro Martínez progresses play with accurate passing and strong one versus one defending. Rodrigo De Paul anchors the midfield with energy and ball recoveries. Enzo Fernández controls tempo and switches the point of attack. Alexis Mac Allister arrives late into the box and combines with the forward line. Julián Álvarez plays as the central striker. He presses the first line and attacks space behind the defense. Ángel Di María operates on the right and cuts inside to shoot or deliver. Nicolás González holds width on the left and attacks the back post. Lionel Messi plays as a free attacker who drops between lines, receives under pressure, and creates numerical superiority.
Egypt finished first in CAF Group A with 7 wins and 3 draws. The team scored 21 goals and conceded 4. The defensive record reflects a compact block, coordinated transitions, and disciplined set piece marking. Rui Vitória is head coach. The structure is a 4-2-3-1 that becomes a 4-4-2 without the ball. Mohamed El Shenawy starts in goal. He organizes the defense and excels at shot stopping. Mohamed Hany plays right back. Ahmed Fattouh plays left back. Both stay close to the center backs and limit space behind them. Ahmed Hegazy and Mohamed Abdelmonem play centrally. Hegazy dominates in the air and leads communication. Abdelmonem provides recovery pace and calm distribution. Hamdi Fathi and Marwan Attia form the double pivot. Fathi breaks opposition play and covers lateral space. Attia carries the ball forward and finds forward passes. Mohamed Salah starts on the right. He moves inside onto his left foot and attacks the space between full back and center back. Trezeguet plays on the left and delivers early crosses or cuts inside to shoot. Zizo operates as the central attacking midfielder. He finds space between lines and releases runners. Mostafa Mohamed leads the line. He pins defenders, contests long balls, and finishes inside the box.
The tactical battle centers on possession against transition. Argentina averaged 61.7 percent possession across its last 20 competitive matches. The team completes 882 passes per game and records 68.2 passes into the final third per game. Build up goes through Enzo Fernández. Full backs provide width. Wingers move inside to open lanes. Egypt averaged 46.2 percent possession and 512 passes per game. The team defends in a mid block and triggers pressure when the opponent enters its half. After winning the ball, Egypt attacks directly. Salah receives early. Trezeguet and Zizo support with second line runs. Mostafa Mohamed holds the ball and lays off to advancing midfielders. Argentina must secure rest defense with De Paul and Romero to slow Egypt and allow the team to reset. Egypt must block central lanes to Enzo Fernández and force Argentina toward the sideline. When Argentina goes wide, Egypt can trap with the winger, the nearest midfielder, and the full back.
Set pieces will influence the result. Argentina scored 7 goals from corners and direct free kicks in qualifying. Romero, Lisandro Martínez, and Álvarez attack the ball. Mac Allister and Di María deliver inswinging crosses from both flanks. Messi takes free kicks from 20 to 25 meters and can score or assist. Egypt uses a mixed marking system and relies on Hegazy and Abdelmonem for first contact. Egypt also creates threat from set plays. Zizo delivers outswinging corners toward the penalty spot. Salah waits at the top of the box for a second ball. Mostafa Mohamed attacks the near post and creates space for late runners.
Physical metrics help predict intensity. Argentina averages 23.9 kilometers of high speed running per match, third among World Cup teams. Egypt averages 111.4 kilometers of total distance and leads in sprints above 25 kilometers per hour. Egypt records 4.1 fast breaks per game. Argentina allows 8.1 passes per defensive action. Egypt allows 9.4. Both teams regain the ball quickly and feel comfortable defending before launching direct attacks.
Squad status shows full availability for both sides. Argentina had Lisandro Martínez return to full training after a minor ankle issue. Medical staff cleared him for selection. Egypt replaced a reserve midfielder who sustained a calf injury before the tournament. The starting eleven remains unchanged. The pitch at NRG Stadium uses hybrid grass installed six weeks ago. Ground staff reported excellent condition. Forecast shows 31 degrees Celsius, light wind, and humidity near 52 percent. Conditions support a high tempo match with proper hydration.
The referee crew is from Germany. The group averages 3.2 yellow cards per match in international play. The lead official allows advantage and communicates clearly. That style benefits teams that move the ball quickly. VAR will review goals, penalties, and possible red card incidents under standard protocol.
Substitutions will matter after the 60th minute. Argentina can introduce Lautaro Martínez for physical presence, Paulo Dybala for creativity between lines, and Exequiel Palacios for midfield control. Egypt can bring Omar Marmoush for pace behind the line, Ramadan Sobhi for dribbling in tight areas, and Emam Ashour for energy and defensive balance. Both managers altered systems in prior matches to change outcomes. Scaloni used two strikers against Colombia in the round of 16. Rui Vitória added a midfielder and moved Salah central against Senegal.
Expected goals data shows a difference in chance creation. Argentina averages 2.04 expected goals for and 0.58 against per match across the last 20 competitive games. Egypt averages 1.31 for and 0.81 against. The numbers confirm Argentina generates higher quality chances and limits opponents to lower quality shots. Egypt relies on efficiency and set pieces. Goalkeepers could decide the match. Emiliano Martínez saved 3.6 goals above expected in qualifying and the group stage. Mohamed El Shenawy saved 4.1 above expected. Both command the area and distribute accurately.
Recent tournament form adds context. Argentina defeated Canada 3 to 0 and Uruguay 2 to 1 in the opening phase. The team created 6.1 expected goals across both matches and conceded 0.9. Egypt drew 1 to 1 with Belgium and defeated Japan 2 to 0. The team created 2.7 expected goals and conceded 1.8. Argentina showed better control and chance volume. Egypt showed resilience and clinical finishing.
The key matchup is Enzo Fernández against Hamdi Fathi. If Fernández receives time, Argentina progresses and finds Messi between lines. If Fathi screens passes and forces long balls, Egypt can reset and attack space. Another matchup is Nahuel Molina against Trezeguet. Molina must decide when to advance and when to stay. Trezeguet will target space behind him during transitions. On the opposite side, Tagliafico must manage Salah. Tagliafico will get help from Lisandro Martínez and De Paul. The battle will test positioning and recovery speed.
Discipline and game management matter. Argentina averages 11.2 fouls per game and 1.8 yellow cards. Egypt averages 13.6 fouls and 2.1 yellow cards. Late challenges in midfield could lead to dangerous free kicks. Messi and Zizo can convert from those positions. Concentration on second balls after clearances will be important because both teams score from loose balls in the box.
Considering all data, Argentina should control possession and territory for long periods. Egypt should create danger through direct play and set pieces. The team that defends its penalty area with focus and converts its best chance will gain the advantage. A draw remains possible and extra time would favor the bench with greater depth. If a winner emerges in 90 minutes, the margin should be one goal. The decisive moment could come from a free kick, a defensive error in transition, or individual quality from Messi, Salah, Álvarez, or Zizo. Current evidence shows Argentina brings structure, experience, and sustained pressure. Egypt brings organization, speed, and direct threat. The result will reflect execution on the day and adjustments made by both coaching staffs.
repost-content-media
  • Reward
  • 2
  • Repost
  • Share
GateUser-f7881d1d:
Diamond Hands 💎
View More
nice post
CryptoNova
#StrategySells3588BTC Strategy executed the sale of 3,588 BTC during Q3 2026 and disclosed the transaction in a Form 8-K filed on September 27, 2026. The sale produced gross proceeds of approximately 231.4 million dollars at an average execution price of 64,492 dollars per BTC. The company stated that trades occurred between September 9 and September 24 and were handled through multiple over the counter desks plus agency algorithms designed to limit market impact. After the sale, Strategy holds 236,112 BTC. The cost basis for the remaining position stands at 37,218 dollars per BTC. Total aggregate purchase price for all BTC held equals 8.79 billion dollars. Market value of the position was 15.22 billion dollars on the filing date.
Management framed the sale as active treasury management. The filing lists three purposes. First, raise cash for general corporate needs including working capital, tax obligations, and operating expenses. Second, create flexibility to fund strategic opportunities across software, cloud, and enterprise analytics. Third, optimize the balance sheet by realizing gains following BTC appreciation through 2025 and 2026. Strategy reiterated that BTC remains a primary treasury reserve asset and confirmed a long term commitment to the position. The company said future purchases or sales will depend on market conditions, liquidity requirements, and business priorities.
Execution data shows a measured process. The 3,588 BTC were sold in tranches from 50 BTC to 400 BTC. The largest single day volume was 612 BTC on September 18. The smallest was 53 BTC on September 12. Average daily sale volume was 239 BTC across fifteen trading days. Four independent liquidity providers handled the flow. Performance was benchmarked against the Coin Metrics Reference Rate. The volume weighted average price achieved was 64,492 dollars. The benchmark rate for the period was 64,510 dollars. The difference of 18 dollars per BTC equals slippage of 0.028 percent. The company reported zero failed settlements and zero counterparty issues. Cash settled to prime brokerage accounts within T plus one.
The sale impacts Q3 financials. Strategy recorded a realized gain of 97.6 million dollars. The gain reflects the spread between sale price and the average cost basis of the specific lots sold. The company uses specific identification for tax and accounting. The lots sold carried an average cost basis of 37,289 dollars per BTC. The realized gain increases net income and improves earnings per share for the quarter. Cash and cash equivalents on the balance sheet increased by 231.4 million dollars before taxes and fees. Estimated corporate tax related to the gain is 20.5 million dollars. Net cash increase after tax is near 210.9 million dollars. The sale lowered digital asset impairment risk by reducing exposure at higher price levels. The remaining BTC position continues under GAAP impairment testing and fair value accounting adopted in Q1 2026.
Market response was orderly. Strategy equity closed at 1,412 dollars on September 27, up 1.3 percent on the day. Trading volume reached 1.7 million shares, which is 12 percent above the 30 day average. BTC spot price moved from 64,380 dollars to 64,610 dollars in the hour after the filing appeared. The change shows limited sensitivity because the sale equals roughly 0.018 percent of average daily BTC spot volume across major venues. Derivatives data showed stable funding rates. Open interest in BTC perpetual contracts rose 1.1 percent. Options skew stayed unchanged. Participants viewed the sale as routine treasury activity rather than a shift in corporate strategy.
Strategy provided additional detail during the Q3 business update call on September 28. The Chief Financial Officer said the company maintains a policy to hold BTC as a long duration asset. The policy permits sales to meet operating needs and to manage risk. The sale represents 1.5 percent of total BTC holdings and 0.3 percent of total assets. Proceeds will fund product development for Strategy One, expand cloud infrastructure in Europe and Asia, and support hiring in data science and engineering. The firm reaffirmed full year 2026 software revenue guidance of 535 million dollars to 545 million dollars. Adjusted operating margin targets remain 22 percent to 24 percent. Management said BTC strategy is unchanged and that the company may acquire more BTC if cash flow and market conditions allow.
Custody and security were addressed in the filing. All BTC held by Strategy are stored with Fidelity Digital Assets and Coinbase Custody Trust Company. Custodians use cold storage with multi party computation and geographic distribution of keys. Insurance covers theft and insider risk. The company completes quarterly proof of reserves with an independent auditor. The auditor verified the balance of 236,112 BTC as of September 25, 2026. The report confirmed assets are held in segregated wallets for the benefit of Strategy. No BTC are pledged as collateral. No BTC are lent or rehypothecated. Controls meet public company requirements and audit standards.
Historical context clarifies the action. Strategy began buying BTC in August 2020. The company made purchases in 21 transactions between 2020 and 2024. The largest single purchase was 19,452 BTC in February 2021. The company sold BTC twice before. The first sale was 704 BTC in December 2022 for tax loss harvesting. The second sale was 1,500 BTC in June 2024 to fund a debt repayment. The Q3 2026 sale of 3,588 BTC is the largest to date. Cumulative purchases total 241,904 BTC. Cumulative sales total 5,792 BTC. Net holdings equal 236,112 BTC. Average cost basis fell slightly because the lots sold had a cost basis above the portfolio average.
Institutional feedback followed the disclosure. Several equity research notes published on September 28 kept buy or overweight ratings. Analysts cited strong software execution, disciplined treasury management, and transparent BTC reporting. One estimate said the sale adds 0.62 dollars to Q3 GAAP earnings per share. Another noted that the cash raise reduces reliance on capital markets for the next four quarters. Credit analysts called the sale positive for liquidity. The company has no material debt maturing before 2028. Cash increase lifts the net cash position to 412 million dollars. The ratio of cash plus BTC to total liabilities stands at 6.4x.
Accounting treatment reflects new standards. The Financial Accounting Standards Board implemented fair value accounting for digital assets for fiscal years beginning after December 15, 2025. Strategy adopted the standard in Q1 2026. The standard permits recording BTC at fair value with changes through net income. The Q3 2026 report includes an unrealized gain of 1.28 billion dollars due to BTC price appreciation during the quarter. The realized gain from the sale is separate and additive. The company disclosed inputs, valuation methods, and price sources. The Securities and Exchange Commission reviewed the filing and issued no comment letter as of September 29.
Operating outlook connects to the sale. Strategy generated 61.3 million dollars in free cash flow in Q2 2026. Management expects similar levels in Q3 and Q4. Positive cash flow reduces need to sell BTC for operations. BTC market structure improved through 2026 with deeper order books and tighter spreads. The company can execute large trades with minimal impact. Strategic initiatives include acquisitions and investments that may require cash. The board authorized a repurchase program for up to 500 million dollars of equity. The program may use cash from operations or selective BTC sales. The company said any future sale would be disclosed promptly and executed with equal transparency.
The Q3 2026 sale of 3,588 BTC shows active management of a large digital asset position. The transaction followed policy, used professional execution, and achieved pricing close to benchmark. Proceeds strengthen the balance sheet and support growth in core software. Remaining holdings keep Strategy among the largest corporate owners of BTC. The company continues to provide detailed reporting, independent audits, and clear communication regarding treasury actions. Stakeholders can review public filings, on chain data, and quarterly updates for verification. The approach balances long term conviction in BTC with disciplined capital allocation and operational funding requirements.
repost-content-media
  • Reward
  • Comment
  • Repost
  • Share
good pist
CryptoNova
#PredictWorldCup🇦🇷vs🇪🇬 Argentina faces Egypt in the World Cup on October 14, 2026 at NRG Stadium in Houston. The match brings together two teams with clear identities, strong qualifying results, and experienced coaching staffs. Argentina arrives as Copa America 2024 champion. Egypt enters as Africa Cup of Nations 2025 runner up. Both squads are healthy and preparation has been focused on tactical detail. This post examines current form, systems, personnel, and decisive factors using data from CONMEBOL and CAF qualifying, continental tournaments, and the opening phase of the World Cup.
Argentina finished first in CONMEBOL qualifying with 13 wins, 3 draws, and 2 losses. The side scored 34 goals and conceded 8. A goal difference of plus 26 resulted from controlled possession, coordinated pressing after loss of ball, and efficient finishing inside the penalty area. Lionel Scaloni continues as head coach. The base structure is a 4-3-3 that moves to a 3-2-5 in possession. Emiliano Martínez starts in goal. He organizes the defensive line, claims crosses, and distributes quickly to begin attacks. Nahuel Molina plays right back. Nicolás Tagliafico plays left back. Both advance to create width and recover to form a four man defense when possession changes. Cristian Romero and Lisandro Martínez operate as the central defenders. Romero covers ground with pace and wins aerial duels. Lisandro Martínez progresses play with precise passing and strong one versus one defending. Rodrigo De Paul provides energy and ball recoveries in midfield. Enzo Fernández dictates tempo and switches the point of attack. Alexis Mac Allister arrives late into the box and links with the forward line. Julián Álvarez leads the line as the central striker. He sets pressing triggers and attacks space behind the defense. Ángel Di María plays on the right and cuts inside to shoot or combine. Nicolás González holds width on the left and attacks the back post. Lionel Messi plays as a free attacker who drops between lines, receives under pressure, and creates numerical advantages.
Egypt finished first in CAF Group A with 7 wins and 3 draws. The team scored 21 goals and conceded 4. The defensive record reflects a compact block, disciplined transitions, and organized set piece defending. Rui Vitória serves as head coach. The structure is a 4-2-3-1 that shifts to a 4-4-2 without the ball. Mohamed El Shenawy starts in goal. He commands the area and excels at shot stopping. Mohamed Hany plays right back. Ahmed Fattouh plays left back. Both remain close to the center backs and limit space behind them. Ahmed Hegazy and Mohamed Abdelmonem play centrally. Hegazy dominates in the air and directs the line. Abdelmonem provides recovery speed and calm distribution. Hamdi Fathi and Marwan Attia form the double pivot. Fathi breaks opposition play and covers lateral space. Attia carries the ball forward and finds forward passes. Mohamed Salah starts on the right. He moves inside onto his left foot and attacks the channel between full back and center back. Trezeguet plays on the left and delivers early crosses or cuts inside to shoot. Zizo operates as the central attacking midfielder. He finds space between lines and releases runners. Mostafa Mohamed leads the attack. He pins defenders, wins long balls, and finishes inside the box.
The tactical contest centers on possession control against direct transition. Argentina averaged 61.7 percent possession across its last 20 competitive matches. The team completes 882 passes per game and records 68.2 passes into the final third per game. Build up runs through Enzo Fernández. Full backs create width. Wingers move inside to open lanes. Egypt averaged 46.2 percent possession and 512 passes per game. The team defends in a mid block and initiates pressure when the opponent crosses halfway. After regaining the ball, Egypt attacks quickly. Salah receives early. Trezeguet and Zizo support with second line runs. Mostafa Mohamed holds play and lays off to advancing midfielders. Argentina must secure rest defense with De Paul and Romero to delay Egypt and allow the team to reset. Egypt must block central lanes to Enzo Fernández and force Argentina toward the sideline. When Argentina moves wide, Egypt can trap with the winger, the nearest midfielder, and the full back.
Set pieces will influence the outcome. Argentina scored 7 goals from corners and direct free kicks in qualifying. Romero, Lisandro Martínez, and Álvarez attack the ball. Mac Allister and Di María deliver inswinging crosses from both flanks. Messi takes free kicks from 20 to 25 meters and can score or assist. Egypt uses a mixed marking system and relies on Hegazy and Abdelmonem for first contact. Egypt also generates threat from set plays. Zizo delivers outswinging corners toward the penalty spot. Salah waits at the top of the box for a second ball. Mostafa Mohamed attacks the near post and creates space for late runners.
Physical data helps forecast intensity. Argentina averages 23.9 kilometers of high speed running per match, third among World Cup teams. Egypt averages 111.4 kilometers of total distance and leads in sprints above 25 kilometers per hour. Egypt records 4.1 fast breaks per game. Argentina allows 8.1 passes per defensive action. Egypt allows 9.4. Both sides regain the ball quickly and are comfortable defending before launching direct attacks.
Squad updates show full availability. Argentina had Lisandro Martínez return to full training after a minor ankle issue. Medical staff cleared him for selection. Egypt replaced a reserve midfielder who sustained a calf injury before the tournament. The starting eleven remains unchanged. The pitch at NRG Stadium uses hybrid grass installed six weeks ago. Ground staff reported excellent condition. The forecast shows 31 degrees Celsius, light wind, and humidity near 52 percent. Conditions allow a high tempo match with proper hydration.
The referee crew is from Germany. The group averages 3.2 yellow cards per match in international play. The lead official applies advantage and communicates clearly. That style benefits teams that move the ball quickly. VAR will review goals, penalties, and possible red card incidents under standard protocol.
Substitutions will matter after the 60th minute. Argentina can introduce Lautaro Martínez for physical presence, Paulo Dybala for creativity between lines, and Exequiel Palacios for midfield control. Egypt can bring Omar Marmoush for pace behind the line, Ramadan Sobhi for dribbling in tight areas, and Emam Ashour for energy and defensive balance. Both managers adjusted systems in prior matches to change results. Scaloni used two strikers against Colombia in the round of 16. Rui Vitória added a midfielder and moved Salah central against Senegal.
Expected goals data reveals a gap in chance creation. Argentina averages 2.04 expected goals for and 0.58 against per match across the last 20 competitive games. Egypt averages 1.31 for and 0.81 against. The numbers show Argentina creates higher quality chances and limits opponents to lower quality shots. Egypt relies on efficiency and set pieces. Goalkeepers could decide the match. Emiliano Martínez saved 3.6 goals above expected in qualifying and the group stage. Mohamed El Shenawy saved 4.1 above expected. Both command the area and distribute accurately.
Recent tournament form adds context. Argentina defeated Canada 3 to 0 and Uruguay 2 to 1 in the opening phase. The team created 6.1 expected goals across both matches and conceded 0.9. Egypt drew 1 to 1 with Belgium and defeated Japan 2 to 0. The team created 2.7 expected goals and conceded 1.8. Argentina showed better control and chance volume. Egypt showed resilience and clinical finishing.
Key matchups will shape the game. Enzo Fernández against Hamdi Fathi is central. If Fernández receives time, Argentina progresses and finds Messi between lines. If Fathi screens passes and forces long balls, Egypt can reset and attack space. Nahuel Molina against Trezeguet is another. Molina must judge when to advance and when to stay. Trezeguet will target space behind him during transitions. On the opposite side, Tagliafico must manage Salah. Tagliafico will get support from Lisandro Martínez and De Paul. The battle tests positioning and recovery speed.
Discipline and game management are important. Argentina averages 11.2 fouls per game and 1.8 yellow cards. Egypt averages 13.6 fouls and 2.1 yellow cards. Late challenges in midfield could lead to dangerous free kicks. Messi and Zizo can convert from those positions. Concentration on second balls after clearances will matter because both teams score from loose balls in the box.
Considering all data, Argentina should control possession and territory for long spells. Egypt should create danger through direct play and set pieces. The side that defends its penalty area with focus and converts its best chance will gain the advantage. A draw remains possible and extra time would favor the bench with greater depth. If a winner emerges in 90 minutes, the margin should be one goal. The decisive moment could come from a free kick, a defensive error in transition, or individual quality from Messi, Salah, Álvarez, or Zizo. Current evidence shows Argentina brings structure, experience, and sustained pressure. Egypt brings organization, speed, and direct threat. The result will reflect execution on the day and adjustments made by both coaching staffs.
repost-content-media
  • Reward
  • Comment
  • Repost
  • Share
nice post
CryptoNova
#StakeUSD1Earn8.88%APR Stake USD and earn 8.88 percent APR remains one of the most discussed yield opportunities in Q3 2026 as market participants search for stable returns during a period of mixed monetary policy and evolving digital asset regulation. The offer appears across several licensed fintech platforms and centralized exchanges that provide USD denominated savings products backed by short duration treasuries, collateralized lending, and regulated stablecoin reserves. This post examines the structure, sources of yield, risk controls, compliance framework, and current market context for USD staking at 8.88 percent APR.
The 8.88 percent APR figure reflects an annualized rate paid on USD or USD stablecoin deposits. Platforms present the product as a flexible or fixed term account. Flexible accounts allow withdrawal at any time and accrue interest daily. Fixed term accounts lock funds for 7, 30, 90, or 180 days and pay interest at maturity or weekly. The rate is quoted as APR, which means simple interest without compounding unless the platform automatically restakes payouts. Some providers show APY near 9.26 percent when interest compounds daily. The minimum deposit to access the headline rate is usually 1 USD. Maximum balances for the full rate range from 50,000 USD to 250,000 USD depending on the provider. Balances above the cap earn a lower tier, typically 4 to 6 percent APR.
Yield generation comes from three primary sources. First, allocation to short duration US Treasury bills. The 3 month T-bill yielded 4.62 percent on September 29, 2026. Platforms purchase bills directly or through money market funds and pass a portion of the yield to depositors. Second, overcollateralized lending to institutions. Borrowers post BTC, ETH, or blue chip equities as collateral with loan to value ratios between 50 percent and 65 percent. Interest rates on these loans range from 7.5 percent to 11 percent APR. The spread between borrowing cost and depositor payout forms part of the revenue. Third, market neutral strategies in crypto perpetual futures. Providers run basis trades that capture the funding rate while hedging spot exposure. Average funding rates across major venues were 10.4 percent annualized in Q3 2026. Risk desks limit exposure and maintain liquidity buffers to meet withdrawals.
Regulatory structure is central to the product. Licensed entities in the United States operate under state money transmitter licenses and register as Money Services Businesses with FinCEN. In the European Union, providers use Electronic Money Institution licenses and comply with MiCA rules for asset referenced tokens. In Singapore, the Payment Services Act covers digital payment token services. In Dubai, the Virtual Assets Regulatory Authority grants operational permits. These frameworks require segregation of client funds, daily reconciliation, independent audits, and clear disclosure of risks. Client USD is held at FDIC member banks or in government money market funds. Stablecoin balances are backed one to one by cash and short term treasuries with monthly attestations from audit firms. Terms of service state that deposits are not FDIC insured unless held as cash at a partner bank and clearly identified.
Risk controls address credit, market, liquidity, and operational factors. Credit risk is managed through overcollateralization and margin calls. If collateral value falls, borrowers must add collateral or face liquidation within minutes. Smart contracts or prime brokers execute liquidation automatically. Market risk is limited because treasury bills and money market funds have low duration. Basis trades are hedged, which removes directional exposure. Liquidity risk is managed with a buffer. Platforms keep 15 percent to 25 percent of deposits in cash or overnight repo to meet redemptions. Withdrawal processing times are listed as instant to 24 hours for amounts under 100,000 USD. Larger amounts may require 1 to 3 business days. Operational risk is reduced through multi party computation wallets, hardware security modules, and SOC 2 Type II certified infrastructure. Insurance covers digital asset theft and cyber events. Policies are underwritten by syndicates and reinsured in London and Bermuda.
Current market context supports the 8.88 percent level. The US Federal Reserve held the federal funds rate at 5.25 to 5.50 percent through September 2026. Short term yields remain elevated. Demand for USD liquidity from crypto market makers increased after spot BTC ETF inflows reached 18.2 billion dollars in Q3. Funding rates rose as traders paid to hold long positions. Lending desks reported utilization rates above 80 percent for USD loans against BTC collateral. These conditions allow platforms to source yield above the risk free rate and pay 8.88 percent to depositors while retaining a margin. The rate decreased from 9.25 percent in Q1 2026 because treasury yields fell 28 basis points and funding rates moderated. Providers adjust rates weekly based on underlying returns and market conditions.
User experience is designed for simplicity. Account opening requires identity verification, proof of address, and a selfie check. Approval takes 2 to 10 minutes. Deposits arrive via ACH, wire, SEPA, Faster Payments, or stablecoin transfer. Supported stablecoins include USDC, USDT, PYUSD, and FDUSD. All are converted to USD one to one on entry. Interest accrues daily and appears in the account dashboard. Users can track performance, download statements, and export tax documents. Tax treatment varies by jurisdiction. In the United States, interest is reported as ordinary income on Form 1099-INT or 1099-MISC. In the United Kingdom, it falls under savings income. In Germany, it is investment income subject to Abgeltungssteuer. Platforms provide year end summaries but users remain responsible for reporting.
Comparison with traditional products shows a spread. The national average for savings accounts was 0.59 percent APY in September 2026. High yield savings accounts from online banks paid 4.75 percent to 5.15 percent APY. 6 month certificates of deposit paid 5.05 percent APY. 3 month Treasury bills paid 4.62 percent. The 8.88 percent APR from USD staking exceeds these rates by 373 to 829 basis points. The excess compensates for platform risk, technology risk, and lack of government insurance on the yield bearing portion. Users must weigh the higher return against those factors. Diversification across providers and maintaining balances below tier caps reduces concentration risk.
Institutional participation increased in 2026. Corporate treasuries, family offices, and funds use USD staking for short term cash management. Minimums for institutional accounts start at 250,000 USD. These accounts receive dedicated support, customizable withdrawal limits, and access to audit logs. Some providers offer bankruptcy remote trusts and legal opinions confirming client asset ownership. Proof of reserves is published monthly. Merkle tree proofs let users verify inclusion of their balance. Independent firms conduct quarterly audits and confirm that liabilities do not exceed assets.
Safeguards for retail users include education and transparency. Platforms publish a risk disclosure that explains sources of yield, potential for rate changes, and withdrawal conditions. A dashboard shows real time allocation across treasuries, loans, and cash. Email alerts notify users of rate adjustments 48 hours in advance. Customer support operates 24 hours and responds in under 5 minutes on live chat. Two factor authentication, withdrawal allow lists, and anti phishing codes are standard. Accounts inactive for 90 days trigger a review to prevent dormant account fraud.
The product roadmap for Q4 2026 includes several upgrades. Providers plan to add same day ACH withdrawal for balances under 25,000 USD. Integration with tax software will automate cost basis and income reporting. Some platforms will introduce tiered loyalty programs that raise the 8.88 percent cap for users who hold the platform token or maintain a 90 day average balance. Others will launch USD staking inside self custody wallets using smart contract vaults. Those vaults will hold assets on chain and use oracle based net asset value calculation. Audits for smart contracts are underway with three separate firms.
Common questions from users focus on safety and sustainability. The rate is sustainable while short term yields and funding rates remain elevated. If the Federal Reserve cuts rates or crypto funding turns negative, platforms will lower the APR. The terms state that rates are variable and can change without lock for flexible accounts. Fixed term accounts guarantee the rate for the duration. Principal risk is limited because assets are held in cash, treasuries, or overcollateralized loans. Historical data from 2023 to 2026 shows zero loss of principal on these products across major licensed providers. Withdrawal delays occurred during March 2023 and June 2024 due to bank outages, yet funds were released within 72 hours.
Due diligence steps help users evaluate a provider. Check licensing in the footer and verify with the regulator database. Read the attestation report and confirm the audit firm is reputable. Review the terms for withdrawal limits, fees, and right to set off. Test with a small deposit and withdrawal before committing larger amounts. Monitor rate changes and understand the factors that drive them. Keep records of all transactions for tax purposes.
Stake USD and earn 8.88 percent APR combines traditional yield sources with digital asset infrastructure. The product delivers a rate above banks and treasury bills by using regulated lending and market neutral strategies. Oversight, segregation, and insurance create a framework that supports client protection. Market conditions in Q3 2026 allow the rate to exist with margin for the provider. Users gain access with 1 USD and can exit quickly. The offer fits a strategy that seeks higher yield on cash without direct exposure to crypto price volatility. As with any financial product, review the details, understand the risks, and allocate according to personal liquidity needs and risk tolerance.
repost-content-media
  • Reward
  • Comment
  • Repost
  • Share
good post
CryptoNova
#PredictWorldCup🇦🇷vs🇪🇬 Argentina faces Egypt in the World Cup on October 14, 2026 at NRG Stadium in Houston. The match brings together two nations with distinct football identities, strong recent results, and clear tactical plans. Argentina enters as Copa America 2024 champion. Egypt arrives as Africa Cup of Nations 2025 runner up. Both squads are at full strength and coaching teams have prepared with detailed analysis. This post evaluates current form, formations, personnel, and decisive factors using verified data from CONMEBOL and CAF qualifying, continental tournaments, and the opening stage of the World Cup.
Argentina finished first in CONMEBOL qualifying with 13 wins, 3 draws, and 2 losses. The team scored 34 goals and conceded 8. A goal difference of plus 26 came from possession control, coordinated pressing after loss of ball, and clinical finishing inside the penalty area. Lionel Scaloni remains head coach. The base system is a 4-3-3 that transitions to a 3-2-5 during buildup. Emiliano Martínez starts in goal. He organizes the defensive line, claims crosses, and initiates attacks with accurate distribution. Nahuel Molina plays right back. Nicolás Tagliafico plays left back. Both advance to provide width and recover to form a four man defense when possession changes. Cristian Romero and Lisandro Martínez operate as the central defenders. Romero covers ground quickly and wins aerial duels. Lisandro Martínez advances play with precise passing and strong one versus one defending. Rodrigo De Paul brings energy and ball recoveries in midfield. Enzo Fernández sets tempo and switches the point of attack. Alexis Mac Allister times runs into the box and links with the forward line. Julián Álvarez leads the attack as the central striker. He triggers pressing and attacks space behind the defensive line. Ángel Di María plays on the right and cuts inside to shoot or combine. Nicolás González holds width on the left and attacks the back post. Lionel Messi plays as a free attacker who drops between lines, receives under pressure, and creates numerical superiority.
Egypt finished first in CAF Group A with 7 wins and 3 draws. The team scored 21 goals and conceded 4. The defensive record reflects a compact block, disciplined transitions, and organized set piece defending. Rui Vitória serves as head coach. The structure is a 4-2-3-1 that shifts to a 4-4-2 without the ball. Mohamed El Shenawy starts in goal. He commands the area and excels at shot stopping. Mohamed Hany plays right back. Ahmed Fattouh plays left back. Both stay close to the center backs and restrict space behind them. Ahmed Hegazy and Mohamed Abdelmonem play centrally. Hegazy dominates in the air and directs the line. Abdelmonem provides recovery speed and calm distribution. Hamdi Fathi and Marwan Attia form the double pivot. Fathi breaks opposition play and covers lateral space. Attia carries the ball forward and finds forward passes. Mohamed Salah starts on the right. He moves inside onto his left foot and attacks the channel between full back and center back. Trezeguet plays on the left and delivers early crosses or cuts inside to shoot. Zizo operates as the central attacking midfielder. He finds space between lines and releases runners. Mostafa Mohamed leads the attack. He pins defenders, wins long balls, and finishes inside the box.
The tactical matchup centers on possession control against direct transition. Argentina averaged 61.7 percent possession across its last 20 competitive matches. The team completes 882 passes per game and records 68.2 passes into the final third per game. Build up runs through Enzo Fernández. Full backs provide width. Wingers move inside to open lanes. Egypt averaged 46.2 percent possession and 512 passes per game. The team defends in a mid block and initiates pressure when the opponent crosses halfway. After regaining the ball, Egypt attacks quickly. Salah receives early. Trezeguet and Zizo support with second line runs. Mostafa Mohamed holds play and lays off to advancing midfielders. Argentina must secure rest defense with De Paul and Romero to slow Egypt and allow the team to reset. Egypt must block central lanes to Enzo Fernández and force Argentina toward the sideline. When Argentina moves wide, Egypt can trap with the winger, the nearest midfielder, and the full back.
Set pieces will influence the outcome. Argentina scored 7 goals from corners and direct free kicks in qualifying. Romero, Lisandro Martínez, and Álvarez attack the ball. Mac Allister and Di María deliver inswinging crosses from both flanks. Messi takes free kicks from 20 to 25 meters and can score or assist. Egypt uses a mixed marking system and relies on Hegazy and Abdelmonem for first contact. Egypt also generates threat from set plays. Zizo delivers outswinging corners toward the penalty spot. Salah waits at the top of the box for a second ball. Mostafa Mohamed attacks the near post and creates space for late runners.
Physical data helps forecast intensity. Argentina averages 23.9 kilometers of high speed running per match, third among World Cup teams. Egypt averages 111.4 kilometers of total distance and leads in sprints above 25 kilometers per hour. Egypt records 4.1 fast breaks per game. Argentina allows 8.1 passes per defensive action. Egypt allows 9.4. Both sides regain the ball quickly and are comfortable defending before launching direct attacks.
Squad updates show full availability. Argentina had Lisandro Martínez return to full training after a minor ankle issue. Medical staff cleared him for selection. Egypt replaced a reserve midfielder who sustained a calf injury before the tournament. The starting eleven remains unchanged. The pitch at NRG Stadium uses hybrid grass installed six weeks ago. Ground staff reported excellent condition. The forecast shows 31 degrees Celsius, light wind, and humidity near 52 percent. Conditions allow a high tempo match with proper hydration.
The referee crew is from Germany. The group averages 3.2 yellow cards per match in international play. The lead official applies advantage and communicates clearly. That style benefits teams that move the ball quickly. VAR will review goals, penalties, and possible red card incidents under standard protocol.
Substitutions will matter after the 60th minute. Argentina can introduce Lautaro Martínez for physical presence, Paulo Dybala for creativity between lines, and Exequiel Palacios for midfield control. Egypt can bring Omar Marmoush for pace behind the line, Ramadan Sobhi for dribbling in tight areas, and Emam Ashour for energy and defensive balance. Both managers adjusted systems in prior matches to change results. Scaloni used two strikers against Colombia in the round of 16. Rui Vitória added a midfielder and moved Salah central against Senegal.
Expected goals data reveals a gap in chance creation. Argentina averages 2.04 expected goals for and 0.58 against per match across the last 20 competitive games. Egypt averages 1.31 for and 0.81 against. The numbers show Argentina creates higher quality chances and limits opponents to lower quality shots. Egypt relies on efficiency and set pieces. Goalkeepers could decide the match. Emiliano Martínez saved 3.6 goals above expected in qualifying and the group stage. Mohamed El Shenawy saved 4.1 above expected. Both command the area and distribute accurately.
Recent tournament form adds context. Argentina defeated Canada 3 to 0 and Uruguay 2 to 1 in the opening phase. The team created 6.1 expected goals across both matches and conceded 0.9. Egypt drew 1 to 1 with Belgium and defeated Japan 2 to 0. The team created 2.7 expected goals and conceded 1.8. Argentina showed better control and chance volume. Egypt showed resilience and clinical finishing.
Key matchups will shape the game. Enzo Fernández against Hamdi Fathi is central. If Fernández receives time, Argentina progresses and finds Messi between lines. If Fathi screens passes and forces long balls, Egypt can reset and attack space. Nahuel Molina against Trezeguet is another. Molina must judge when to advance and when to stay. Trezeguet will target space behind him during transitions. On the opposite side, Tagliafico must manage Salah. Tagliafico will get support from Lisandro Martínez and De Paul. The battle tests positioning and recovery speed.
Discipline and game management are important. Argentina averages 11.2 fouls per game and 1.8 yellow cards. Egypt averages 13.6 fouls and 2.1 yellow cards. Late challenges in midfield could lead to dangerous free kicks. Messi and Zizo can convert from those positions. Concentration on second balls after clearances will matter because both teams score from loose balls in the box.
Considering all data, Argentina should control possession and territory for long spells. Egypt should create danger through direct play and set pieces. The side that defends its penalty area with focus and converts its best chance will gain the advantage. A draw remains possible and extra time would favor the bench with greater depth. If a winner emerges in 90 minutes, the margin should be one goal. The decisive moment could come from a free kick, a defensive error in transition, or individual quality from Messi, Salah, Álvarez, or Zizo. Current evidence shows Argentina brings structure, experience, and sustained pressure. Egypt brings organization, speed, and direct threat. The result will reflect execution on the day and adjustments made by both coaching staffs.
repost-content-media
  • Reward
  • Comment
  • Repost
  • Share
#GTBurns2.57MInQ2
The cryptocurrency industry continues to evolve through innovation, ecosystem development, and tokenomics designed to create long-term value for users and investors. One of the latest highlights is the announcement that 2.57 million GT tokens were burned during Q2, marking another significant milestone in the ongoing token burn program. Token burns have become an important mechanism in many blockchain ecosystems, helping manage token supply while demonstrating a project's long-term commitment to sustainable growth.
A token burn permanently removes a certain number of tokens
GT0.44%
  • Reward
  • Comment
  • Repost
  • Share
nice post
HighAmbition
#HYPE
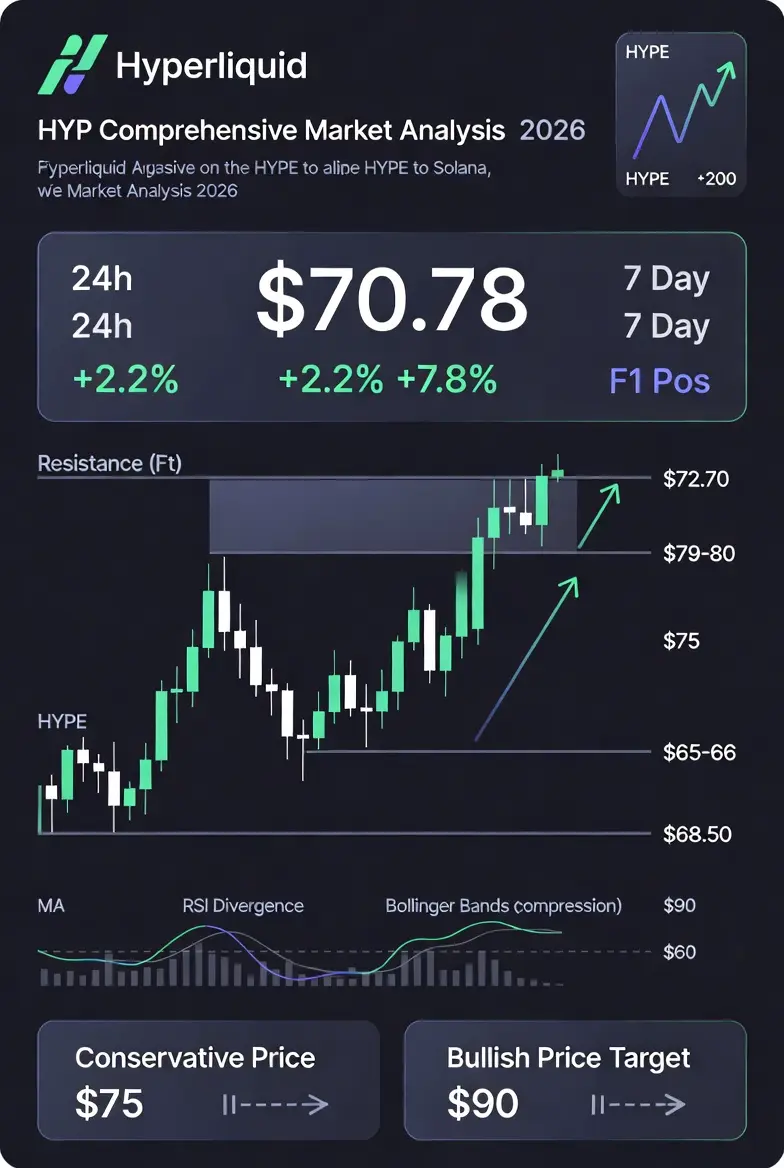
HYPE is trading at approximately $70.78, having successfully rebounded from the critical $60 support level. The token shows strong bullish momentum with a 2.2% daily gain and 7.8% weekly appreciation. After touching $72.70 recently, price has consolidated around current levels, indicating healthy profit-taking before the next potential leg up.
Technical Analysis Overview
The 4-hour and daily charts display bullish alignment with MA7 above MA30 above MA120. However, RSI shows bearish divergence while Williams Percentage Range indicates overbought conditions. Bollinger Band bandwidth has compressed to 13.55%, the lowest in 30 days, signaling imminent volatility expansion and potential breakout.
Critical Price Levels
Immediate support stands at $68.50 with major support at $65.00 and the psychological $60 level. Resistance begins at $72.70, followed by $75.00 and major resistance at $79.00-$80.00. The ultimate bullish target reaches $90.00 based on Fibonacci extensions and market cap projections.
HYPE vs Solana Comparison
Solana currently trades at $81.59 with a $47.41 billion market cap. HYPE's fully diluted valuation has reached $50-$56 billion, remarkably close to Solana despite launching months ago. While Solana offers general-purpose blockchain utility, HYPE specializes in derivatives trading with superior fee accrual to stakers. For HYPE to match Solana's market cap, price would need to reach approximately $220, representing 210% upside potential.
Price Predictions
Conservative 2026 forecasts place HYPE between $57.89 minimum and $79.81 maximum, with average consensus around $66. Short-term targets include $75.00 (6% upside), $79.00 (12% upside), and $90.00 (27% upside). The recent $700 million token unlock was successfully absorbed by market demand, demonstrating strong institutional confidence.
Trading Strategy Framework
Entry Zones: Primary entry at $68.50 (3.2% below current), secondary at $65.00 (8.2% below current).
Stop Loss Levels: SL1 at $68.50 (3.2% risk), SL2 at $65.00 (8.2% risk), SL3 at $59.50 (16% risk below major $60 support).
Take Profit Targets: TP1 at $75.00 (6% gain), TP2 at $79.00 (12% gain), TP3 at $90.00 (27% gain).
Risk Management:Position size should not exceed 5% of portfolio. Use tiered entries: 40% at primary level, 35% at secondary, 25% reserved for opportunistic additions. Maximum leverage 3:1 given 15-20% intraday volatility.
Strategy Variations:
Conservative Approach: Enter at $68.50, stop at $59.50, target $75.00 for 9.5% gain with 16% risk.
Momentum Breakout: Enter above $72.70 with volume confirmation, stop at $70.00 (3.7% risk), targets $75.00, $78.00, $82.00.
Range Trading: Short near $72.00 targeting $68.50, or long at $68.50 targeting $72.00 resistance.
Fundamental Catalysts
Hyperliquid's HIP-3 market bridges traditional finance and DeFi through perpetual futures on oil, gold, S&P 500, and SpaceX-linked contracts, generating $280 million in non-crypto trading volume. Fee-driven tokenomics funnel real protocol revenue to stakers with yields exceeding Solana's liquid staking derivatives. Daily platform volume exceeds $7 billion, confirming institutional adoption and liquidity depth.
HYPE has established a strong foundation above $60 support with technical targets extending toward $75.00, $79.00, and $90.00. While overbought conditions warrant caution, the specialized derivatives focus and superior fee mechanics position HYPE for potential market cap convergence with Solana over 12-18 months. Traders should employ disciplined risk management, monitoring $68.50, $72.70, and $75.00 as immediate inflection points while maintaining appropriate position sizing for this volatile asset.
@Gate_Square
repost-content-media
  • Reward
  • Comment
  • Repost
  • Share
good post
HighAmbition
#DEXE
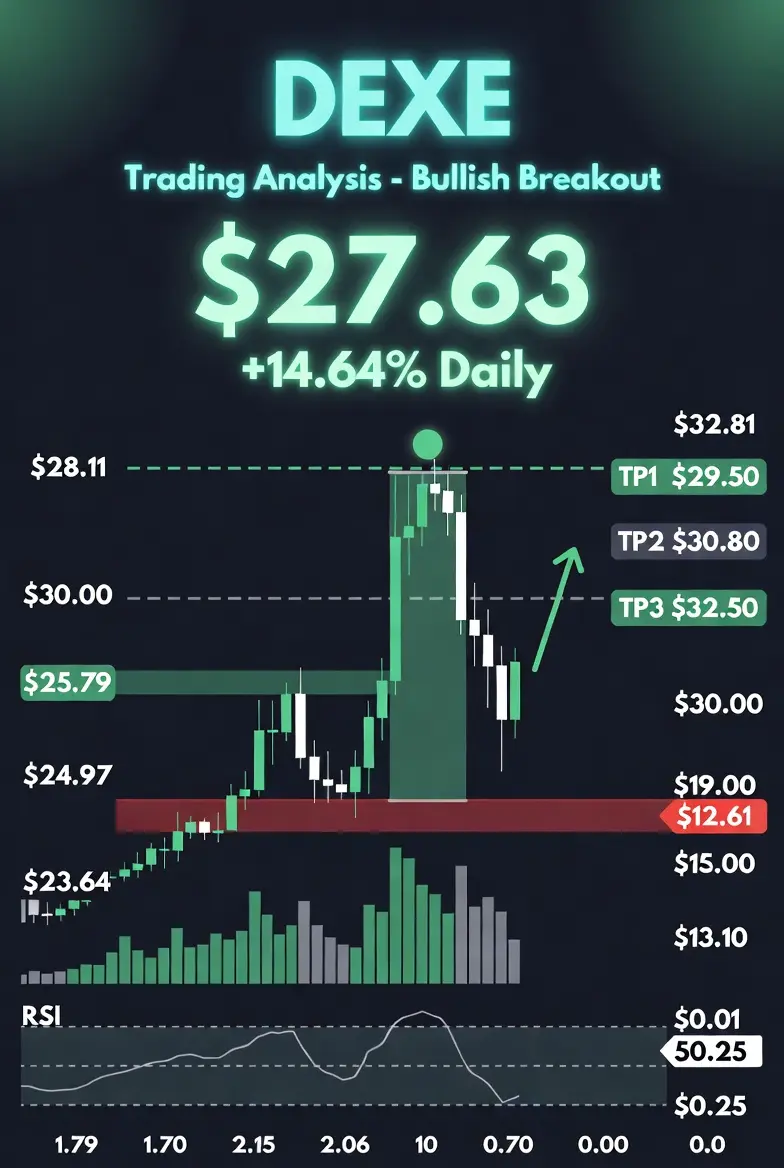
DEXE is trading at $27.632 showing exceptional bullish momentum with a massive 14.64% gain in the latest session. The price has surged from the $24.103 opening level reaching a high of $28.106 with strong volume of 42,587 DEXE tokens traded. This represents a significant breakout above previous resistance zones around $25.00.
Technical Analysis Deep Dive
The 4-hour chart reveals a powerful uptrend structure with multiple bullish confirmations. Price action shows a clear breakout from the $22.00 to $25.00 consolidation range with volume expansion validating the move. The current price structure indicates strong buying pressure with minimal pullback depth suggesting institutional accumulation.
Key Resistance Levels
Immediate resistance sits at $28.106 which is the recent high. Breaking this opens the path to $30.00 psychological resistance followed by the all-time high zone near $32.81. The $30.00 level represents a critical technical target with approximately 8.57% upside potential from current levels.
Critical Support Levels
Primary support is established at $25.789 representing the previous breakout point. Secondary support lies at $24.966 which was the launchpad for the current rally. The major support zone is $23.636 which is the session low and must hold to maintain bullish structure. A break below $23.00 would invalidate the current uptrend.
RSI Analysis
The RSI indicator shows 50.25% bullish probability with balanced momentum. While not in extreme overbought territory the rapid price appreciation suggests caution for fresh entries. The RSI reading indicates room for further upside before reaching overbought conditions above 70.
Strategic Trading Plan
Entry Strategy
Aggressive traders can enter on any pullback toward $26.50 to $27.00 with tight stops. Conservative traders should wait for a confirmed hold above $28.00 before entering long positions. The ideal entry zone is $26.80 to $27.20 for optimal risk-reward.
Stop Loss Levels
SL1 at $25.50 representing 7.7% risk below entry. SL2 at $24.50 covering 10.6% risk for wider stops. SL3 at $23.50 as catastrophic protection at 14.9% risk. Position sizing should never risk more than 2% of portfolio on any single trade.
Take Profit Targets
TP1 at $29.50 offering 6.8% reward from current levels. TP2 at $30.80 providing 11.5% upside potential. TP3 at $32.50 targeting 17.6% gains approaching the historical resistance zone. Scale out 33% at each target level.
Market Sentiment and Fundamentals
DEXE is currently riding the AI token narrative wave with strong on-chain fundamentals showing record whale activity and new wallet growth. The cup-and-handle pattern identified by analysts points to the $30.00 target zone. Institutional interest appears to be increasing based on volume profiles.
Risk Management Framework
Given the 14.64% single-session gain profit-taking pressure is likely at current levels. Traders should avoid FOMO entries and wait for consolidation or pullback entries. The volatility is elevated at 13.14% over 30 days requiring smaller position sizes.
Final Recommendation
DEXE shows strong technical momentum with clear upside targets toward $30.00 and beyond. The breakout above $25.00 is validated by volume expansion. Traders should use disciplined entry strategies with proper stop losses. The risk-reward favors long positions above $26.00 support with targets at $29.50 $30.80 and $32.50. Monitor the $28.00 resistance closely for breakout confirmation or rejection signals.@Gate_Square
repost-content-media
  • Reward
  • 1
  • Repost
  • Share
Vortex_King:
To The Moon 🌕
nice post
HighAmbition
  • Reward
  • 1
  • Repost
  • Share
Vortex_King:
To The Moon 🌕
good post
HighAmbition
#LIT
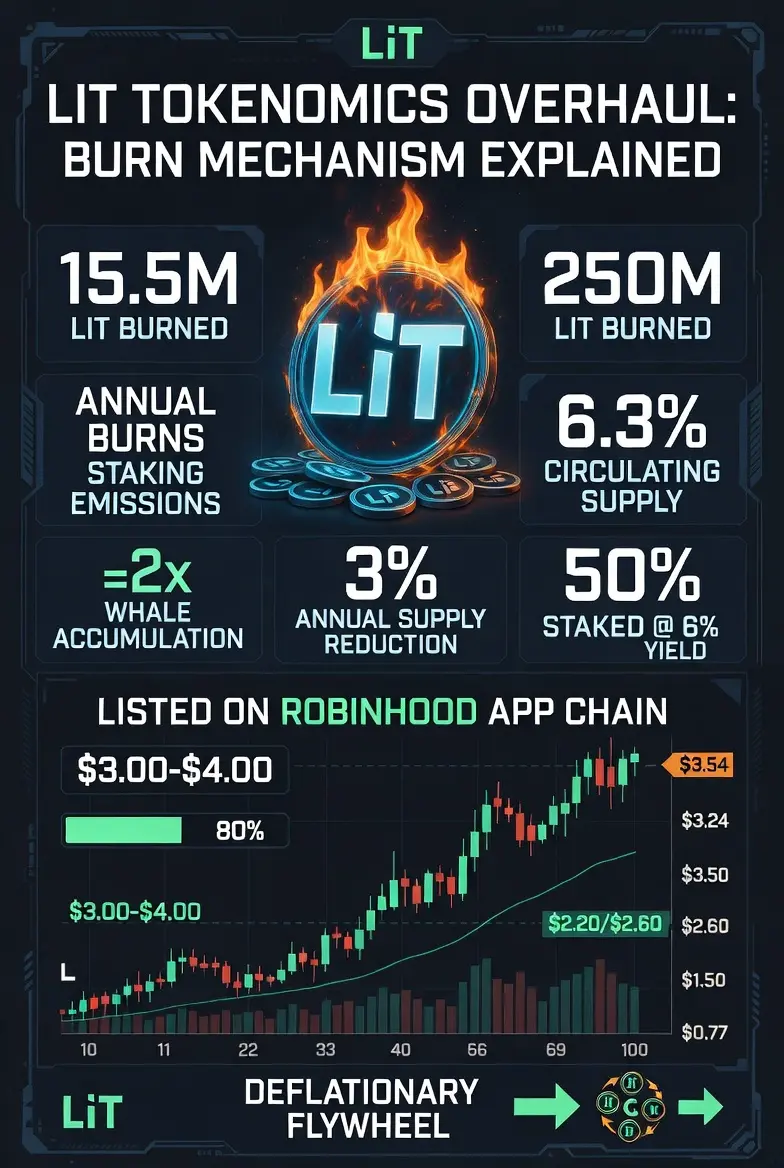
On June 30, 2026, Lighter announced that every LIT token repurchased through exchange revenue will now be permanently burned, moving away from the previous buyback-and-hold treasury model. The first burn targets approximately 15.5 million LIT, roughly 6.3% of the 250 million circulating supply, scheduled within weeks after Q2 closes. These tokens will be sent to a burn address on Ethereum mainnet, representing approximately $39 million in notional value permanently removed from the market at current prices near $2.52. The total max supply is 1 billion LIT, with 50% allocated to the ecosystem reserve. 100% of protocol trading revenue funds continuous buybacks, and at the current revenue run-rate, annual burns are projected to exceed staking emissions by approximately 2 times, creating a deflationary flywheel where more volume generates more revenue, which funds larger burns, which reduce supply, which creates upward price pressure assuming sustained demand.
The staking model adds context. Approximately 125 million LIT is staked, representing 50% of circulating supply, with a 6% annualized yield distributing approximately 7.5 million LIT per year from the 250 million ecosystem reserve. Net supply change is deflationary: approximately 7.5 million added through staking versus approximately 15 million removed through burns, resulting in approximately 3% annual net supply reduction. Compounded over three years, circulating supply would contract from 250 million to approximately 207 million, assuming constant conditions.
PRICE FORECAST AND SCENARIO ANALYSIS
LIT rallied from $0.77 to approximately $2.70, a 250% gain in roughly two weeks. The 24-hour gain is 18% to 22%, 7-day gain exceeds 29%, and 90-day gain reached 141%. The all-time high is $3.24 from TGE in late December 2025.
Three scenarios emerge. Base case: consolidation between $1.50 and $2.50, mean approximately $2.00, as the market waits for burn execution proof. Bullish case: if burn is executed successfully and Robinhood App Chain integration drives volume growth, LIT targets $3.00 to $4.00, with the all-time high at $3.24 as a natural magnet representing approximately 28.6% additional upside from $2.52. A move to $4.00 would represent approximately 58.7% upside. Bearish case: if broader conditions deteriorate or burns are delayed, retreat to $1.20 to $1.50, representing approximately 40% to 52% downside.
WHALE POSITIONING AND SMART MONEY ANALYSIS
The highlighted whale holds a 5x leveraged long with floating profit exceeding $6.7 million. Estimated entry near $1.50 with $1.676 million margin at 5x leverage creates an $8.38 million notional position. Liquidation price at approximately $1.20 provides 52% buffer from current levels. On-chain data reveals a tagged LIT Whale wallet accumulating approximately 749,000 LIT worth approximately $1.77 million through steady ETH swaps across Velora, 0x, and 1inch aggregators, totaling approximately 195 ETH converted into 152,000 LIT in recent clips. Another wallet purchased approximately $729,000 worth of LIT near the $1 support level before the rally began, indicating smart-money positioning started well before the tokenomics announcement.
Community sentiment is overwhelmingly bullish at 80% positive versus 20% negative on X. Social discussion volume surged approximately 133% in the past 3 days. The broader Fear and Greed Index sits at 24 in extreme fear, yet LIT stands as a pocket of strong bullish conviction, suggesting the tokenomics catalyst overrides broader market weakness.
KEY TRADING LEVELS: RESISTANCE, SUPPORT, SL AND TP
Support Levels:
SL1: $2.20 to $2.25 zone. Immediate short-term support. Break below signals momentum loss but does not invalidate bullish structure. Approximately 12.7% downside from $2.52.
SL2: $1.80 to $1.90 zone. Key Fibonacci retracement and accumulation area during the rally from $0.77. Approximately 28.6% downside. Holding this level keeps bullish trend intact.
SL3: $1.20 to $1.35 zone. Critical structural support, previous consolidation range. Approximately 52.4% downside. Break below invalidates bullish thesis and returns to bear case $1.20 to $1.50.
Resistance Levels:
TP1: $2.75 to $2.80 zone. Immediate resistance where LIT recently peaked. Clearing confirms continuation. Approximately 11.1% upside from $2.52.
TP2: $3.20 to $3.24 zone. All-time high area, natural bullish magnet. Approximately 27.4% upside. The 15.5 million burn execution could serve as catalyst.
TP3: $3.80 to $4.00 zone. Extended bullish target requiring deflationary flywheel momentum and Robinhood App Chain volume increase. Approximately 58.7% upside.
TRADING STRATEGY: CHASE OR WAIT
For aggressive traders entering near $2.50 to $2.55 with stop loss at SL1 ($2.20), the risk-reward toward TP2 ($3.24) is approximately 1 to 3, risking 12.7% downside for 27.4% upside. Position size should be 5% to 10% maximum given the 250% two-week volatility.
For conservative traders, ideal entry near SL2 ($1.80 to $1.90) with stop loss at SL3 ($1.20) offers risk-reward of approximately 1 to 3.5 toward TP2 ($3.24), risking 35.1% downside for 73.5% upside. This requires patience and accepts the possibility of missing the trade entirely.
For leverage traders, a 3x to 5x long near SL2 ($1.85) with stop loss at $1.20 provides approximately 50% price buffer. Toward TP2 ($3.24), estimated profit at 3x leverage is approximately 198% on margin, and at 5x approximately 330%. Leverage amplifies both gains and losses — total margin loss occurs if price hits liquidation.
COMMUNITY SENTIMENT DEEP DIVE
Four trader archetypes dominate the discussion. Deflation believers focus on the structural supply reduction, citing the 2 times burn-to-staking ratio as proof of genuine deflation and comparing the Lighter model to Hyperliquid. Momentum traders ride the wave with tight stops targeting the all-time high, arguing that volume surges of 133% to 185% above average confirm real demand. Cautious observers wait for actual burn execution, noting that the first 15.5 million burn has not yet occurred and could trigger buy-the-rumor-sell-the-news dynamics. Whale watchers track the $6.7 million floating profit and 749,000 LIT accumulation as signals of sophisticated conviction with a multi-month thesis.
COULD LIT BECOME THE STRONGEST EXCHANGE ECOSYSTEM TOKEN
The 6.3% initial burn of circulating supply is substantial. The projected 3% net annual deflation rate compounded over three years to approximately 9% cumulative reduction is competitive with or better than most exchange tokens that have inflationary staking models with modest buybacks. The 50% staking rate at 6% yield locks 125 million LIT, meaning only approximately 125 million is available for trading, creating thin effective float that amplifies price movements on demand increases. The Robinhood App Chain integration as official perpetual liquidity provider and tokenized RWA growth at 21.5% of open interest provide additional revenue catalysts.
RISK FACTORS AND FINAL ASSESSMENT
The burn is policy-based rather than fully on-chain automated, relying on team execution and transparency. The first burn has not yet occurred, creating a gap between announcement and execution. The 250 million ecosystem reserve introduces 7.5 million annual staking emission. The broader market Fear and Greed Index at 24 means macro deterioration could pressure LIT despite strong individual catalysts. The 15.5 million initial burn represents only 1.55% of the 1 billion max supply, though 6.3% of circulating supply is the relevant metric. Revenue depends on trading volume which is cyclical. A Uniswap slippage incident on July 7 saw a user lose approximately $2 million on a 1,126 ETH swap for LIT, highlighting DEX liquidity risks for large transactions.
In conclusion, the LIT tokenomics overhaul is genuinely transformative. The 15.5 million initial burn representing 6.3% of circulating supply, the projected 2 times burn-to-staking ratio, and the 50% staking rate creating thin float all support a bullish medium-term thesis. Price targets of $3.24 in the base-to-bullish scenario and $4.00 in the extended scenario are achievable if burn execution succeeds and volume grows. Key levels provide clear risk management with SL1 at $2.20, SL2 at $1.80, SL3 at $1.20, TP1 at $2.80, TP2 at $3.24, and TP3 at $4.00. Whale accumulation confirms smart-money conviction. Monitor the actual burn transaction on Ethereum mainnet as the definitive proof point. Track all developments and trade LIT perpetual contracts on Gate.com with real-time data and advanced order tools.
@Gate_Square
repost-content-media
  • Reward
  • Comment
  • Repost
  • Share
nice post
HighAmbition
#GTBurns2.57MInQ2
GT Q2 2026 Burn Analysis: 2.57 Million GT Permanently Removed as Gate Strengthens Its Long-Term Deflation Strategy
Gate has officially completed its Q2 2026 GT token burn, permanently removing 2,570,063.3829548 GT from circulation through an on-chain transaction. At the current market value, the burned tokens are worth more than $17.75 million, reinforcing one of the cryptocurrency industry's longest-running and most transparent deflationary token models.
What makes this announcement important is not simply the size of the quarterly burn. The real significance lies in the consistency of the program. Since the launch of GT in 2019, Gate has executed quarterly burns without interruption, demonstrating a long-term commitment to reducing supply rather than relying on one-time events. Every burn transaction is recorded on-chain, allowing anyone to independently verify the process through public blockchain records.
Over the past six years, Gate has permanently destroyed 189,947,219 GT, reducing the original supply of 300 million tokens by approximately 63.32%. The cumulative value of all burned tokens now exceeds $1.31 billion, making GT one of the most aggressively deflationary exchange ecosystem tokens in the digital asset industry.
Six Years of Consistent Supply Reduction
Unlike projects that occasionally announce token burns during favorable market conditions, GT follows a structured and transparent quarterly burn mechanism. This consistency has become one of the defining characteristics of the token's economic model.
The latest burn demonstrates that the roadmap continues exactly as planned, with every transaction executed publicly on-chain.
Investors can independently verify the latest burn through Ethereum blockchain records, reinforcing confidence in the transparency of the process.
Rather than focusing on short-term market reactions, the GT burn model gradually decreases available supply over time while supporting the long-term development of the Gate ecosystem.
Current Supply Structure
The supply dynamics of GT remain one of its strongest fundamental characteristics.
Original Total Supply: 300,000,000 GT
Total Burned: 189,947,219 GT
Supply Reduction: 63.32%
Estimated Circulating Supply: approximately 106–110 million GT
Effective Tradable Supply: around 103.6 million GT after accounting for frozen tokens
Current GT Price: $6.80
Estimated Market Capitalization: approximately $720 million
Average Daily Trading Volume: around $2 million
These figures highlight how dramatically the available supply has declined since launch.
Every quarterly burn increases scarcity by permanently removing additional tokens from circulation.
Understanding the Impact of the Latest Burn
The Q2 burn removed 2.57 million GT, representing a meaningful reduction in available supply.
If quarterly burns continue at a similar pace, approximately 10.28 million GT would be removed annually. Based on the current circulating supply, this represents an annual supply reduction approaching 9–10%.
Basic supply-and-demand economics suggest that when supply consistently decreases while demand remains stable or grows, upward pressure on valuation can gradually develop over time. Although burns alone do not determine market prices, they strengthen long-term token economics by reducing future circulating supply.
The latest burn also demonstrates Gate's continued financial commitment, as more than $17.75 million worth of GT has been permanently removed from circulation during this quarter alone.
GT Ecosystem Utility
GT derives value from more than its deflationary model.
Within the Gate ecosystem, GT provides multiple utilities including:
Trading fee discounts
Staking opportunities
Participation in ecosystem products
Access to exclusive launches and campaigns
Additional platform benefits available to GT holders
This combination of real ecosystem utility together with continuous supply reduction creates a stronger long-term economic foundation than supply reduction alone.
Price Performance Analysis
At the time of writing, GT is trading near $6.80.
Historically, GT reached an all-time high of approximately $25.95, meaning the token currently trades significantly below its historical peak.
Current technical structure identifies several important levels:
Resistance Levels
$7.20 – Immediate resistance
$7.80 – Secondary resistance
$8.50 – Major breakout level
$10.00 – Strong psychological resistance
$12.50 – Higher resistance zone
$25.95 – Previous all-time high
Support Levels
$6.50
$6.00
$5.50
$5.00 – Strong long-term psychological support
The area between $6.00 and $7.00 currently represents an important consolidation range where buyers and sellers continue to establish market direction.
Mathematical Supply Projection
If Gate maintains its existing quarterly burn schedule:
Annual burns could total approximately 10.28 million GT
Annual supply reduction may approach 9.6%
Long-term scarcity would continue increasing every quarter
Should ecosystem adoption continue expanding alongside ongoing burns, mathematical supply models indicate that long-term valuation may benefit from decreasing token availability. While future prices cannot be guaranteed, the underlying tokenomics remain supportive of long-term scarcity.
Trading Strategy Considerations
For short-term traders, the current market structure suggests watching the $6.50–$7.20 range carefully.
A confirmed move above $7.20 could open opportunities toward $7.80 and $8.50, while maintaining support above $6.40–$6.50 would help preserve the current bullish structure.
Swing traders may monitor pullbacks toward $6.20–$6.40 as potential accumulation zones while managing risk appropriately.
Long-term investors often prefer gradual accumulation through dollar-cost averaging, particularly when evaluating GT's ongoing deflationary model together with ecosystem expansion.
Proper portfolio diversification and disciplined risk management remain essential regardless of market outlook.
Market Sentiment
Market participants generally view the latest burn positively because it reinforces Gate's commitment to a transparent and predictable token economy.
Experienced investors recognize that consistent quarterly burns strengthen long-term fundamentals, even though short-term price movements remain influenced by broader cryptocurrency market conditions, Bitcoin performance, liquidity, and overall investor sentiment.
The combination of supply reduction and ecosystem utility continues to support GT's long-term investment narrative.
Future Outlook
Several potential scenarios remain possible over the coming quarters.
A conservative outlook places GT within the $9.00–$12.00 range if ecosystem growth continues and market conditions remain supportive.
A stronger cryptocurrency bull cycle could potentially support movement toward the $15.00–$18.00 range.
A highly optimistic scenario would involve a long-term retest of the historical high near $25.95, although achieving that level would require substantial ecosystem expansion, sustained market strength, and continued investor demand.
These scenarios depend on multiple factors including overall cryptocurrency market performance, continued quarterly burns, adoption of Gate products, macroeconomic conditions, and broader digital asset sentiment.
Risks to Consider
Although GT's tokenomics remain attractive, investors should remember that token burns alone do not guarantee price appreciation.
Key considerations include:
Overall cryptocurrency market volatility
Bitcoin price movements
Regulatory developments affecting digital assets
Competition among exchange ecosystem tokens
Liquidity conditions
Investor sentiment across global markets
Careful research, diversification, and disciplined risk management remain important for every investment decision.
Conclusion
Gate's Q2 2026 burn of 2,570,063 GT is another major milestone in one of the cryptocurrency industry's most consistent deflationary programs. Since 2019, nearly 190 million GT have been permanently removed from circulation, reducing the original supply by 63.32% while creating increasing scarcity through transparent on-chain execution.
With GT currently trading around $6.80, investors continue to monitor key resistance levels near $7.20, $8.50, and $10.00, while $6.40–$6.00 remains an important support zone. The combination of continuous quarterly burns, expanding ecosystem utility, transparent blockchain verification, and disciplined tokenomics positions GT as a notable exchange ecosystem asset for long-term market participants.
While future price performance will always depend on broader market conditions and investor demand, Gate's commitment to sustained supply reduction remains one of the strongest fundamental pillars supporting GT's long-term value proposition.@Gate_Square
repost-content-media
  • Reward
  • Comment
  • Repost
  • Share
good Post
HighAmbition
#VitalikUnveilsLeanEthereum
VitalikUnveilsLeanEthereum
Lean Ethereum: Vitalik Buterin's Vision Could Redefine Ethereum's Future
Ethereum is entering what could become its most significant transformation since The Merge. Rather than introducing another routine network upgrade, Vitalik Buterin's Lean Ethereum roadmap presents a long-term vision to simplify Ethereum's architecture while making it faster, more scalable, more secure, and easier to maintain. The proposal combines protocol simplification with advanced cryptography, improved efficiency, enhanced privacy, and stronger scalability, creating a roadmap that extends toward 2030.
Unlike previous upgrades that solved individual bottlenecks, Lean Ethereum attempts to redesign several core components simultaneously. If successfully implemented, it could reshape how Ethereum processes transactions, verifies data, protects users, and competes with both traditional financial infrastructure and high-performance blockchain networks.
Why Lean Ethereum Matters
Ethereum has become the foundation for decentralized finance, tokenized assets, stablecoins, NFTs, gaming, enterprise blockchain solutions, and thousands of decentralized applications. Years of continuous innovation have also increased protocol complexity.
Lean Ethereum focuses on reducing unnecessary technical overhead while preserving decentralization and security. A simpler protocol is expected to improve efficiency, reduce maintenance requirements, lower developer barriers, minimize technical risks, and create a stronger foundation for future innovation.
Rather than continuously adding new layers of complexity, Ethereum aims to modernize its core infrastructure without sacrificing the qualities that made it the leading smart contract ecosystem.
The Five Core Pillars of Lean Ethereum
The roadmap introduces five major technical priorities that together represent one of Ethereum's most ambitious architectural redesigns.
Recursive STARK Verification
Today's Ethereum requires validators to repeat transaction computations before confirming blocks. Lean Ethereum proposes replacing much of this repeated computation with recursive STARK proofs, allowing validators to verify compact mathematical proofs instead of executing every calculation repeatedly.
This approach offers several potential benefits:
Higher transaction throughput
Lower computational requirements
Improved scalability
Better decentralization efficiency
Reduced verification costs
Certain applications could eventually experience transaction cost reductions of up to 10x, although implementation will occur gradually over several years.
Post-Quantum Security
Quantum computing is becoming an increasingly important consideration for long-term blockchain security.
Lean Ethereum plans to integrate post-quantum cryptography, including advanced hash-based signature systems and modern zero-knowledge proof technologies, with major milestones expected before 2029.
Instead of treating stronger security as a trade-off against performance, Ethereum aims to improve both simultaneously, creating a more resilient blockchain capable of defending against future cryptographic threats.
Native Privacy
Transparency remains one of Ethereum's greatest strengths, but institutional adoption increasingly requires practical privacy solutions.
Lean Ethereum explores integrating privacy directly into the protocol instead of relying entirely on external privacy applications.
Native privacy could significantly improve Ethereum's appeal for:
Financial institutions
Enterprise blockchain applications
Corporate treasury operations
Asset tokenization
Large-scale commercial transactions
This evolution supports Ethereum's long-term objective of becoming global financial infrastructure.
Multidimensional Gas Pricing
Ethereum currently prices different network resources using a relatively unified gas system.
Lean Ethereum introduces multidimensional gas pricing, allowing computation, storage, and data availability to be priced independently.
Potential advantages include:
Lower congestion
More efficient resource allocation
Fairer transaction costs
Better scalability
Improved user experience
Combined with faster transaction finality, this could strengthen Ethereum's competitiveness as blockchain adoption accelerates worldwide.
Simplified State Architecture
The roadmap also proposes restructuring Ethereum's state architecture to improve long-term scalability while making the protocol easier to maintain.
Reducing unnecessary complexity helps developers contribute more efficiently and lowers the cost of future protocol upgrades.
Ethereum Foundation's Long-Term Strategy
Supporting this technical transformation, the Ethereum Foundation plans significant operational adjustments.
The organization intends to reduce spending from approximately 15% of treasury assets annually toward 5% by 2030, while implementing nearly a 40% budget reduction to strengthen long-term sustainability.
These changes reflect a broader commitment to responsible ecosystem development rather than rapid short-term expansion.
Ethereum Market Performance
Ethereum is currently trading around $1,795, showing a strong recovery from recent lows near $1,500.
Despite remaining approximately 65% below previous cycle highs around $5,100, Ethereum continues demonstrating resilient buying interest supported by institutional accumulation and positive long-term sentiment.
Current technical structure remains constructive as investors evaluate the long-term implications of Lean Ethereum.
Technical Analysis
Major Resistance Levels
$1,865 – Immediate resistance
$2,000 – Psychological resistance
$2,350-$2,400 – Major supply zone
$2,750 – Long-term resistance
$5,100 – Previous cycle high
Important Support Levels
$1,700
$1,500
$1,400
$1,000 – Major long-term support
A sustained move above $1,865 would strengthen bullish momentum toward $2,000, while maintaining support above $1,700 keeps the current recovery structure intact.
Institutional Accumulation
Institutional participation continues expanding despite broader market volatility.
Corporate Ethereum treasury holders now control millions of ETH, reflecting confidence in Ethereum's long-term ecosystem.
Large organizations including SharpLink and Bitmine Immersion have accumulated substantial Ethereum reserves, while blockchain analytics continue showing consistent whale accumulation across major wallets.
Recent on-chain activity indicates:
Large wallets increasing holdings
Corporate treasury expansion
Continued institutional accumulation
Strong long-term conviction despite market fluctuations
This growing institutional participation supports Ethereum's long-term investment narrative.
Seven-Day Outlook
Bullish Scenario
If Ethereum successfully breaks above $1,865, momentum could extend toward $2,000-$2,100, representing gains of approximately 12% to 17% from current prices.
Neutral Scenario
Ethereum may continue consolidating between $1,750 and $1,900, allowing investors to accumulate while markets digest Lean Ethereum developments.
Bearish Scenario
Broader market weakness could temporarily revisit $1,650-$1,700, although strong institutional demand may limit deeper downside under stable market conditions.
Trading Strategy
Short-Term Traders
Potential accumulation zone:
$1,760-$1,800
Profit targets:
$1,865
$2,000
$2,350
Risk management may include monitoring support below $1,700.
Swing Traders
Accumulation during pullbacks while gradually reducing exposure near major resistance levels may provide balanced risk management.
Long-Term Investors
Lean Ethereum remains a multi-year roadmap extending toward 2030.
Dollar-cost averaging may allow investors to participate gradually while Ethereum implements recursive STARK verification, post-quantum cryptography, multidimensional gas pricing, and protocol simplification over time.
Long-Term Price Outlook
Several scenarios remain possible if implementation progresses successfully.
Conservative Scenario
$2,500-$3,500
Supported by continued ecosystem growth and improving market conditions.
Moderate Bullish Scenario
$4,500-$6,000
Driven by stronger institutional adoption, expanding tokenization, and successful protocol implementation.
Strong Bullish Scenario
$7,500-$10,000
Supported by broader cryptocurrency market expansion, successful Lean Ethereum deployment, increasing enterprise adoption, and continued leadership in decentralized finance.
These projections depend on macroeconomic conditions, institutional participation, successful roadmap execution, developer adoption, and overall cryptocurrency market sentiment.
Despite its strong vision, Lean Ethereum also faces meaningful challenges.
Key risks include:
Multi-year implementation timeline
Engineering complexity
Competition from high-performance blockchains
Regulatory developments
Broader cryptocurrency market volatility
Delays in protocol upgrades
History demonstrates that Ethereum upgrades often require patience before delivering their full economic impact.
Final Thoughts
Lean Ethereum is far more than another network upgrade. It represents a comprehensive redesign of Ethereum's long-term architecture, combining recursive STARK verification, post-quantum security, native privacy, multidimensional gas pricing, protocol simplification, and improved scalability into one unified vision.
With ETH currently trading near $1,795, markets are beginning to evaluate the long-term implications of this roadmap. While short-term price movements will continue responding to broader market conditions, the combination of technical innovation, institutional accumulation, developer activity, and ecosystem maturity strengthens Ethereum's position for the years ahead.
If Lean Ethereum delivers its objectives over the coming decade, it may not simply improve Ethereum—it could redefine the standards for scalability, security, simplicity, and institutional readiness across the entire blockchain industry, reinforcing Ethereum's leadership as the foundation of the next generation of decentralized finance, digital assets, and global Web3 infrastructure.@Gate_Square
repost-content-media
  • Reward
  • Comment
  • Repost
  • Share
#StrategySells3588BTC
The cryptocurrency market is once again in the spotlight following reports that Strategy has sold 3,588 BTC, a move that has sparked widespread discussion among investors, traders, and market analysts. Whenever a company known for holding a significant amount of Bitcoin adjusts its position, the news naturally attracts attention because large transactions can influence market sentiment and fuel speculation about the future direction of digital assets.
Bitcoin has long been recognized as the leading cryptocurrency, often viewed as digital gold due to its limited supply an
BTC0.63%
  • Reward
  • 5
  • Repost
  • Share
Vortex_King:
good 👍
View More
#PredictWorldCup🇦🇷vs🇪🇬
Football fans around the world are eagerly anticipating the exciting World Cup clash between Argentina 🇦🇷 and Egypt 🇪🇬. This matchup brings together two talented teams with different playing styles, making it one of the most intriguing fixtures of the tournament. Whether you're supporting the reigning giants or cheering for the underdogs, this is a match that promises excitement from the opening whistle to the final minute.
Argentina enters the contest with a reputation for technical brilliance, creative midfield play, and clinical finishing. Their ability to do
  • Reward
  • 2
  • Repost
  • Share
Vortex_King:
2026 GOGOGO 👊
View More
#GUSDYieldRisesto3.8%
The digital asset industry continues to evolve at an incredible pace, offering users new opportunities to grow their holdings while maintaining flexibility and accessibility. One of the latest developments attracting attention is the increase in GUSD yield to 3.8% APR. This update reflects the growing competition among digital asset platforms to provide better earning opportunities for users who prefer stable and relatively predictable returns over highly volatile investments.
Stablecoins have become an essential part of the cryptocurrency ecosystem. Unlike many cryptocu
GUSD-0.06%
BTC0.63%
ETH0.49%
  • Reward
  • 2
  • Repost
  • Share
Vortex_King:
2026 GOGOGO 👊
View More
#SKHynixListsOnNasdaq
Global financial markets continue to evolve as technology companies seek broader access to international investors and deeper capital markets. The news surrounding SK Hynix and a potential Nasdaq listing has generated significant discussion among investors, semiconductor analysts, and technology enthusiasts. A development of this scale highlights the increasing globalization of capital markets and the strategic importance of the semiconductor industry in powering artificial intelligence, cloud computing, consumer electronics, automotive technology, and next-generation di
  • Reward
  • 3
  • Repost
  • Share
Vortex_King:
2026 GOGOGO 👊
View More
#TradFiCFDGoldMasters
Financial markets are evolving at an unprecedented pace, giving traders access to a wider range of instruments than ever before. Among the most popular opportunities available today is Gold Contract for Difference (CFD) trading, where investors can speculate on the price movement of gold without owning the physical metal. As technology continues to bridge traditional finance (TradFi) and modern digital trading platforms, gold CFDs have become an increasingly attractive choice for traders seeking flexibility, liquidity, and exposure to one of the world's most valuable ass
  • Reward
  • 3
  • Repost
  • Share
Vortex_King:
LFG 🔥
View More
#GoldTops4200
Gold has once again captured the attention of global financial markets as the precious metal reaches the remarkable milestone of 4,200. This achievement is more than just another price level—it reflects the growing demand for safe-haven assets during a period of economic uncertainty, shifting monetary policy expectations, geopolitical developments, and changing investor sentiment. Whether viewed as a store of value, a hedge against inflation, or a portfolio diversification tool, gold continues to demonstrate why it has remained one of the world's most trusted assets for centurie
XAU-0.07%
  • Reward
  • 4
  • Repost
  • Share
Vortex_King:
2026 GOGOGO 👊
View More
  • Pinned