Mihirr

vip
Age 1.3 Year
Peak Tier 0
No content yet
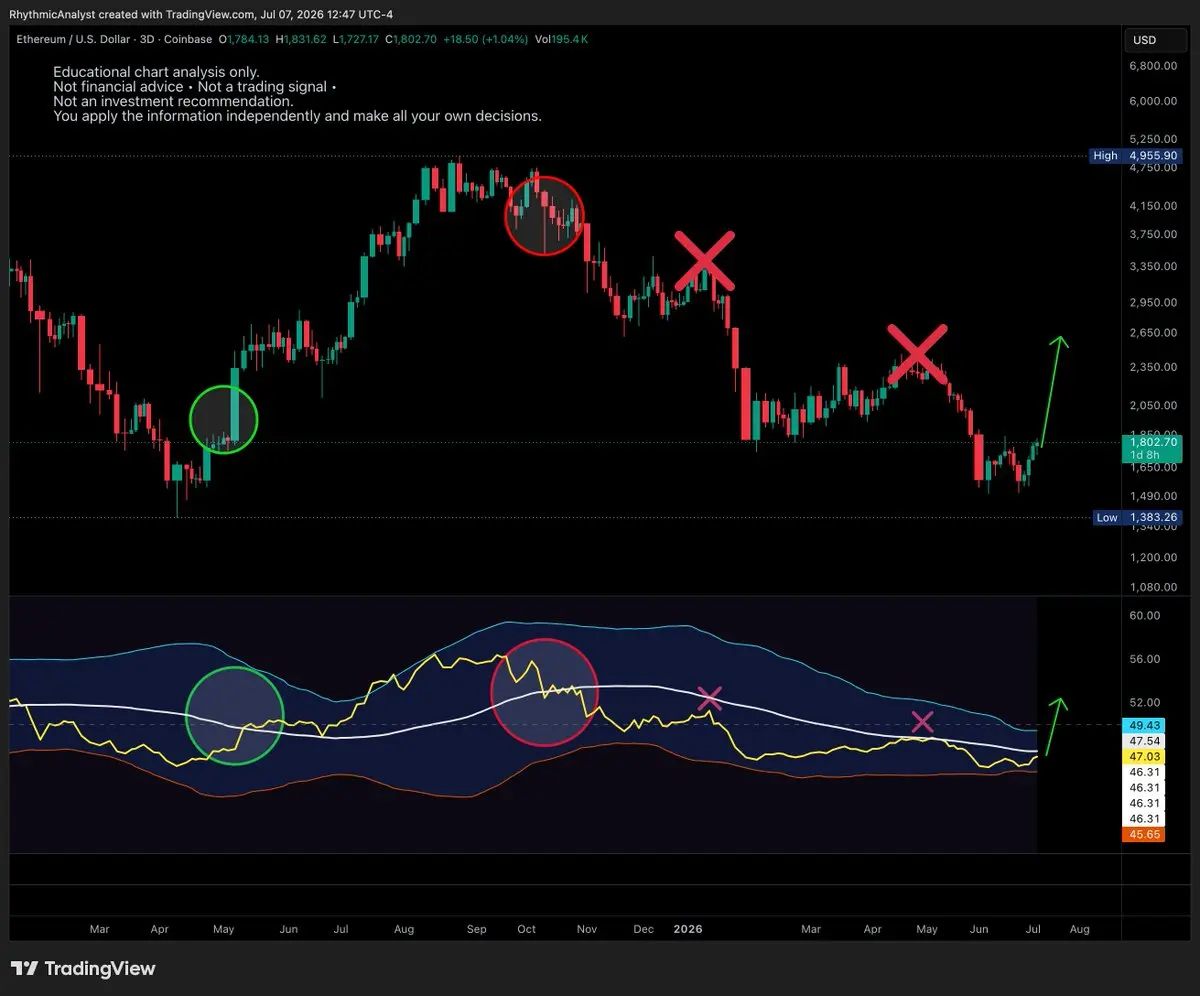
ETH is indicating a bottom at $1800.
You may zoom in the chart and refer price chart and oscillator drawings - it captured last 14 months of price action with high accuracy.
#Ethereum $ETH #ETH #Crypto
ETH0.52%
post-image
  • Reward
  • Comment
  • Repost
  • Share
bitcoin:native turned green. It absorbed Saylor's sell off news.
Back to $63k+
BTC0.46%
  • Reward
  • Comment
  • Repost
  • Share
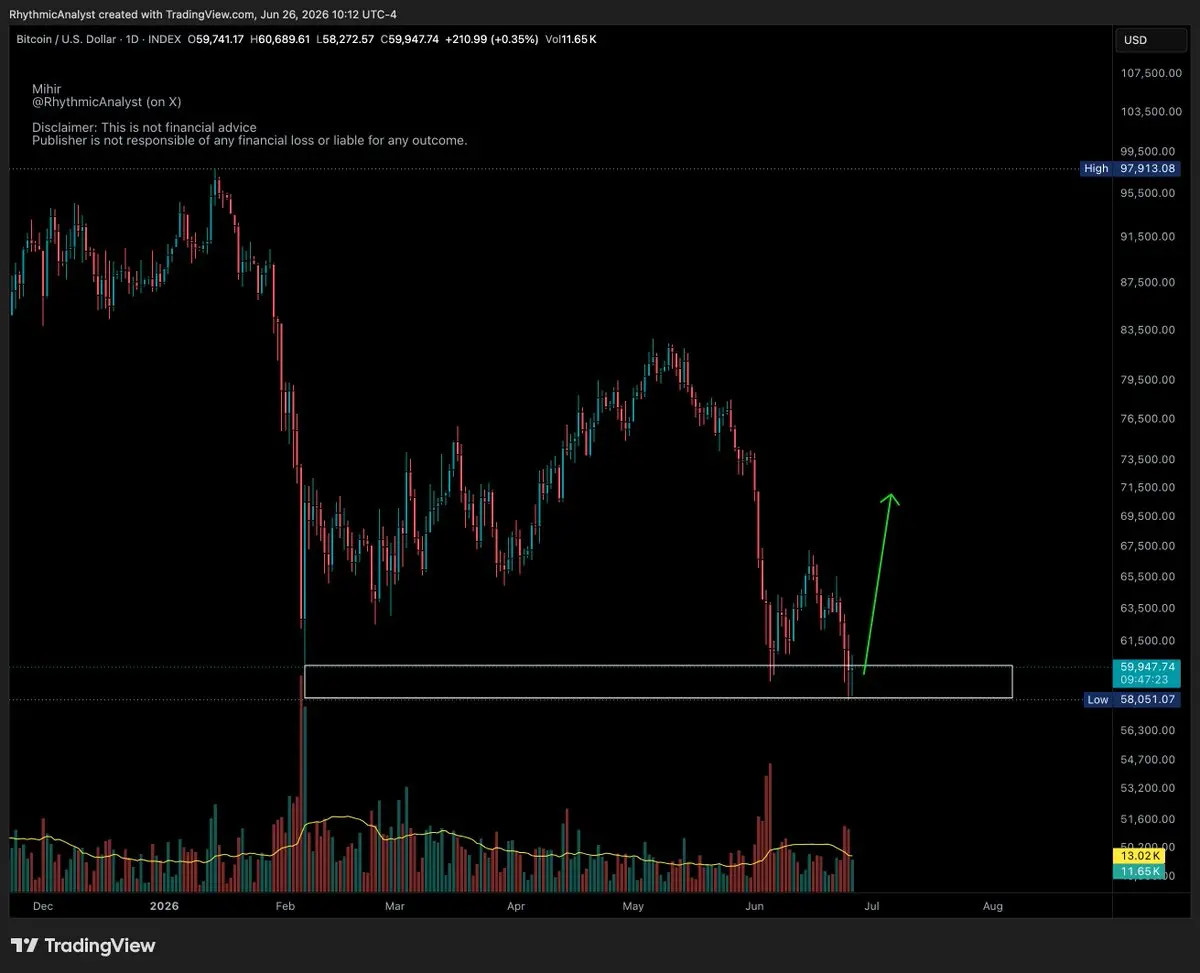
Why isn't the $60k support broken for BTC?
Weekly close hit $59,500 — still in the $60k zone.
The $58k wick could be from high-leverage long liquidations intra-week near the support zone.
Weekly closes & volume matter. That's why $60k held up.
#Bitcoin $BTC #Crypto
BTC0.42%
  • Reward
  • Comment
  • Repost
  • Share
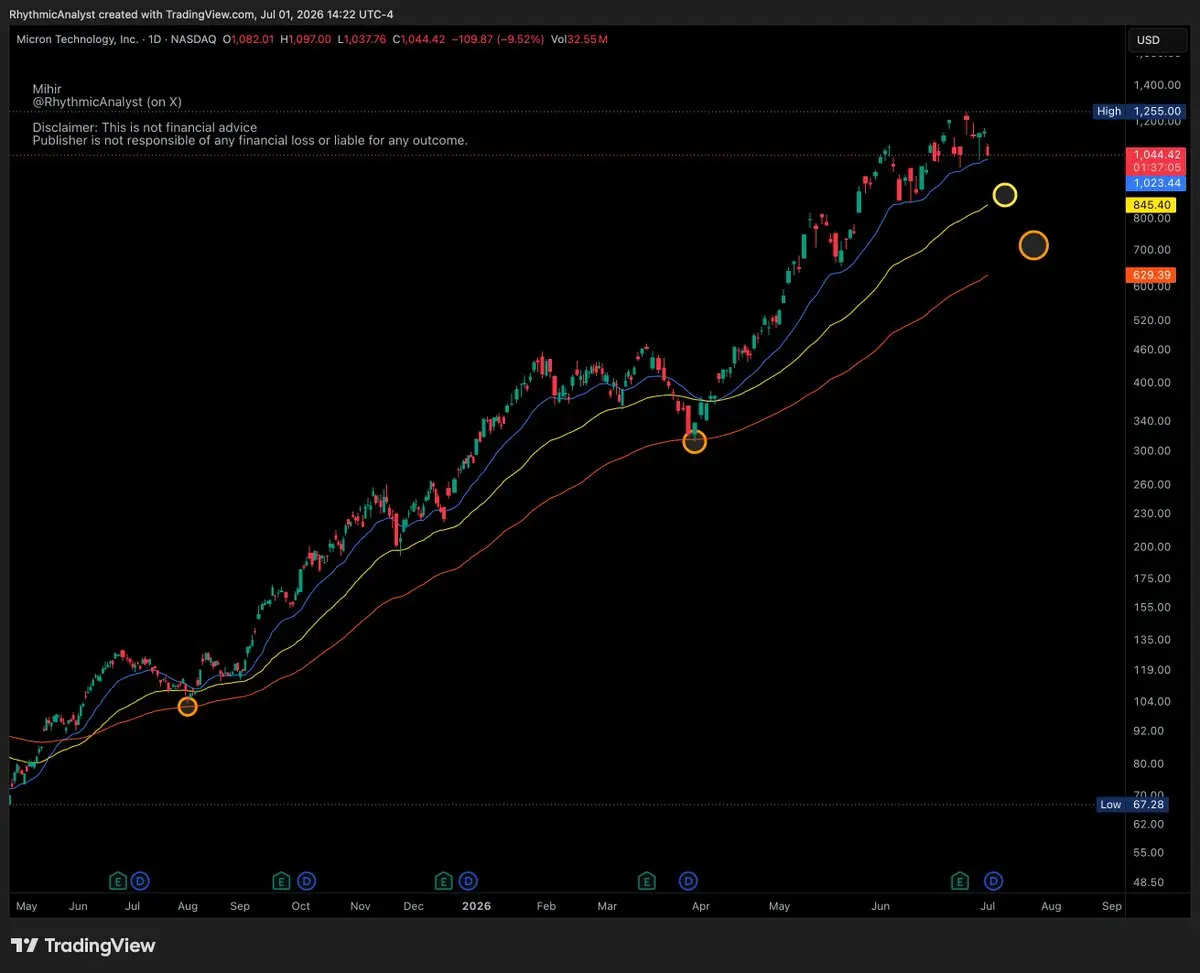
Trump praised Micron when it is showing weakness.
Refer the yellow and orange lines if it breaks the blue.
$MU #Micron #Stocks
post-image
  • Reward
  • Comment
  • Repost
  • Share
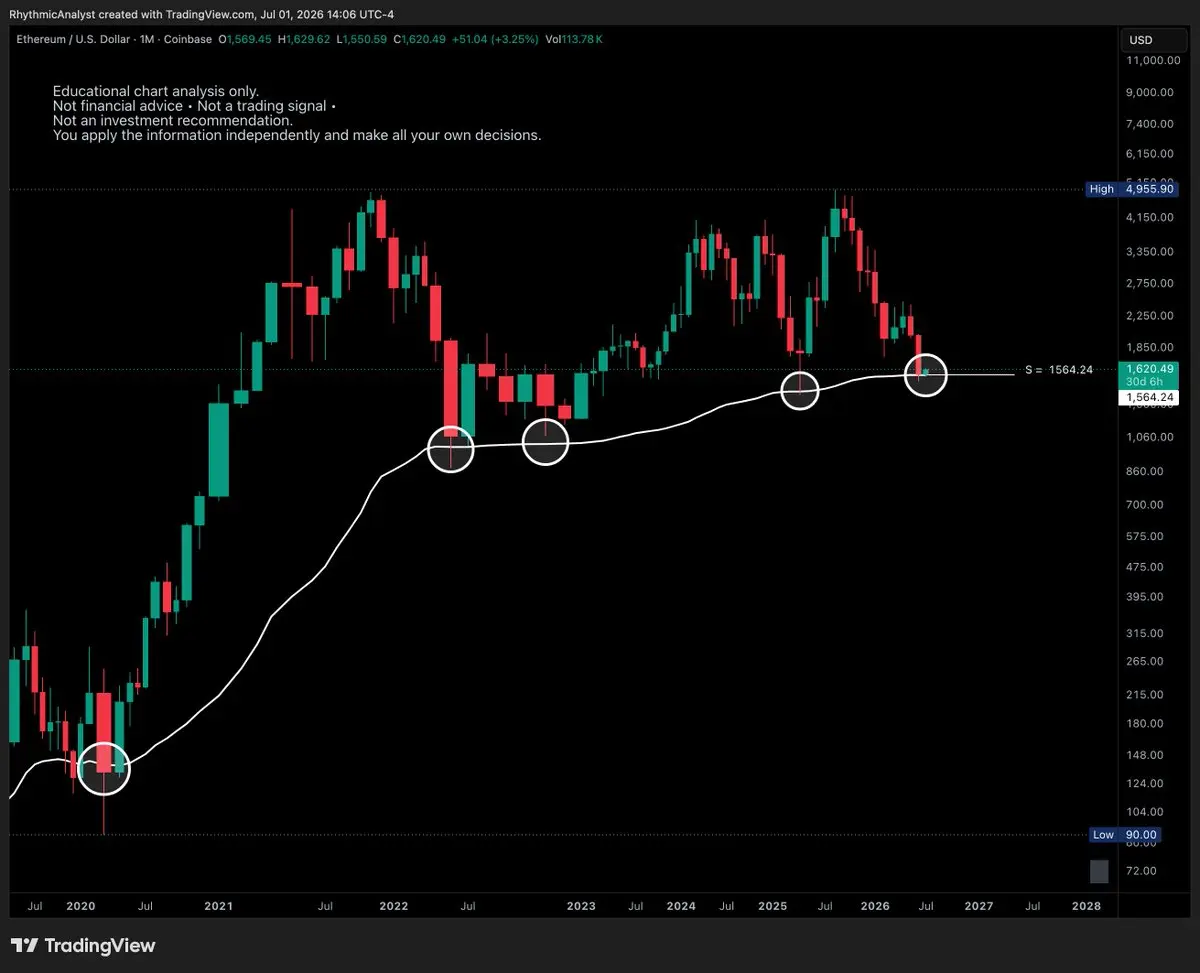
I got more clarity when analyzed ETH from Dec 2018.
Refer those white circles - they are perfectly aligned.
I know, there is no ROI in last 5 years. However, its structure is clearly visible in this view.
$ETH #ETH #Ethereum #Crypto
ETH0.52%
post-image
  • Reward
  • Comment
  • Repost
  • Share
A gentle reminder, BTC is still at $60k.
BTC0.46%
  • Reward
  • 1
  • Repost
  • Share
MSTR Monthly Chart Analysis
The stock price of MicroStrategy (MSTR) has maintained a long-term upward trend since 2012 on the monthly timeframe [highlighted by the green circle].
There have been two notable occasions when the price tested the S3 support level — in 2020 and 2022 [marked by the white circles].
The price has now returned to this same major support zone.
Will the support hold this time?
$MSTR #Saylor
  • Reward
  • Comment
  • Repost
  • Share
No complex post / analysis - only one green arrow.
You my disagree.
#BTC $BTC #Bitcoin #Crypto
BTC0.46%
post-image
  • Reward
  • Comment
  • Repost
  • Share
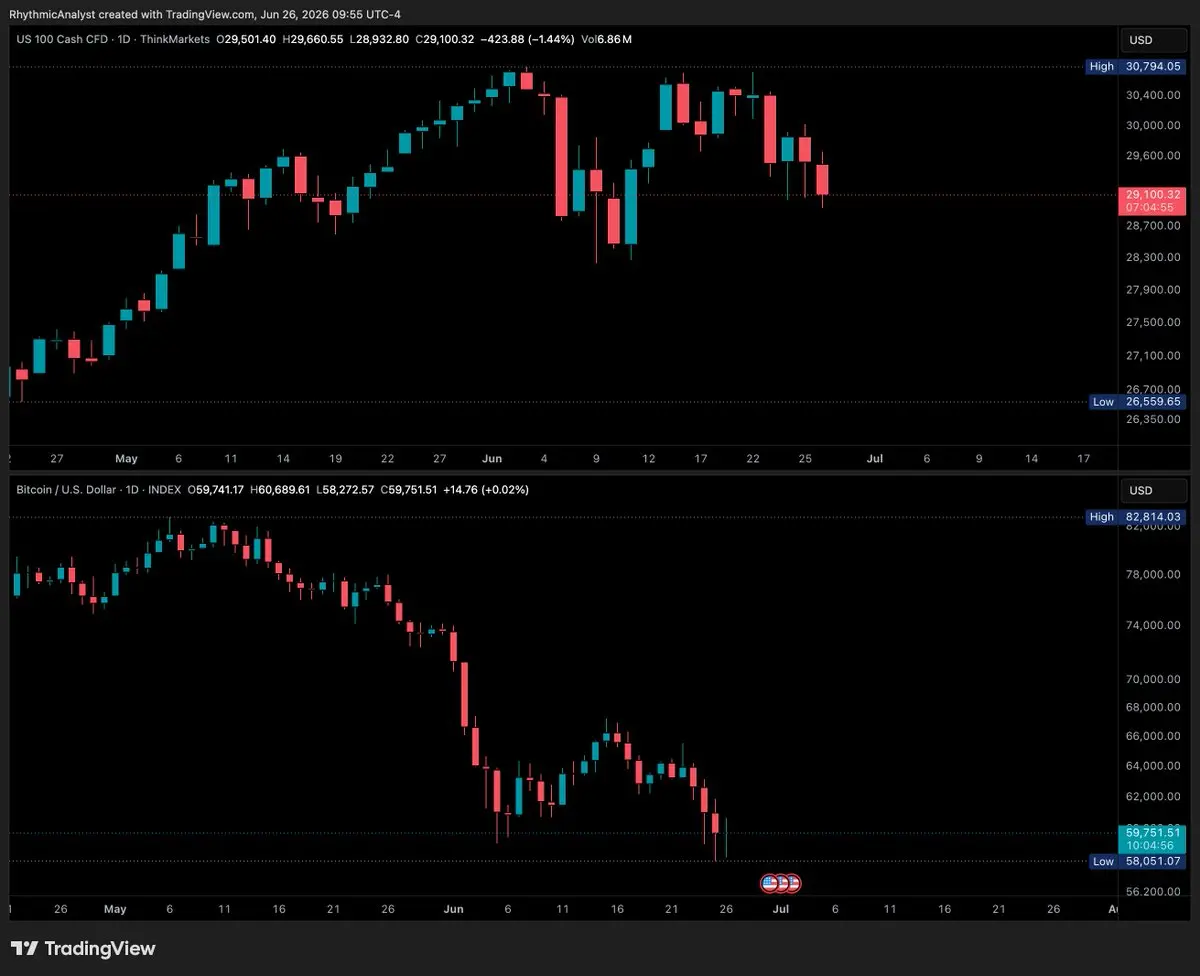
I see a possibility of liquidity moving from stocks into crypto.
The upper chart is the Nasdaq index, which primarily consists of tech stocks. The lower chart is BTC.
They’re showing an almost perfect mirror image — as if liquidity was sucked out of BTC into the stock market.
Let’s see if it flips.
#Crypto #BTC $BTC #Bitcoin #Stocks #NASDAQ
BTC0.46%
post-image
  • Reward
  • Comment
  • Repost
  • Share
S&P 500 supports are at 2900 and 2290.

I could give a closer support level, but I have deliberately ignored it.
#SPX
SPX500-0.25%
SPX0.59%
  • Reward
  • Comment
  • Repost
  • Share
The S&P 500 Index has gone parabolic. It is unlikely to be sustained for long.
#SP500 #SPX
SPX500-0.25%
SPX0.59%
  • Reward
  • Comment
  • Repost
  • Share
👀
NVIDIA has gained over 4200x since the dot-com bubble crash.
On the quarterly chart, price has now hit resistance near $236 and volume has declined.
There has been no pullback yet, although the first signs of weakness are appearing on a monthly timeframe.
[A new high would invalidate the current observation.]
$NVDA #NVidia #AI #Stocks #US
  • Reward
  • Comment
  • Repost
  • Share
Microsoft has delivered roughly 50x returns since the 2008 financial crisis.
On the quarterly timeframe, however, the stock is currently facing resistance and showing signs of weakness.
In this analysis, the $340 level stands out as a key support zone.
$MSFT #Microsoft #Stocks
  • Reward
  • Comment
  • Repost
  • Share
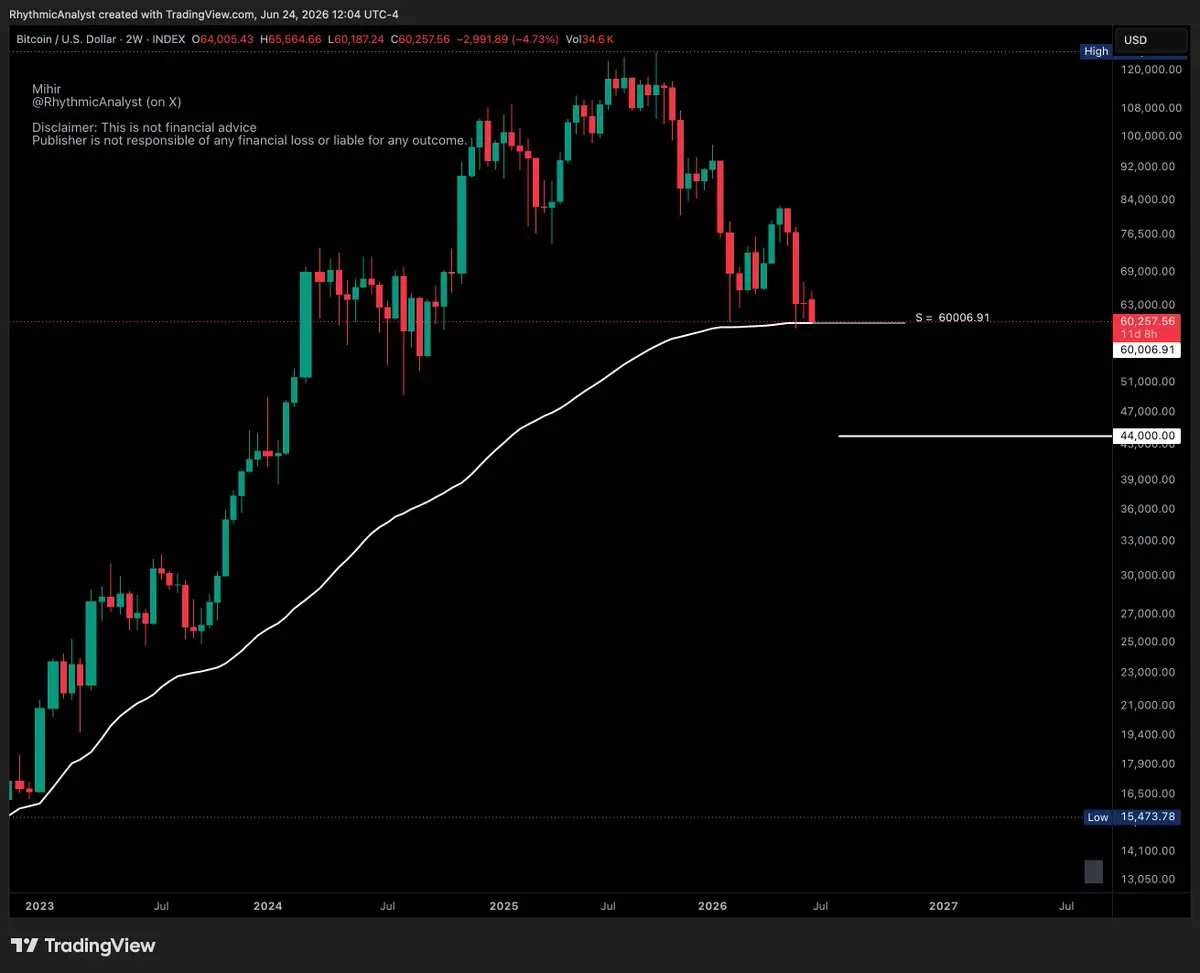
BTC is weak but still hasn’t broken support. Let’s keep it simple.
BTC0.46%
post-image
  • Reward
  • Comment
  • Repost
  • Share
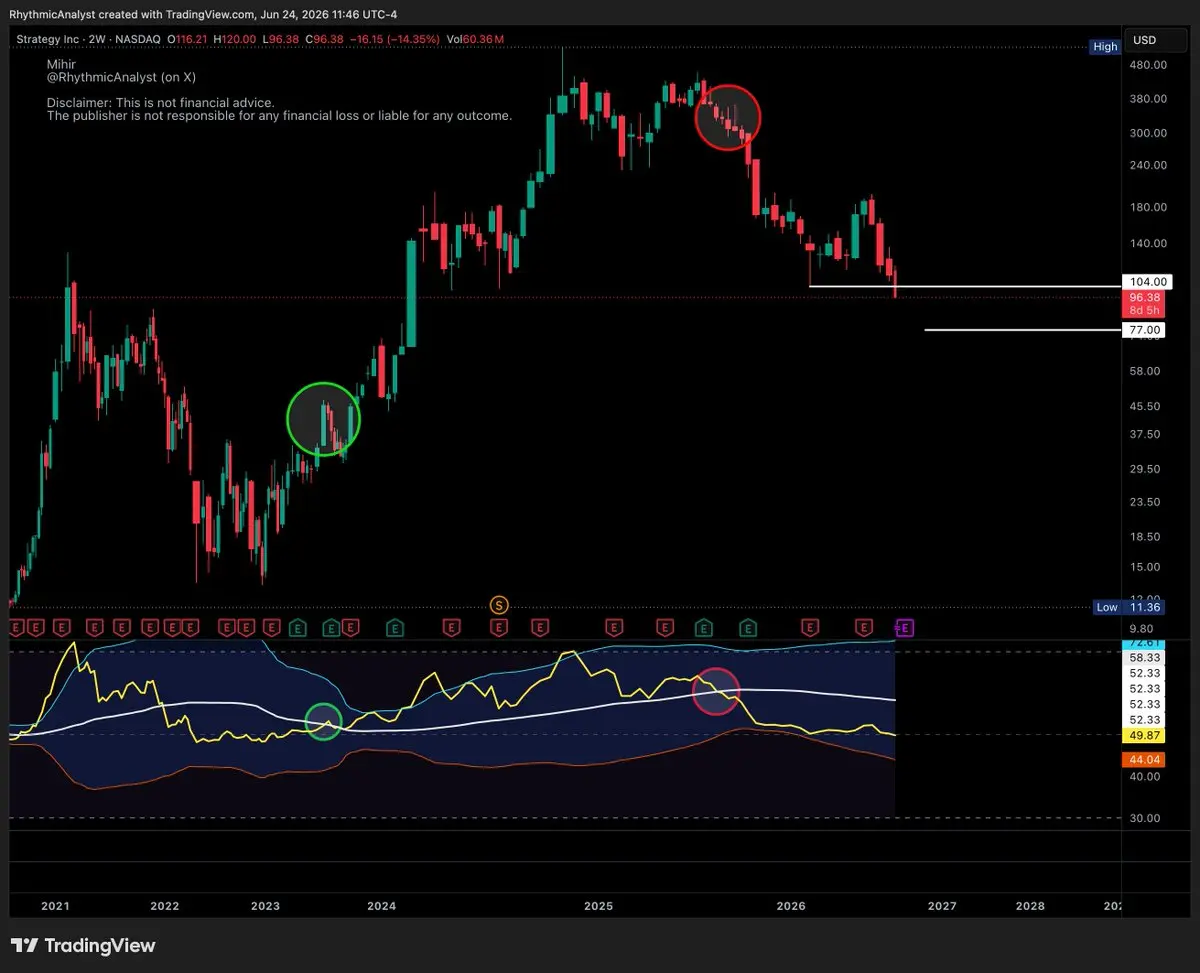
MSTR (Strategy Inc.) has crossed $104 support after defending it for 4 months. A further breakdown would be confirmed if price stays below this level.
[The oscillator had already indicated its early breakdown near $330; the red circle].
#Saylor #MSTR $MSTR
post-image
  • Reward
  • Comment
  • Repost
  • Share
Knowing support is important — not the outcome.
In reality, it’s not possible to predict outcomes with certainty, and trying to do so at every price level is impossible. That’s where the importance of support comes in.
Support level offers a clear boundary at a specific price range. Accumulation and distribution often happen near support zones.
Once a support zone is identified, a bounce can offer opportunity while a breakdown signals increased risk.
That’s why knowing the support zone is critical — not the outcome, which is observed rather than predicted.
  • Reward
  • Comment
  • Repost
  • Share
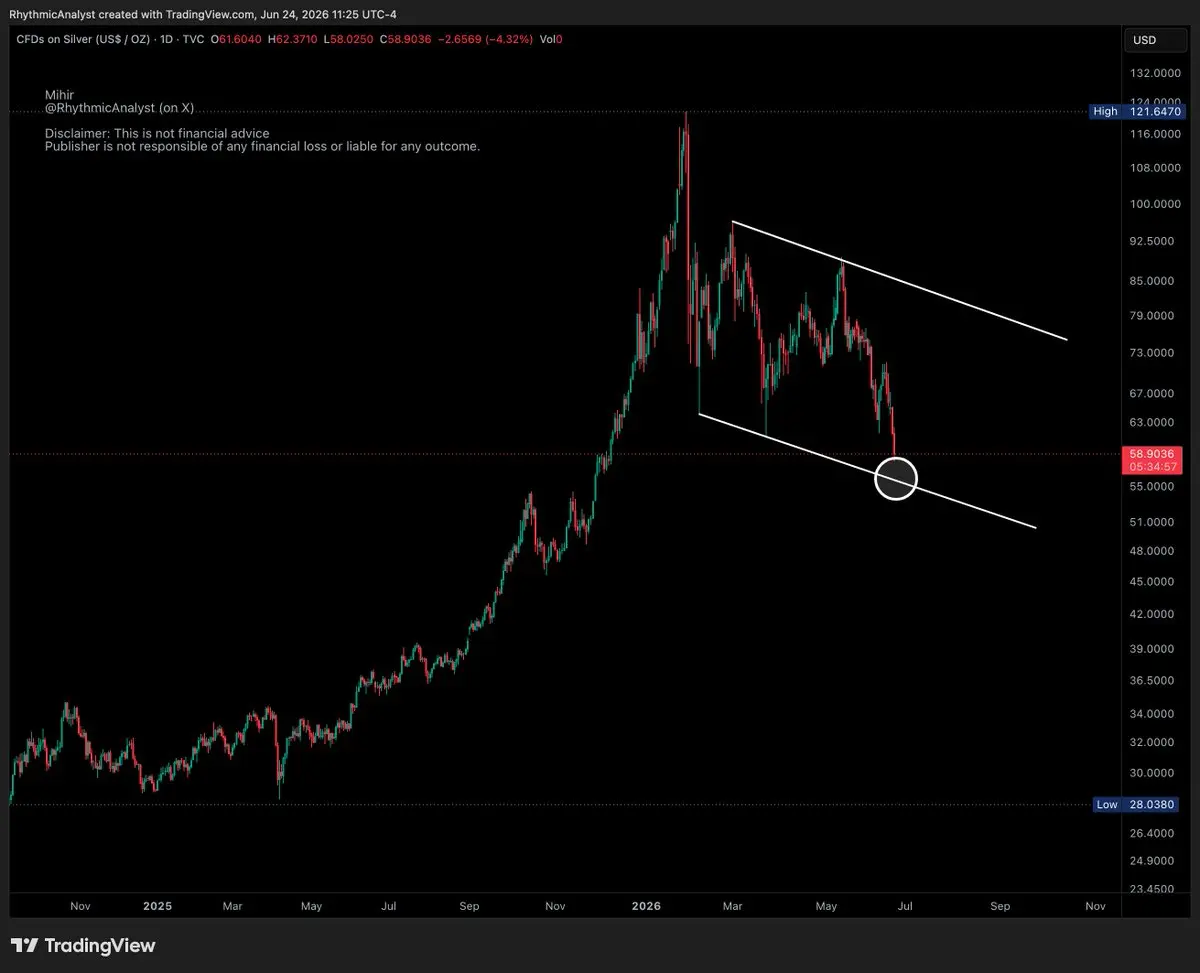
This is a simple channel-based analysis for Silver.
We'll see how price reacts near the white circle around $55.
XAG-2.31%
post-image
  • Reward
  • Comment
  • Repost
  • Share
  • Pinned