币小仙韩信

vip
Active for: 2.1y
Peak Tier 0
Once there was the legendary general Han Xin, now there is the crypto little legend Han Xin! The market is like a battlefield; it needs formations, and it also needs tactics! Randomly swinging your sword without a plan will only cause your pockets to shrink and shrink again!
BANK’s 4-hour structure is still relatively bullish, but it has shifted from the strong upswing phase into a high-level consolidation phase with profit-taking digestion. The order book price is around 0.412, which is in a short-term long-versus-short battle zone.
The moving average alignment remains in a bullish configuration: EMA5 > EMA10 > EMA20 > EMA120. This indicates that the current price is still clearly above the long-term cost line in the short to medium term, and the trend has not been broken.
RSI6 is 72.33, RSI12 is 70.12, both already in an overheated area; RSI24 is 66.47, showing
View Original
post-image
  • Reward
  • 6
  • 1
  • Share
MrDhrubo830:
Great breakdown! A healthy pullback before the next leg up wouldn't be surprising. 💪
View More
Although EUL has shown a hammer candle pattern, hinting at a possible reversal, the trading volume has shrunk significantly, creating a clear contradiction with the market’s fear-driven sentiment state, indicating weakening bullish strength.
In terms of the external environment, the U.S. Dollar Index remains high and Treasury yields are stable, further reducing the market’s preference for risk assets, which may lead to capital outflows.
EUL-27.24%
USIDX-0.19%
View Original
post-image
  • Reward
  • Comment
  • Repost
  • Share
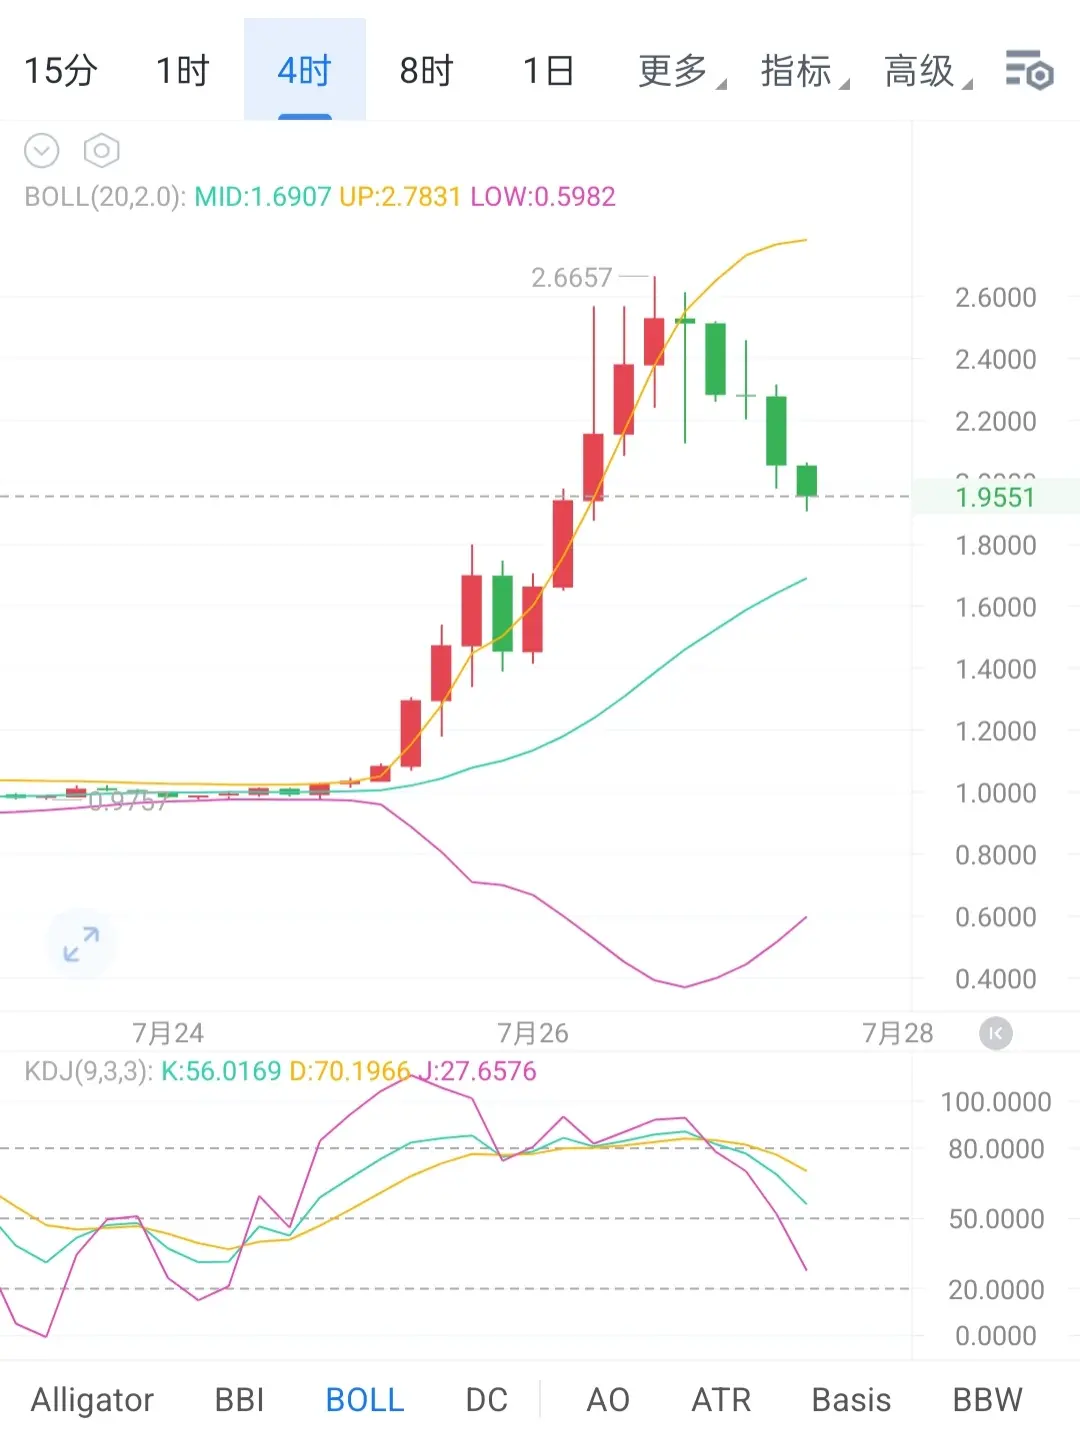
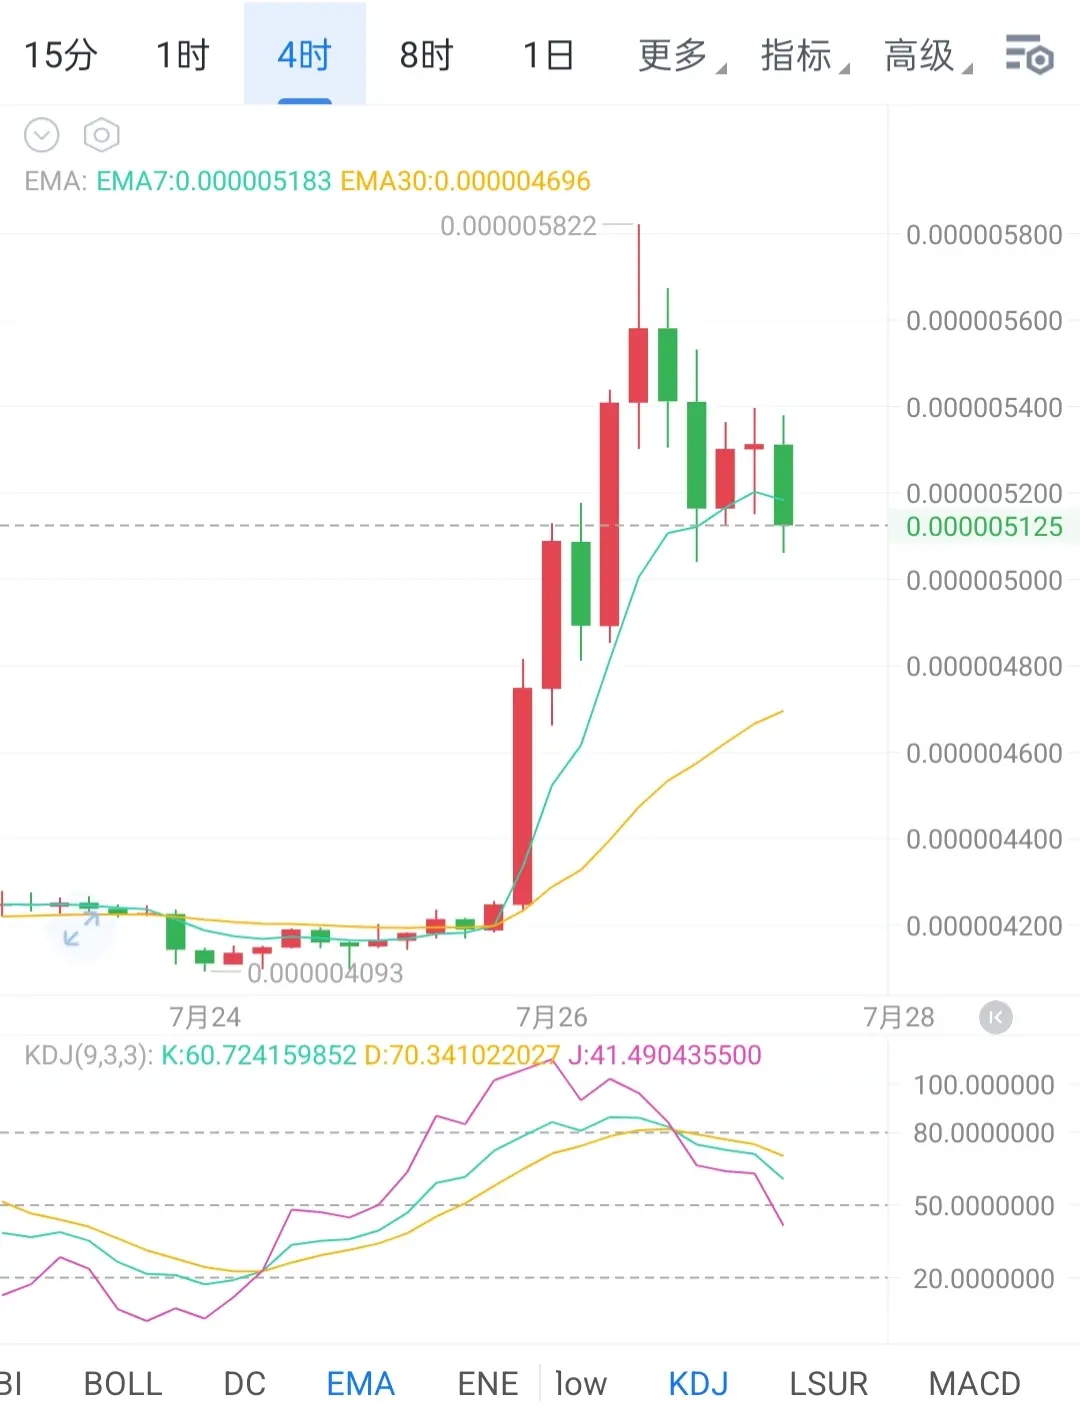
SHIB’s 4-hour moving averages show EMA5 > EMA10 > EMA20 > EMA120, indicating that the price is still in a mid-term uptrend structure and that the short-term pullback has not yet broken the bullish alignment.
In terms of KDJ, the K value is 60.6, lower than the D value of 70.3, and the J value is only 41.1—meaning the short-term correction signal is more pronounced than the MACD. Therefore, it is currently more appropriate to define the trend as “mid-term bullish, short-term consolidation/weaker,” rather than a one-way strong push.
SHIB-7.11%
View Original
post-image
  • Reward
  • 10
  • 1
  • Share
TheWhale:
good
View More
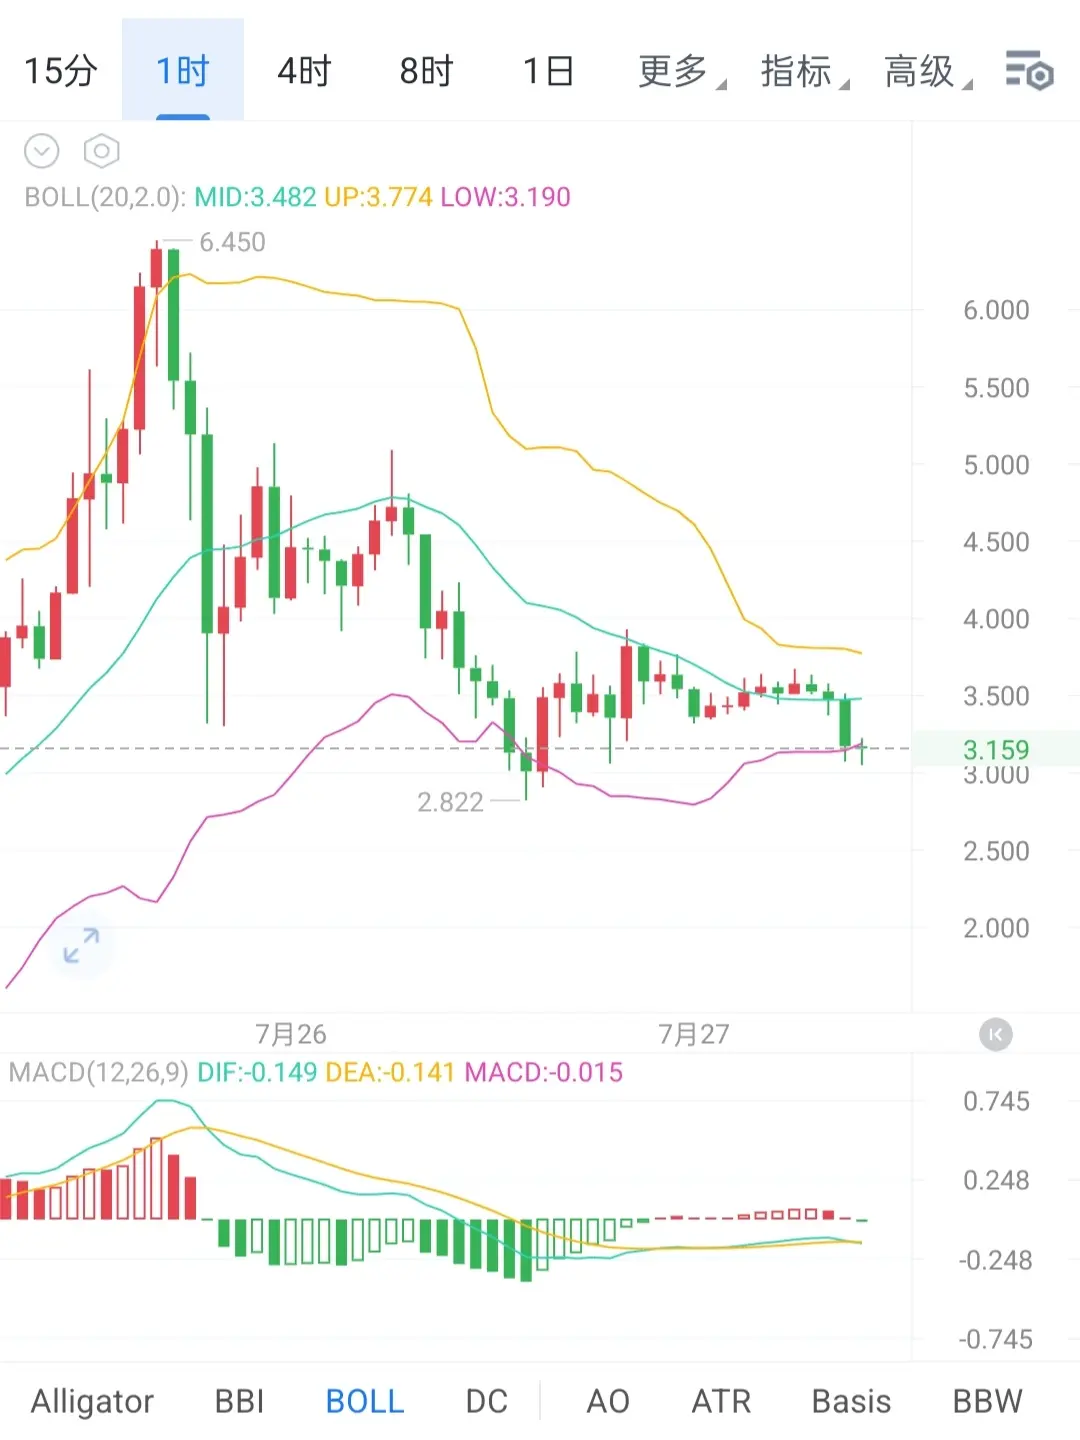
The current DEX market is in a range-bound trading state, with weakening momentum and a notable trading-volume level, indicating that the DEX market is hesitating about future price direction. Technical analysis shows increased downside risk; especially under divergence signals between trading volume and price, trading should remain cautious. #加密市场回升
In terms of the external environment, the DEX market sentiment of extreme fear and the US dollar index’s strong performance at high levels further add pressure to risk assets and may suppress the upside potential for cryptocurrencies.
DEXE-29.10%
View Original
post-image
  • Reward
  • Comment
  • Repost
  • Share
7/27 Strategy:
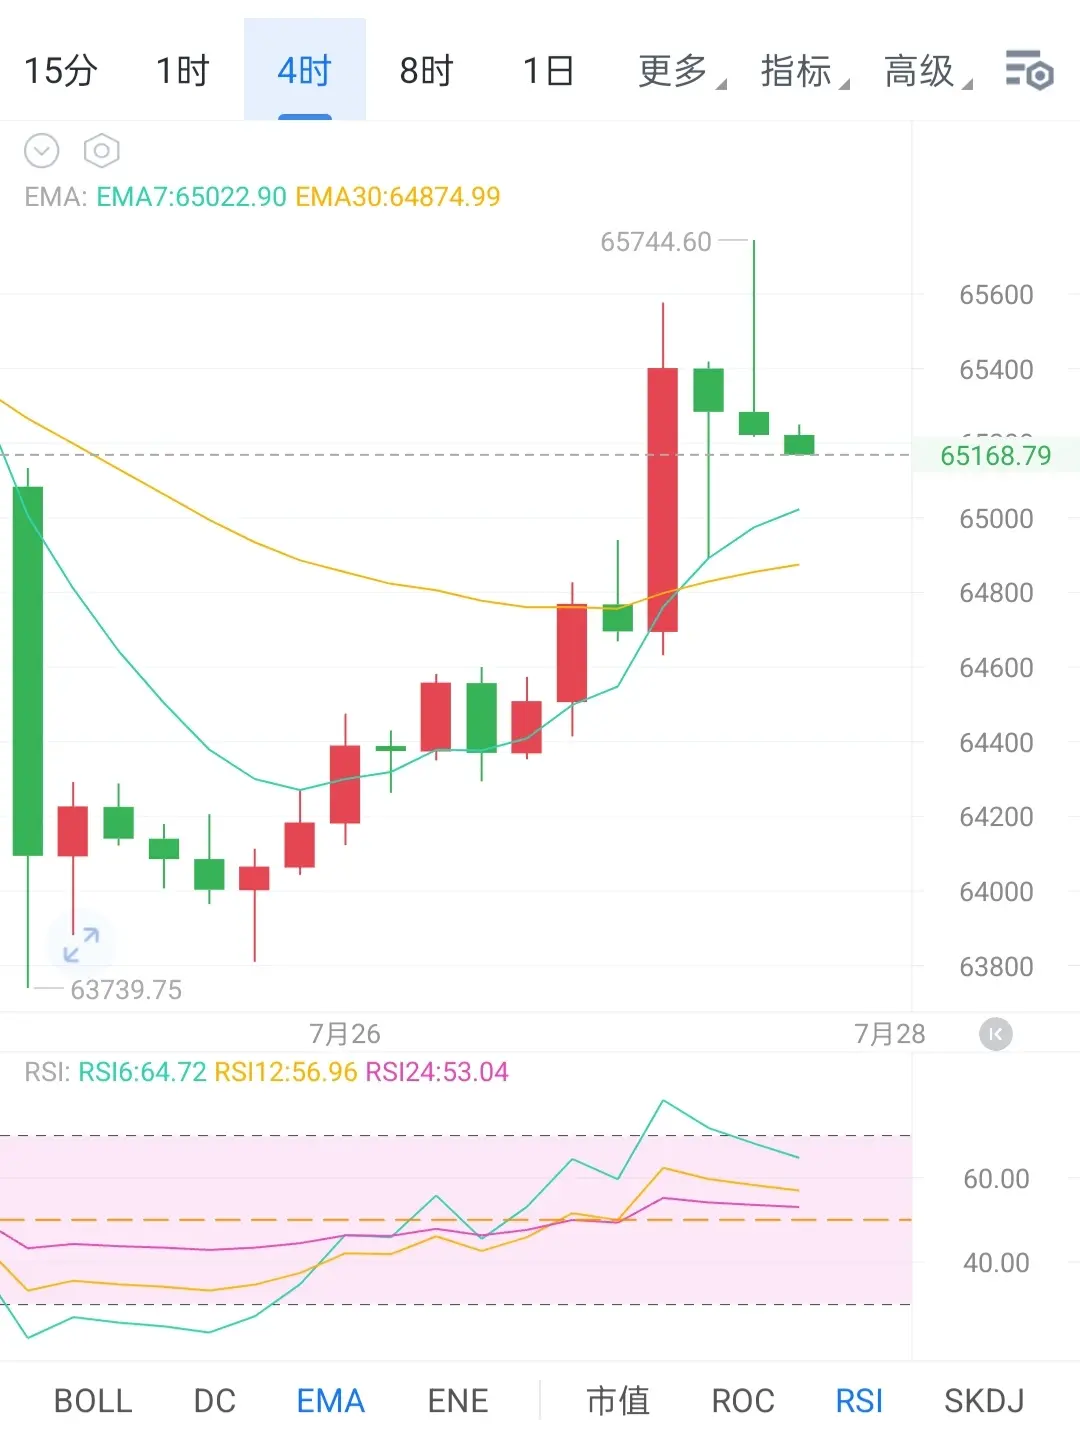
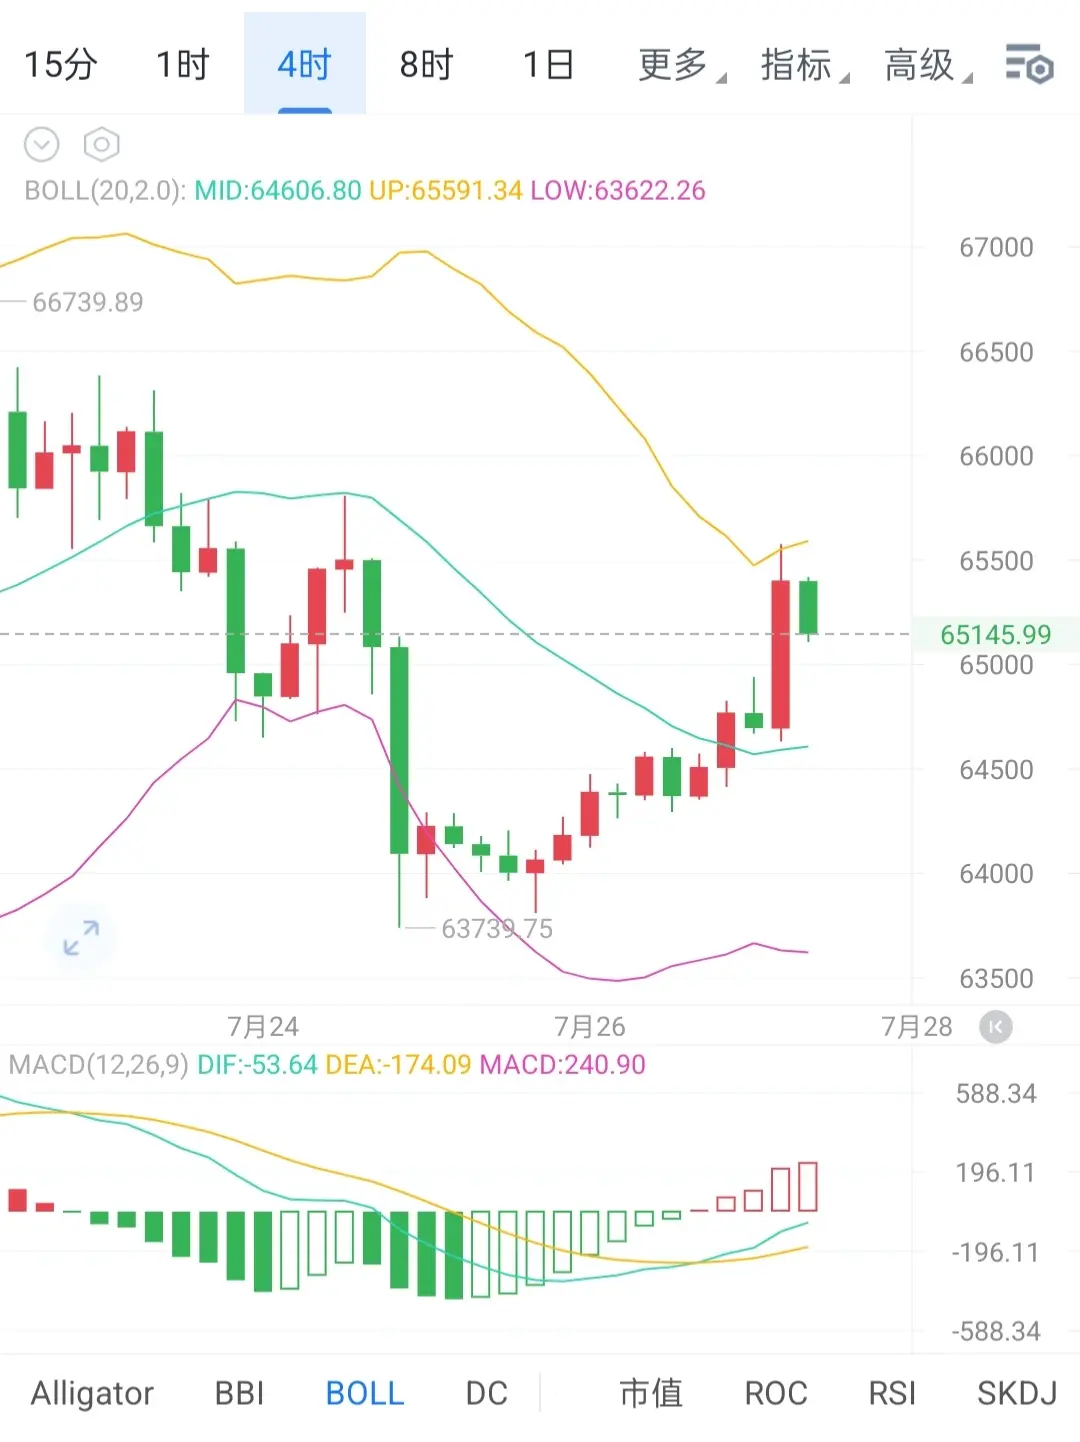
On the BTC 4-hour chart, in the early hours of the day there was a high-volume strong bullish candle that broke out of the recent consolidation range, showing strong buying pressure.
Then a small bearish candle appeared, with trading volume significantly shrinking, indicating a normal pullback after the breakout or profit-taking—not a trend reversal.
The DIF line has crossed above the DEA line to form a golden cross, and the MACD histogram bars remain positive and have expanded, indicating strong short-term upward momentum.
Trading suggestions:
Big cake: 64,500–65,000 go north,
BTC1.10%
View Original
post-image
  • Reward
  • Comment
  • Repost
  • Share
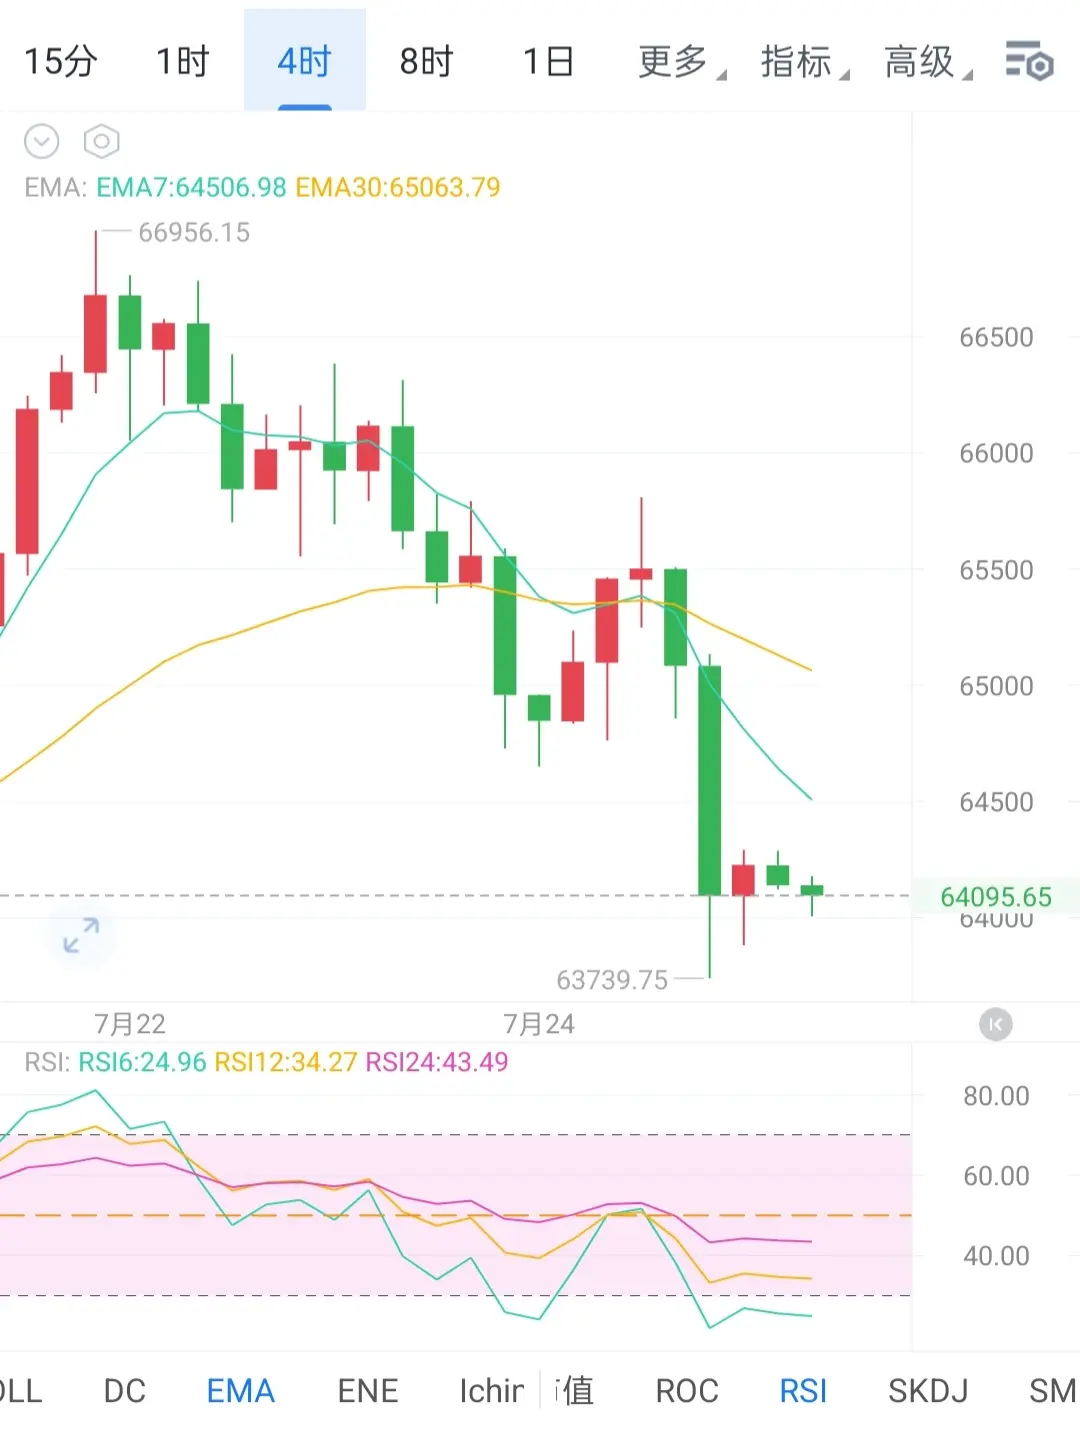
BTC at the 4-hour level is still in an oversold rebound phase within a bearish trend. The current price is around 64,000, below the EMA10, EMA20, and the Bollinger Band middle line, indicating the market has not yet completed trend repair. Although there is a short-term need for a rebound, it is currently more like weak consolidation after a drop rather than a clear trend reversal.
RSI6 is 24.86, RSI12 is 33.54, and RSI24 is 41.16. The short cycle has already entered the oversold zone, while the mid cycle remains weak. This combination usually suggests there is a technical rebound opportunity,
View Original
post-image
  • Reward
  • Comment
  • Repost
  • Share
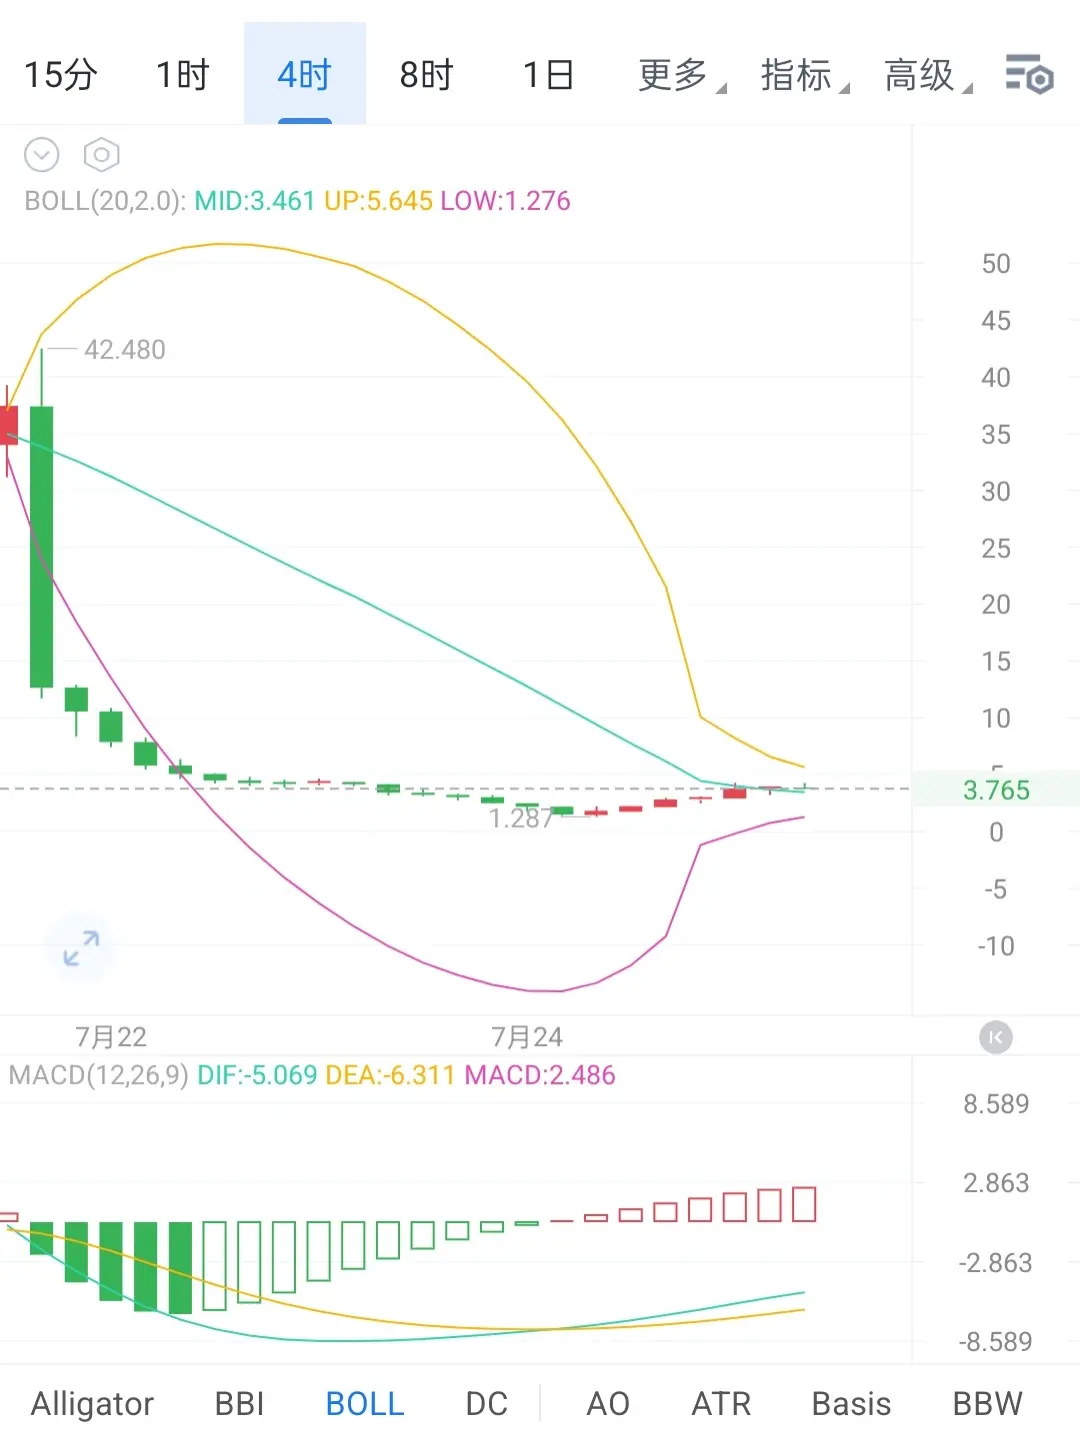
The current DEXE market is in a range-bound, sideways consolidation with no clear directional bias. Technical analysis shows a hammer-like candlestick pattern and a doji, suggesting the market is undergoing consolidation, while the extremely low trading volume further indicates a bleak sentiment.
In terms of the external environment, the Fear & Greed Index shows extreme fear, and investors are pessimistic about future price movements. This can lead to capital outflows from the crypto market, increasing downside risk. Overall, the interplay between market sentiment and technical signals means c
DEXE-29.10%
View Original
post-image
  • Reward
  • 31
  • 1
  • Share
GateUser-49855a7d:
Will it return to its initial price
View More
7/25 strategy:
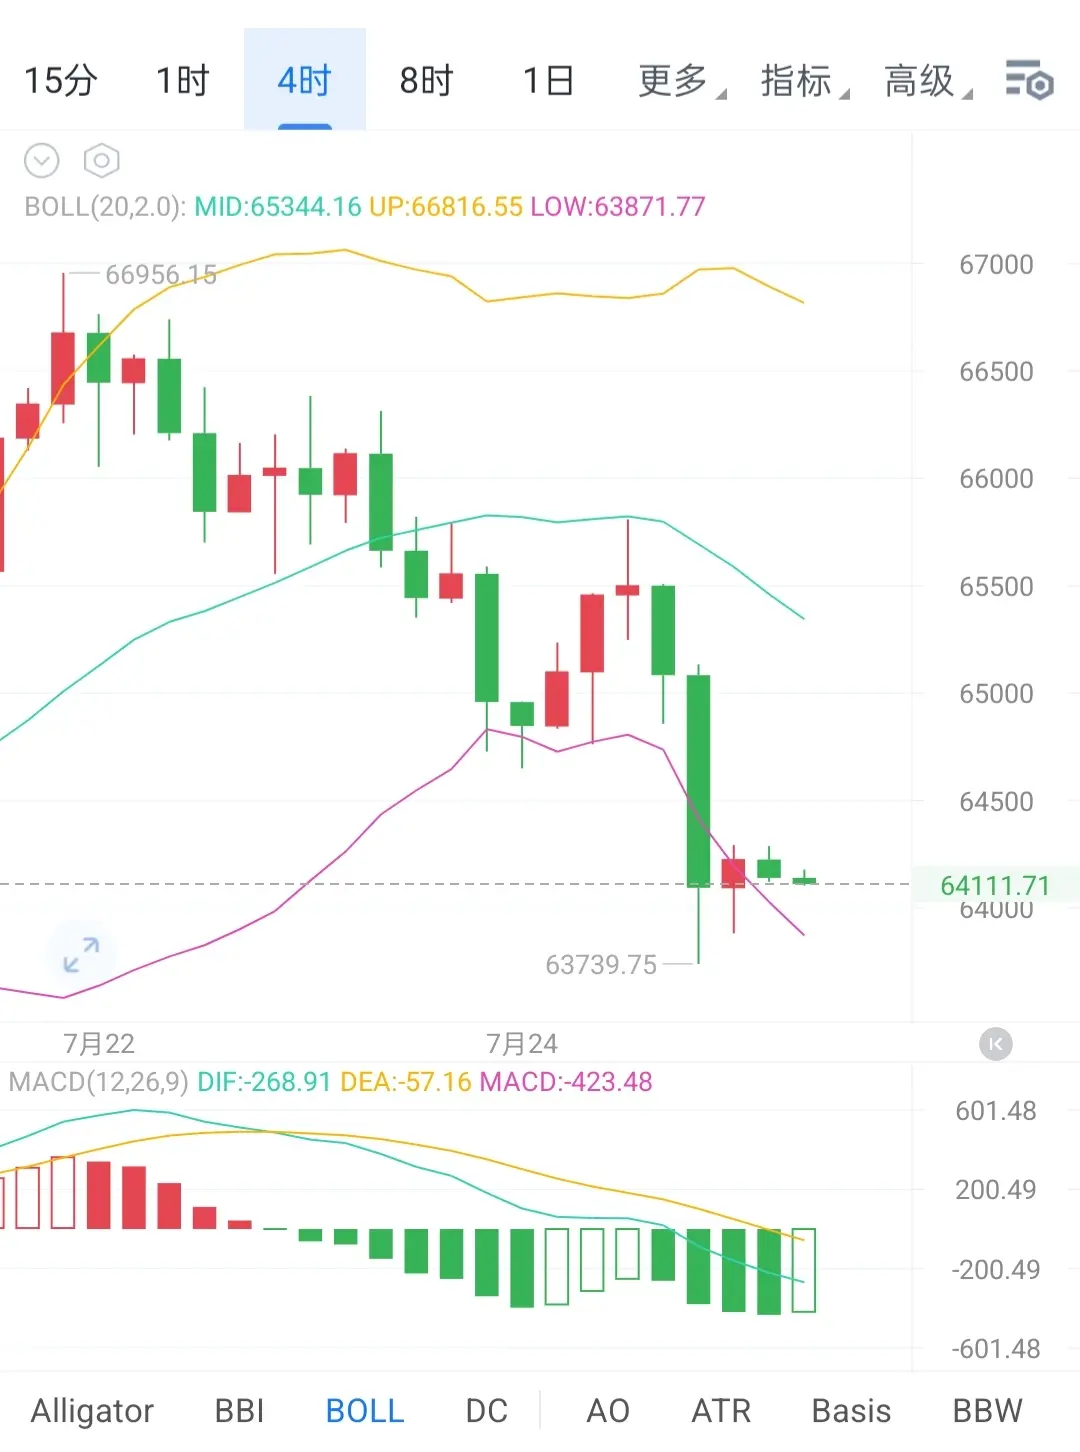
On the BTC 4-hour chart, after last night’s high-volume plunge, the latest candle is a low-volume small bullish candle, indicating that the market shows signs of stabilizing in the short term, but rebound momentum is insufficient and bullish strength has not yet emerged.
The MACD indicator DIF and DEA are both continuously falling below the zero axis, and the MACD histogram’s green energy bars continue to expand, suggesting that the downtrend is strong and selling pressure is well supported.
Trading suggestions:
BTC: Go short from 64,500–64,300, with targets at 63,000–62,500
ETH
BTC1.10%
View Original
post-image
  • Reward
  • Comment
  • Repost
  • Share
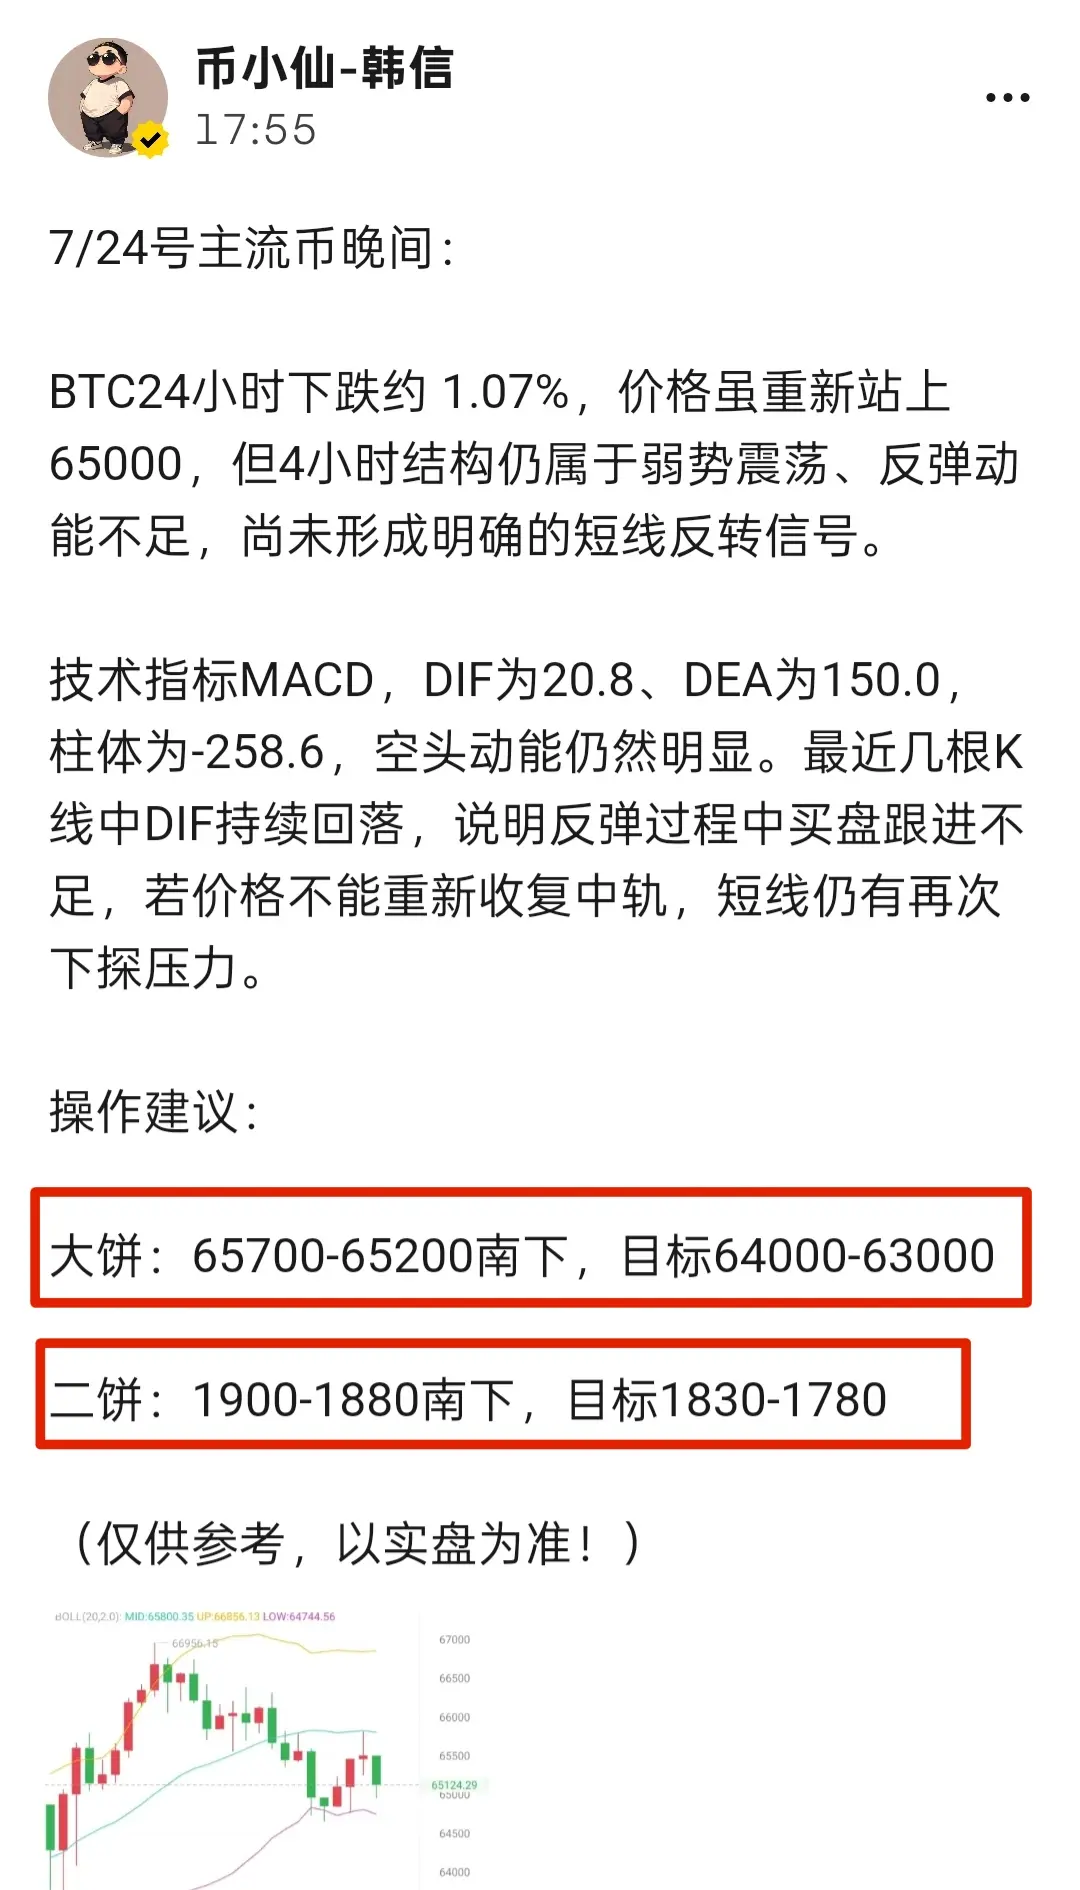
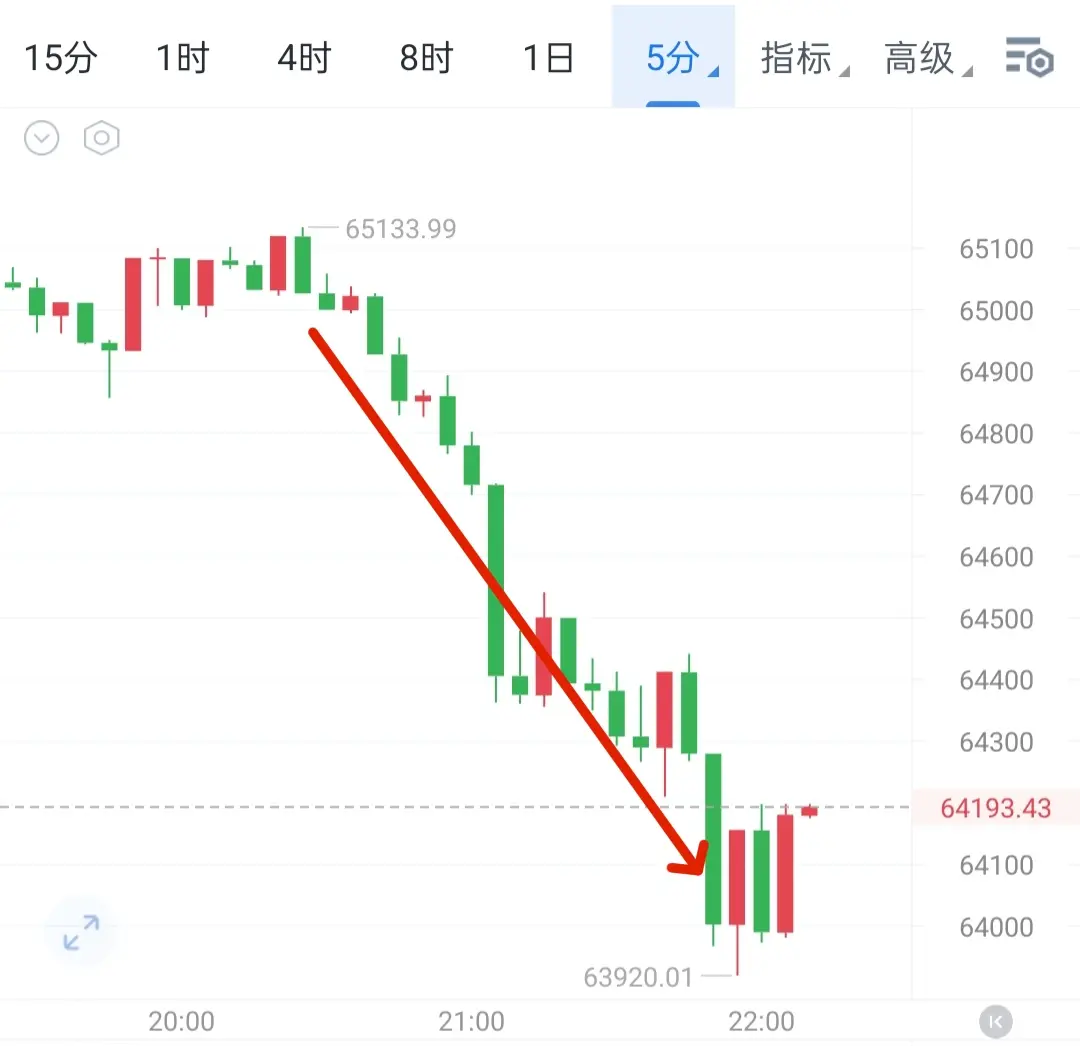
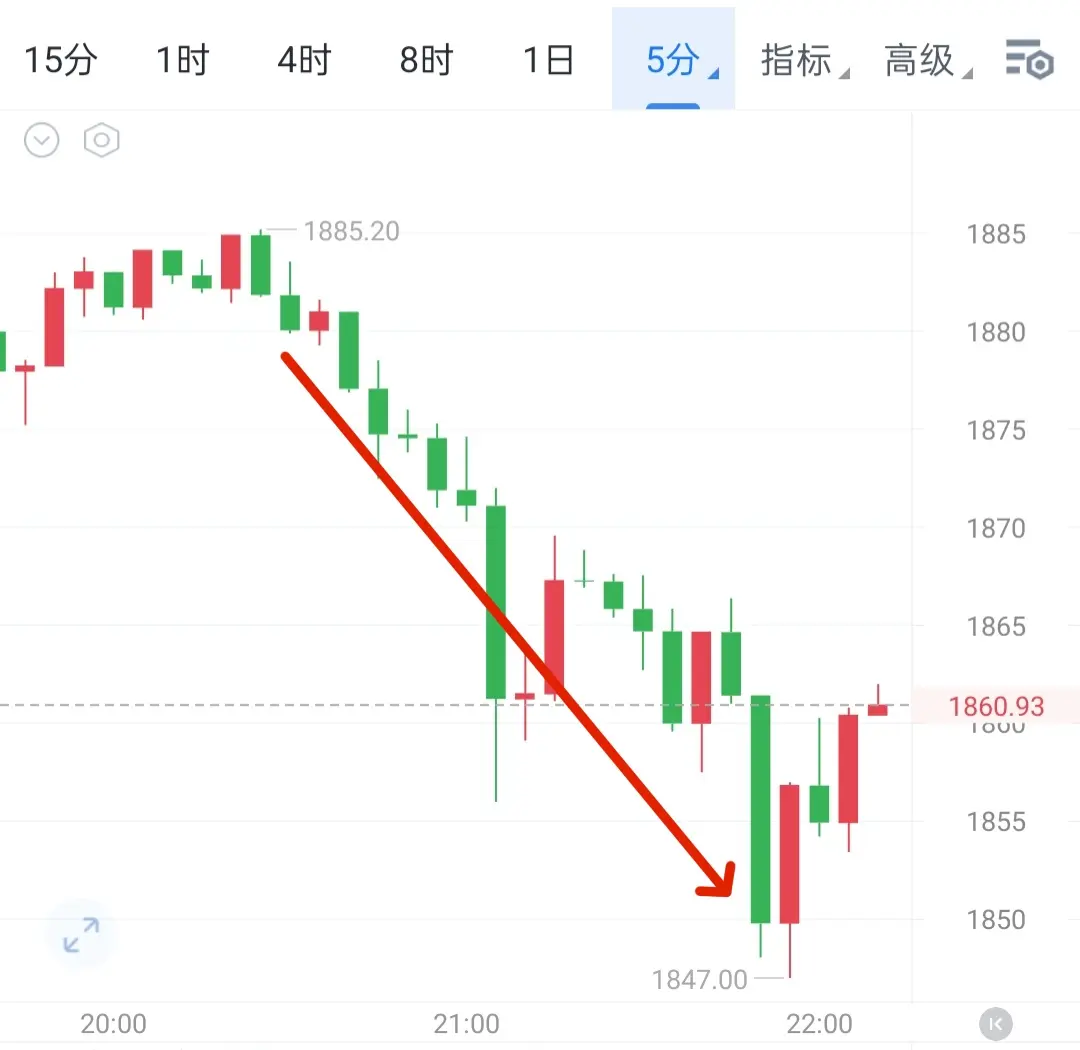
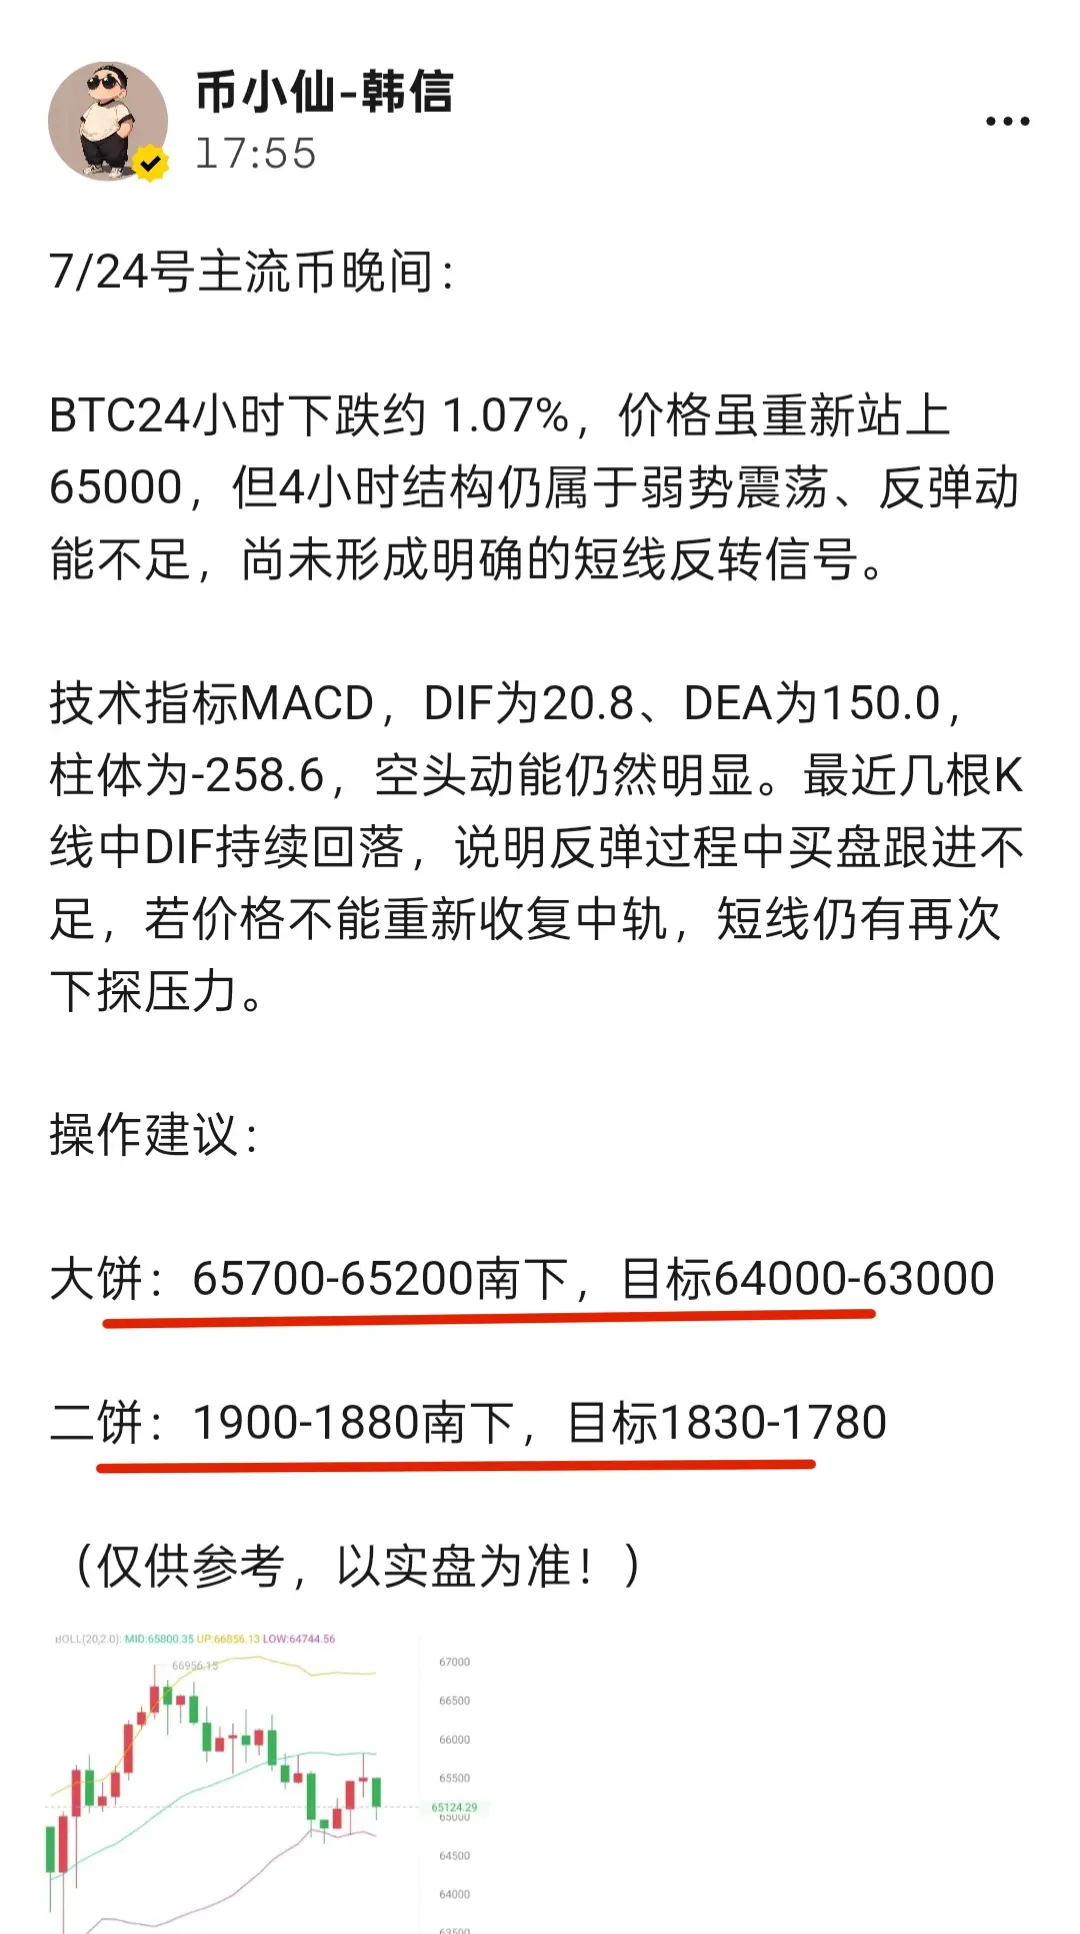
On the evening of 7/24, here’s our southbound plan: Big BTC at 1200 points, and ETH at 30 points—come on, take it!
View Original
post-image
post-image
post-image
  • Reward
  • Comment
  • Repost
  • Share
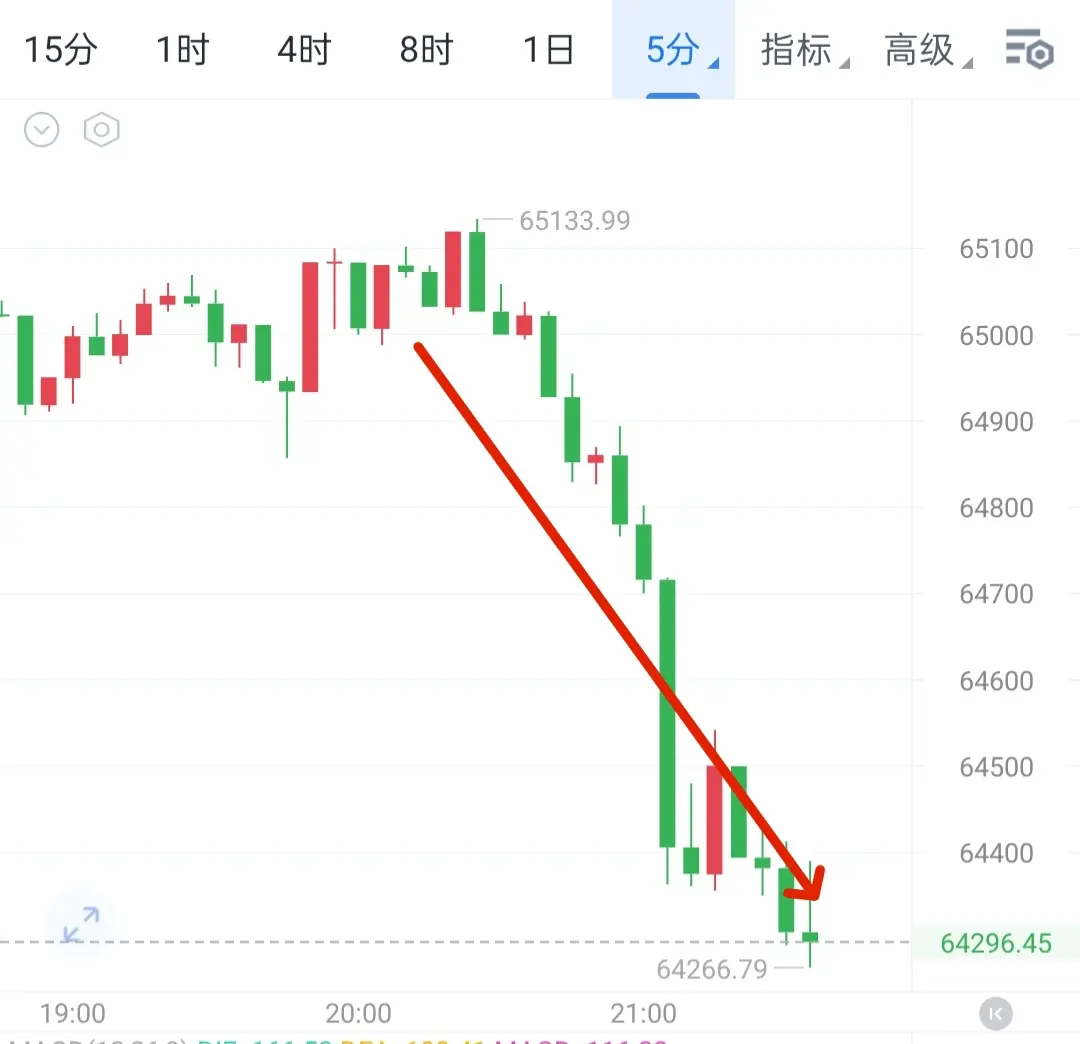
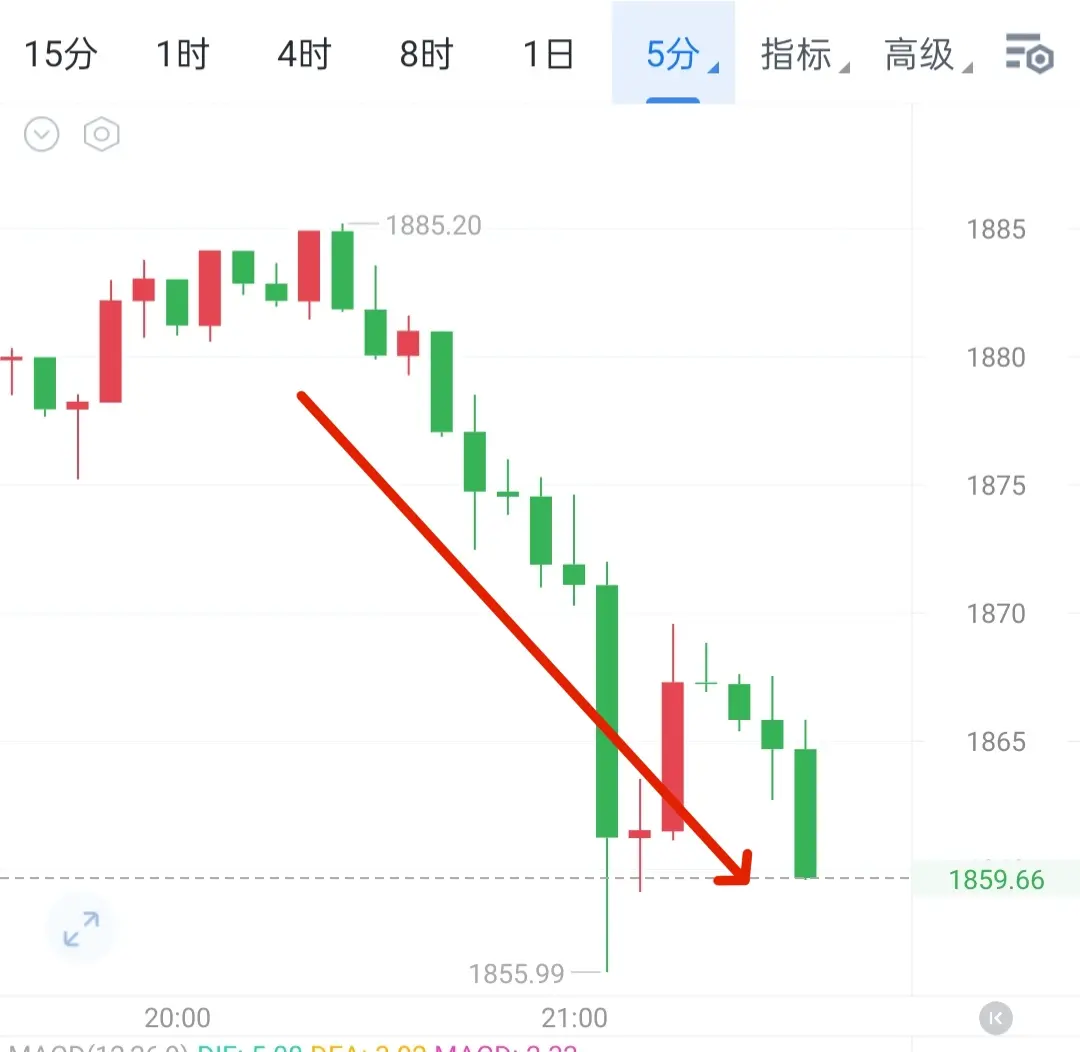
The plan for moving south in the evening has already been notified; we’re currently in profit…
View Original
post-image
post-image
post-image
  • Reward
  • Comment
  • Repost
  • Share
  • Pinned