

#ETHPlunges5PercentBelow1800
Ethereum, the second largest cryptocurrency by market capitalization, has suffered a sharp decline of 5 percent, breaking below the psychologically critical 1800 dollar support level. This dramatic drop has sent shockwaves across the crypto market, triggering liquidations, panic selling, and a wave of uncertainty among traders and investors alike. In this detailed discussion, we will examine the root causes behind this plunge, analyze the current price action, provide forecasts for where ETH might head next, and outline a clear trading strategy with actionable steps for both short term and medium term participants.
Current Price Situation and Market Context
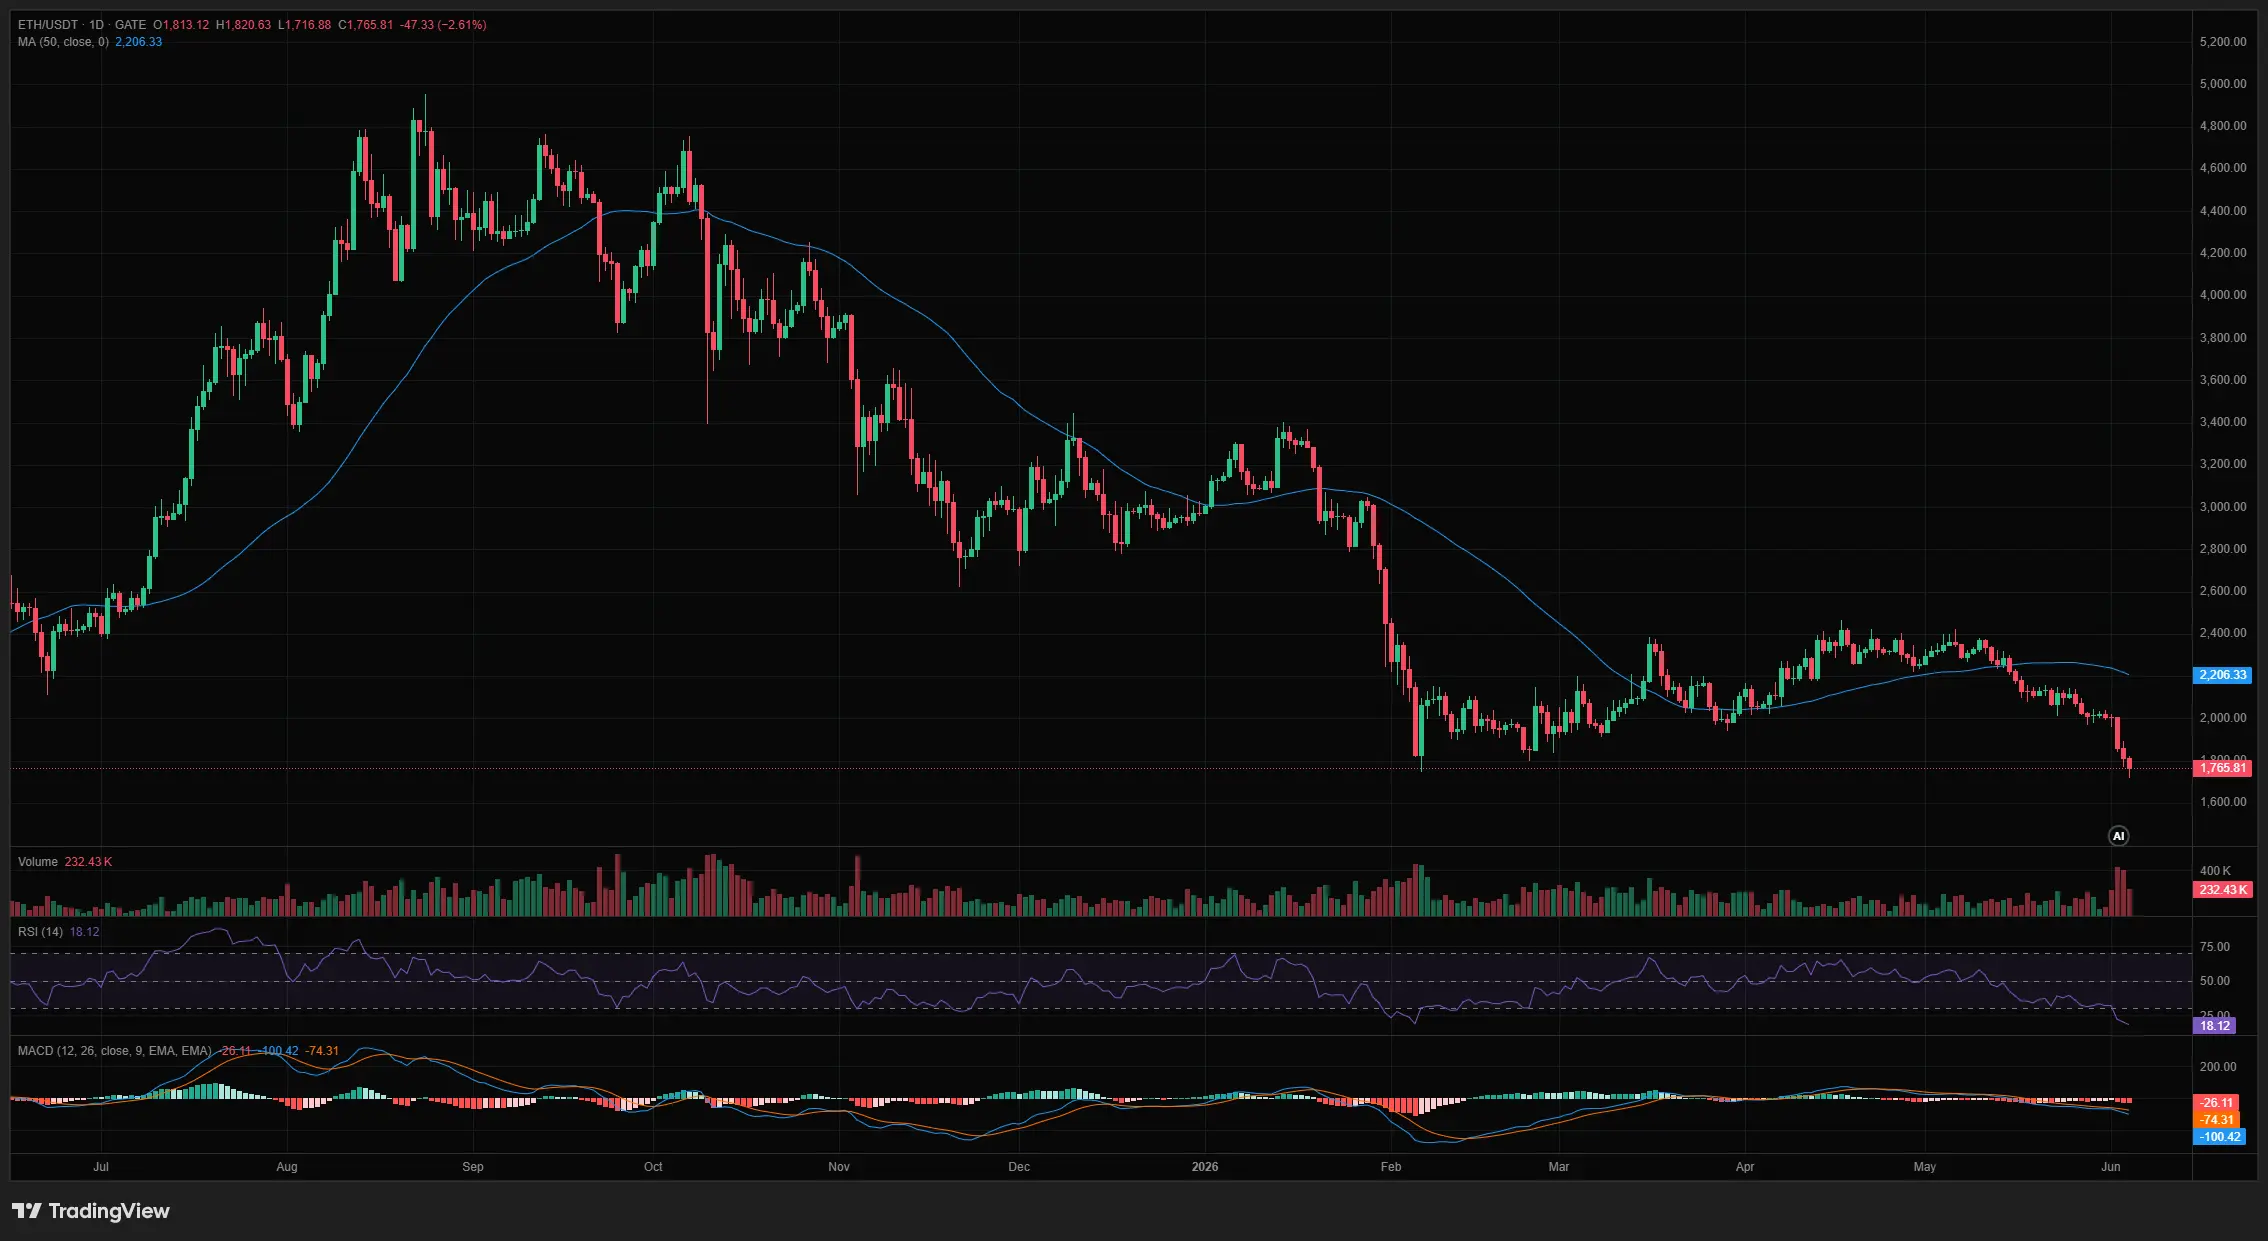
As of early June 2026, Ethereum is trading below 1800 dollars after a sudden 5 percent intraday drop. The break below 1800 is significant because this level had served as a strong support zone for several weeks. Prior to this breakdown, ETH had been consolidating in a range between 1800 and 1950 dollars, showing signs of accumulation. However, a combination of macroeconomic pressure, weakening technical indicators, and a broader crypto market sell off pushed the price through this floor with considerable volume. The sell off was accompanied by elevated trading volumes on major exchanges, indicating that the move was not merely a thin liquidity event but a genuine shift in market sentiment. Open interest in ETH futures also dropped sharply as leveraged long positions were liquidated en masse, adding further downward momentum to the cascade.
Why ETH Plunged Below 1800
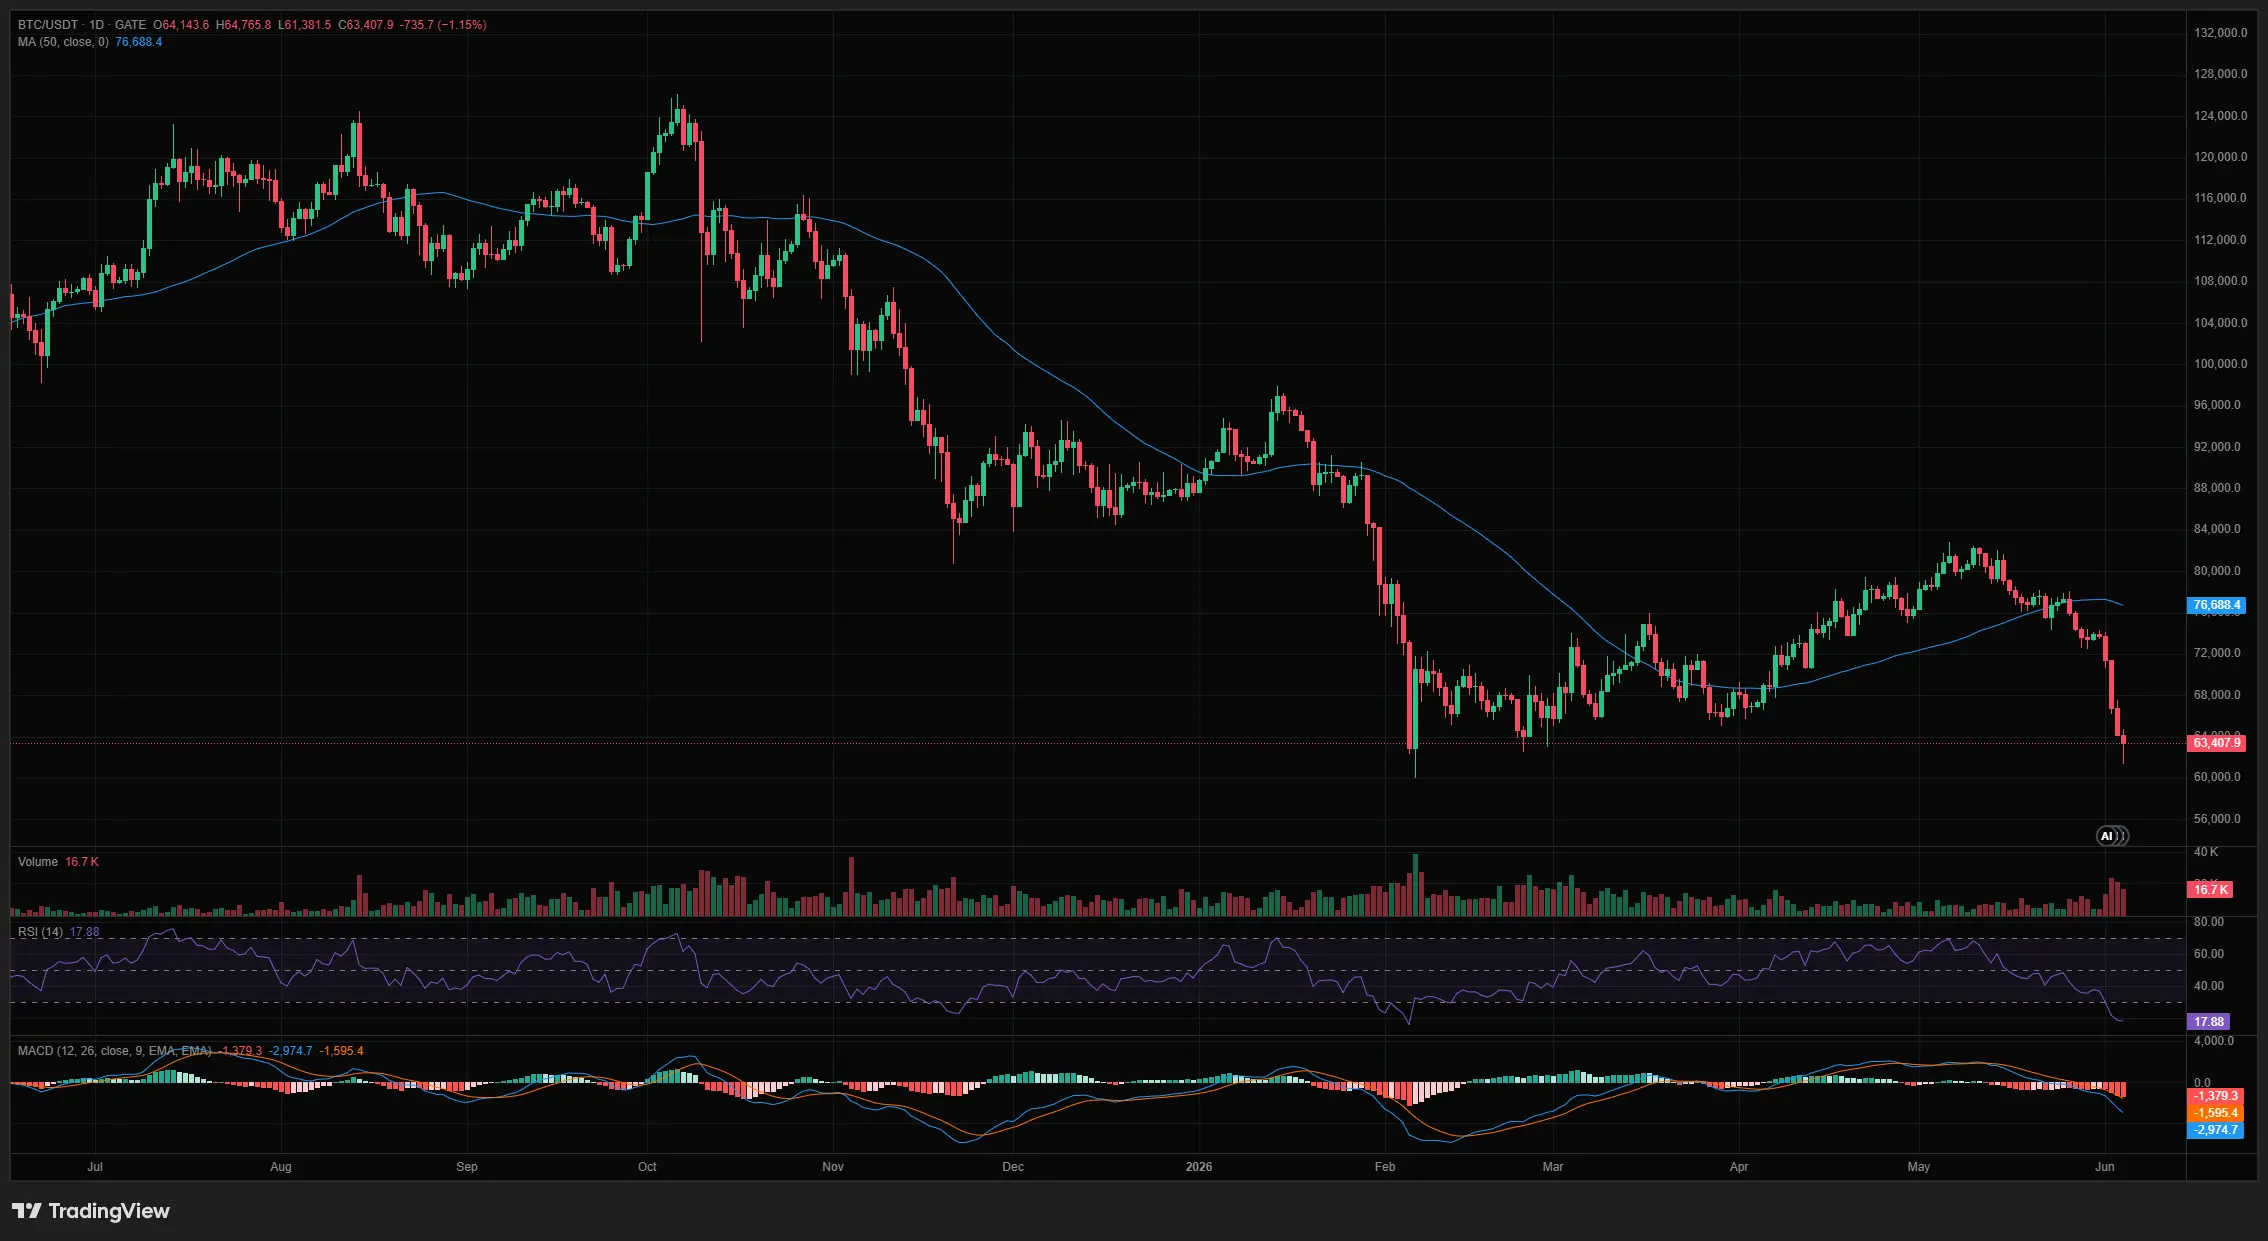
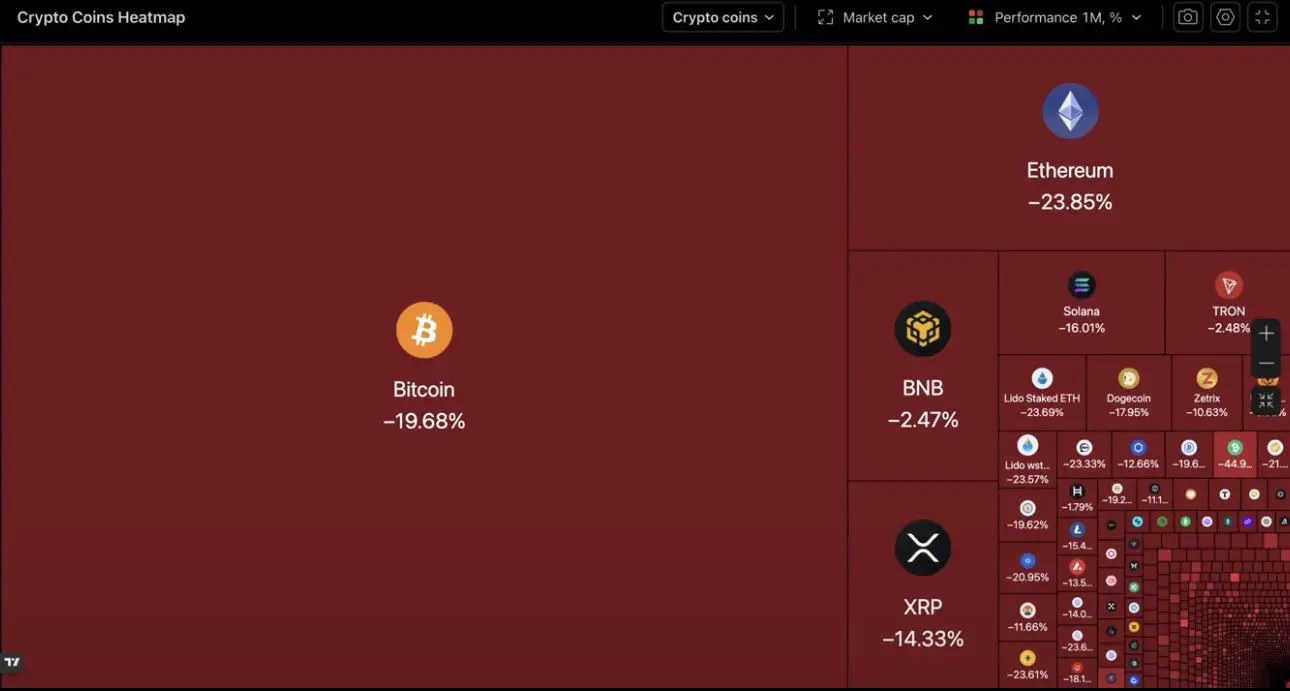
Several factors contributed to this sharp decline. First, macroeconomic headwinds have intensified globally. Rising concerns about interest rate policy, inflation data surprises, and tightening liquidity conditions have weighed heavily on risk assets including cryptocurrencies. When traditional markets show stress, crypto assets often amplify that movement due to their higher beta nature. Second, Ethereum's network activity has shown signs of slowing. On chain metrics such as daily active addresses, gas usage, and transaction counts have declined over recent weeks, suggesting reduced demand for block space and lower user engagement. Third, the broader altcoin market experienced a simultaneous sell off, which dragged ETH down alongside it. When risk appetite evaporates, the correlation between ETH and smaller altcoins tightens, creating a cascading effect. Fourth, large whale transfers to exchanges were detected in the days preceding the drop, hinting at upcoming selling pressure. When whales move significant ETH holdings to exchange wallets, it typically signals intent to sell, and the market often reacts preemptively.
Technical Analysis and Key Levels
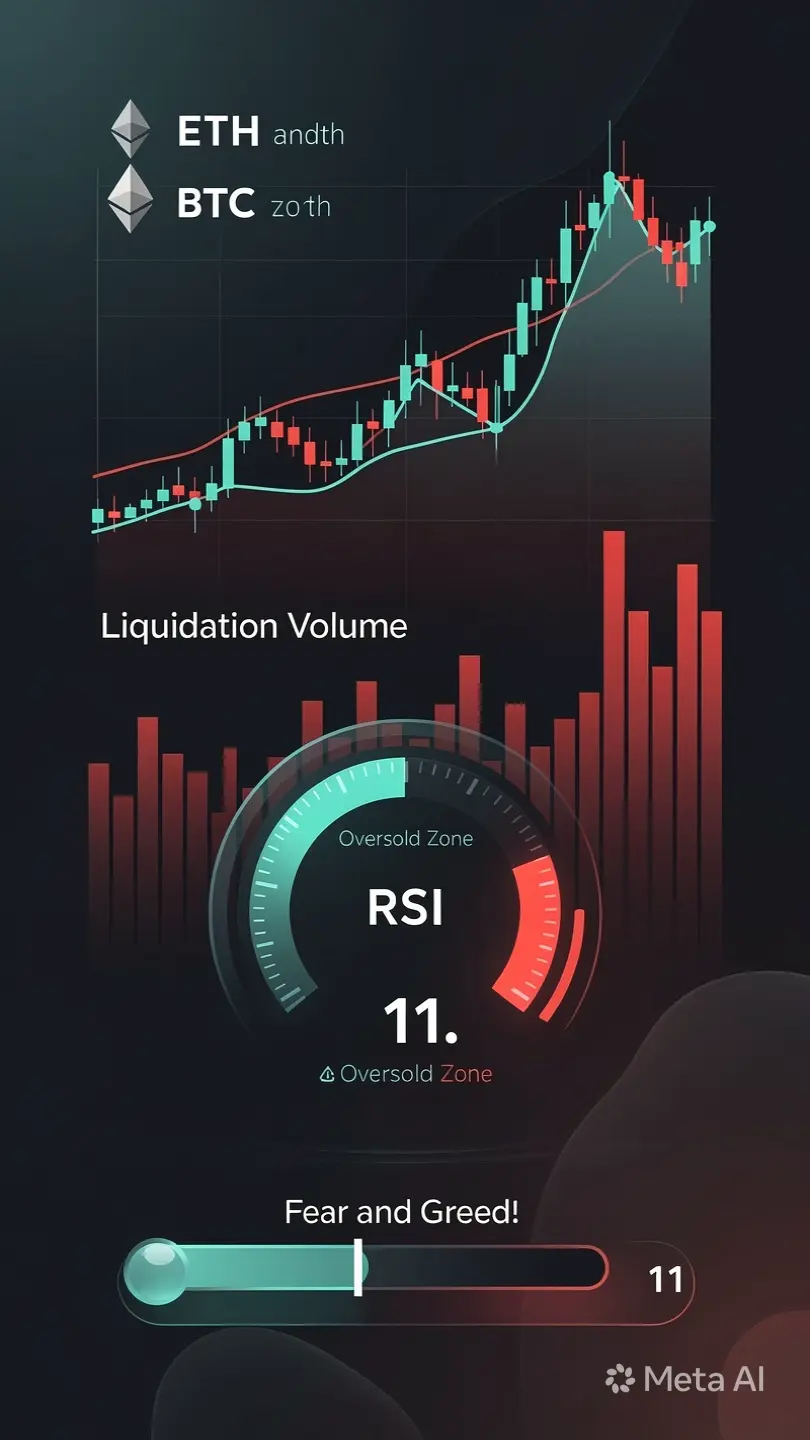
From a technical standpoint, the breakdown below 1800 dollars is alarming. The 1800 level was not just a round number psychological support; it also coincided with the 200 day moving average on the daily chart, making it a doubly important technical anchor. When a asset loses its 200 day moving average, it signals that the longer term trend has shifted from bullish to bearish. The next major support levels to watch are 1700 dollars, where a previous consolidation zone exists, and 1650 dollars, which marks the lower boundary of a larger macro range. If ETH fails to hold 1700, a swift move toward 1650 becomes highly probable. On the upside, resistance is now firmly established at 1800 dollars, which has flipped from support to resistance. Further resistance sits at 1950 dollars near the recent range high, and 2100 dollars where a previous structural resistance zone exists. The relative strength index on the daily timeframe has dropped into oversold territory around 28, which suggests that a short term bounce or relief rally is possible even within a broader downtrend. However, oversold readings alone do not guarantee reversal; they merely indicate that selling pressure has been intense and may temporarily exhaust itself.
Price Forecast — How Low Can ETH Go and How High Can It Recover
In the near term, the most probable scenario is continued weakness with potential tests of lower support levels. If macro conditions do not improve and on chain activity remains sluggish, ETH could slide toward the 1650 to 1700 dollar zone over the coming days. A worst case scenario under severe macro stress or a major negative catalyst could push ETH toward 1500 dollars, which represents the next major structural support from earlier price history. However, this extreme scenario requires a significant escalation of bearish forces and is not the base case. On the bullish side, if ETH manages to reclaim 1800 quickly and hold above it, a relief rally toward 1950 and potentially 2100 dollars becomes possible. Such a recovery would require renewed buying interest, improved macro sentiment, and ideally a positive catalyst such as favorable regulatory developments or a resurgence in network activity. For the medium term outlook over the next several months, ETH faces a bifurcated path. Under a bearish macro regime, prices could linger between 1500 and 1800 dollars for an extended period. Under a bullish scenario where macro conditions ease and Ethereum fundamentals strengthen, a recovery toward 2500 to 3000 dollars by late 2026 is achievable.
Trading Strategy — Step by Step Plan
For traders navigating this volatile environment, a disciplined approach is essential. Here is a step by step strategy. Step one, do not rush to buy the dip immediately after a major breakdown. The first reaction should be patience. Let the market establish a base and show signs of stabilization such as reduced sell off volume, a bullish reversal candle pattern, or a reclaim of a key support level. Step two, if you are already holding ETH from higher levels, evaluate your risk tolerance. If your position size is manageable and your timeframe is long term, holding through this dip may be reasonable since Ethereum remains a fundamentally strong asset. However, if your position is leveraged or your risk tolerance is low, consider reducing exposure by partially closing near current levels to preserve capital for better entry opportunities. Step three, for new entries, wait for confirmation that a support level is holding. The 1700 dollar zone is the first meaningful candidate for a bounce entry. Place limit orders near 1700 with tight stop losses below 1650 to manage risk. The risk to reward ratio at this entry would be approximately 1 to 3, targeting a return to 1800 and potentially 1950. Step four, if ETH fails to hold 1700 and slides toward 1650, that zone offers a second entry opportunity with a stop loss below 1600 and targets back toward 1800 to 1950. Step five, for leveraged futures traders, the current environment favors caution. Short positions may have already captured significant profit from the 5 percent drop, and chasing additional downside at oversold levels is risky. If you intend to trade shorts, wait for relief rallies toward 1800 to 1850 resistance zones and enter there with stops above 1950. Step six, always size positions appropriately. In a volatile breakdown scenario, position sizes should be reduced to half or less of your normal allocation to account for heightened uncertainty and wider price swings. Step seven, monitor macro developments closely. Any shift in interest rate expectations, inflation data, or regulatory news can rapidly change the trajectory for ETH and the broader crypto market.
Key Takeaways and Next Steps
Ethereum's 5 percent plunge below 1800 dollars marks a significant technical and psychological event. The breakdown of the 200 day moving average and a major support level signals that the trend has shifted bearish in the near term. However, oversold conditions and historically strong fundamental support for Ethereum suggest that this is not necessarily the beginning of a prolonged collapse. Traders should exercise patience, wait for confirmation of support holding, and enter with well defined risk management parameters. The most likely near term range is 1650 to 1800 dollars, with potential relief rallies toward 1950 if buying interest returns. The worst case downside extends to 1500, while the upside recovery potential over months can reach 2500 to 3000 under favorable conditions. Discipline, risk management, and patience are the three pillars of navigating this market phase successfully.
@Gate_Square #TradeCFDWinGold
Ethereum, the second largest cryptocurrency by market capitalization, has suffered a sharp decline of 5 percent, breaking below the psychologically critical 1800 dollar support level. This dramatic drop has sent shockwaves across the crypto market, triggering liquidations, panic selling, and a wave of uncertainty among traders and investors alike. In this detailed discussion, we will examine the root causes behind this plunge, analyze the current price action, provide forecasts for where ETH might head next, and outline a clear trading strategy with actionable steps for both short term and medium term participants.
Current Price Situation and Market Context
As of early June 2026, Ethereum is trading below 1800 dollars after a sudden 5 percent intraday drop. The break below 1800 is significant because this level had served as a strong support zone for several weeks. Prior to this breakdown, ETH had been consolidating in a range between 1800 and 1950 dollars, showing signs of accumulation. However, a combination of macroeconomic pressure, weakening technical indicators, and a broader crypto market sell off pushed the price through this floor with considerable volume. The sell off was accompanied by elevated trading volumes on major exchanges, indicating that the move was not merely a thin liquidity event but a genuine shift in market sentiment. Open interest in ETH futures also dropped sharply as leveraged long positions were liquidated en masse, adding further downward momentum to the cascade.
Why ETH Plunged Below 1800
Several factors contributed to this sharp decline. First, macroeconomic headwinds have intensified globally. Rising concerns about interest rate policy, inflation data surprises, and tightening liquidity conditions have weighed heavily on risk assets including cryptocurrencies. When traditional markets show stress, crypto assets often amplify that movement due to their higher beta nature. Second, Ethereum's network activity has shown signs of slowing. On chain metrics such as daily active addresses, gas usage, and transaction counts have declined over recent weeks, suggesting reduced demand for block space and lower user engagement. Third, the broader altcoin market experienced a simultaneous sell off, which dragged ETH down alongside it. When risk appetite evaporates, the correlation between ETH and smaller altcoins tightens, creating a cascading effect. Fourth, large whale transfers to exchanges were detected in the days preceding the drop, hinting at upcoming selling pressure. When whales move significant ETH holdings to exchange wallets, it typically signals intent to sell, and the market often reacts preemptively.
Technical Analysis and Key Levels
From a technical standpoint, the breakdown below 1800 dollars is alarming. The 1800 level was not just a round number psychological support; it also coincided with the 200 day moving average on the daily chart, making it a doubly important technical anchor. When a asset loses its 200 day moving average, it signals that the longer term trend has shifted from bullish to bearish. The next major support levels to watch are 1700 dollars, where a previous consolidation zone exists, and 1650 dollars, which marks the lower boundary of a larger macro range. If ETH fails to hold 1700, a swift move toward 1650 becomes highly probable. On the upside, resistance is now firmly established at 1800 dollars, which has flipped from support to resistance. Further resistance sits at 1950 dollars near the recent range high, and 2100 dollars where a previous structural resistance zone exists. The relative strength index on the daily timeframe has dropped into oversold territory around 28, which suggests that a short term bounce or relief rally is possible even within a broader downtrend. However, oversold readings alone do not guarantee reversal; they merely indicate that selling pressure has been intense and may temporarily exhaust itself.
Price Forecast — How Low Can ETH Go and How High Can It Recover
In the near term, the most probable scenario is continued weakness with potential tests of lower support levels. If macro conditions do not improve and on chain activity remains sluggish, ETH could slide toward the 1650 to 1700 dollar zone over the coming days. A worst case scenario under severe macro stress or a major negative catalyst could push ETH toward 1500 dollars, which represents the next major structural support from earlier price history. However, this extreme scenario requires a significant escalation of bearish forces and is not the base case. On the bullish side, if ETH manages to reclaim 1800 quickly and hold above it, a relief rally toward 1950 and potentially 2100 dollars becomes possible. Such a recovery would require renewed buying interest, improved macro sentiment, and ideally a positive catalyst such as favorable regulatory developments or a resurgence in network activity. For the medium term outlook over the next several months, ETH faces a bifurcated path. Under a bearish macro regime, prices could linger between 1500 and 1800 dollars for an extended period. Under a bullish scenario where macro conditions ease and Ethereum fundamentals strengthen, a recovery toward 2500 to 3000 dollars by late 2026 is achievable.
Trading Strategy — Step by Step Plan
For traders navigating this volatile environment, a disciplined approach is essential. Here is a step by step strategy. Step one, do not rush to buy the dip immediately after a major breakdown. The first reaction should be patience. Let the market establish a base and show signs of stabilization such as reduced sell off volume, a bullish reversal candle pattern, or a reclaim of a key support level. Step two, if you are already holding ETH from higher levels, evaluate your risk tolerance. If your position size is manageable and your timeframe is long term, holding through this dip may be reasonable since Ethereum remains a fundamentally strong asset. However, if your position is leveraged or your risk tolerance is low, consider reducing exposure by partially closing near current levels to preserve capital for better entry opportunities. Step three, for new entries, wait for confirmation that a support level is holding. The 1700 dollar zone is the first meaningful candidate for a bounce entry. Place limit orders near 1700 with tight stop losses below 1650 to manage risk. The risk to reward ratio at this entry would be approximately 1 to 3, targeting a return to 1800 and potentially 1950. Step four, if ETH fails to hold 1700 and slides toward 1650, that zone offers a second entry opportunity with a stop loss below 1600 and targets back toward 1800 to 1950. Step five, for leveraged futures traders, the current environment favors caution. Short positions may have already captured significant profit from the 5 percent drop, and chasing additional downside at oversold levels is risky. If you intend to trade shorts, wait for relief rallies toward 1800 to 1850 resistance zones and enter there with stops above 1950. Step six, always size positions appropriately. In a volatile breakdown scenario, position sizes should be reduced to half or less of your normal allocation to account for heightened uncertainty and wider price swings. Step seven, monitor macro developments closely. Any shift in interest rate expectations, inflation data, or regulatory news can rapidly change the trajectory for ETH and the broader crypto market.
Key Takeaways and Next Steps
Ethereum's 5 percent plunge below 1800 dollars marks a significant technical and psychological event. The breakdown of the 200 day moving average and a major support level signals that the trend has shifted bearish in the near term. However, oversold conditions and historically strong fundamental support for Ethereum suggest that this is not necessarily the beginning of a prolonged collapse. Traders should exercise patience, wait for confirmation of support holding, and enter with well defined risk management parameters. The most likely near term range is 1650 to 1800 dollars, with potential relief rallies toward 1950 if buying interest returns. The worst case downside extends to 1500, while the upside recovery potential over months can reach 2500 to 3000 under favorable conditions. Discipline, risk management, and patience are the three pillars of navigating this market phase successfully.
@Gate_Square #TradeCFDWinGold