Crypto charts can move quickly, and a single candle often tells only part of the story. Prices may spike, pull back, consolidate, and reverse within short periods, making it difficult for traders to separate real trend direction from temporary noise. This is where technical indicators can help.
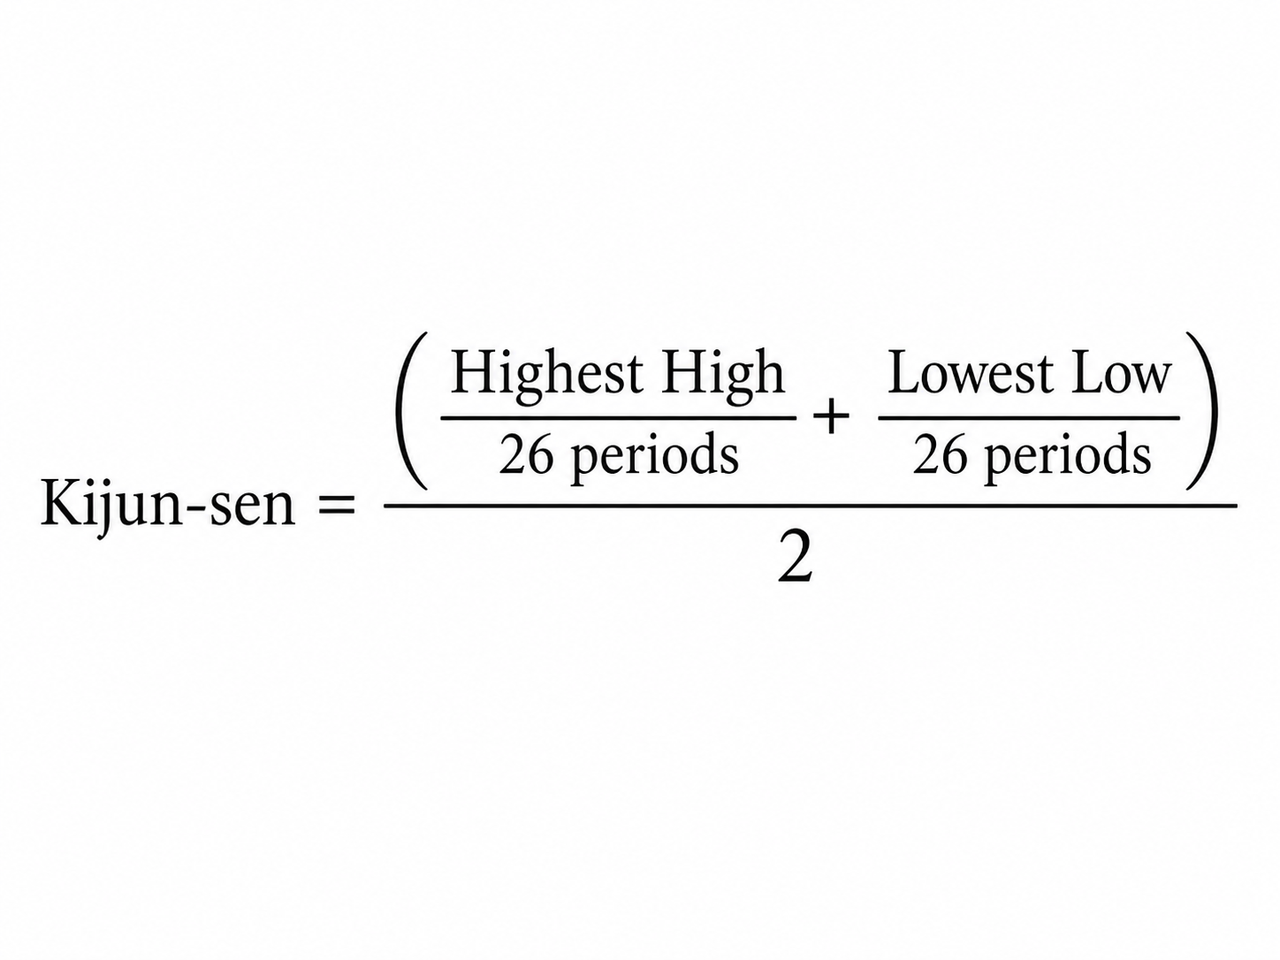
The Ichimoku Baseline, also known as the Kijun-sen, is one of the core lines in the Ichimoku Cloud system. It is often used as a medium-term trend reference line that helps traders judge whether price is holding strength, losing momentum, or returning toward balance. Unlike simple moving averages, the Kijun-sen does not calculate the average closing price over a period. Instead, it measures the midpoint between the highest high and lowest low over the last 26 periods. This gives traders a different view of price structure, one based on range balance rather than closing-price smoothing.
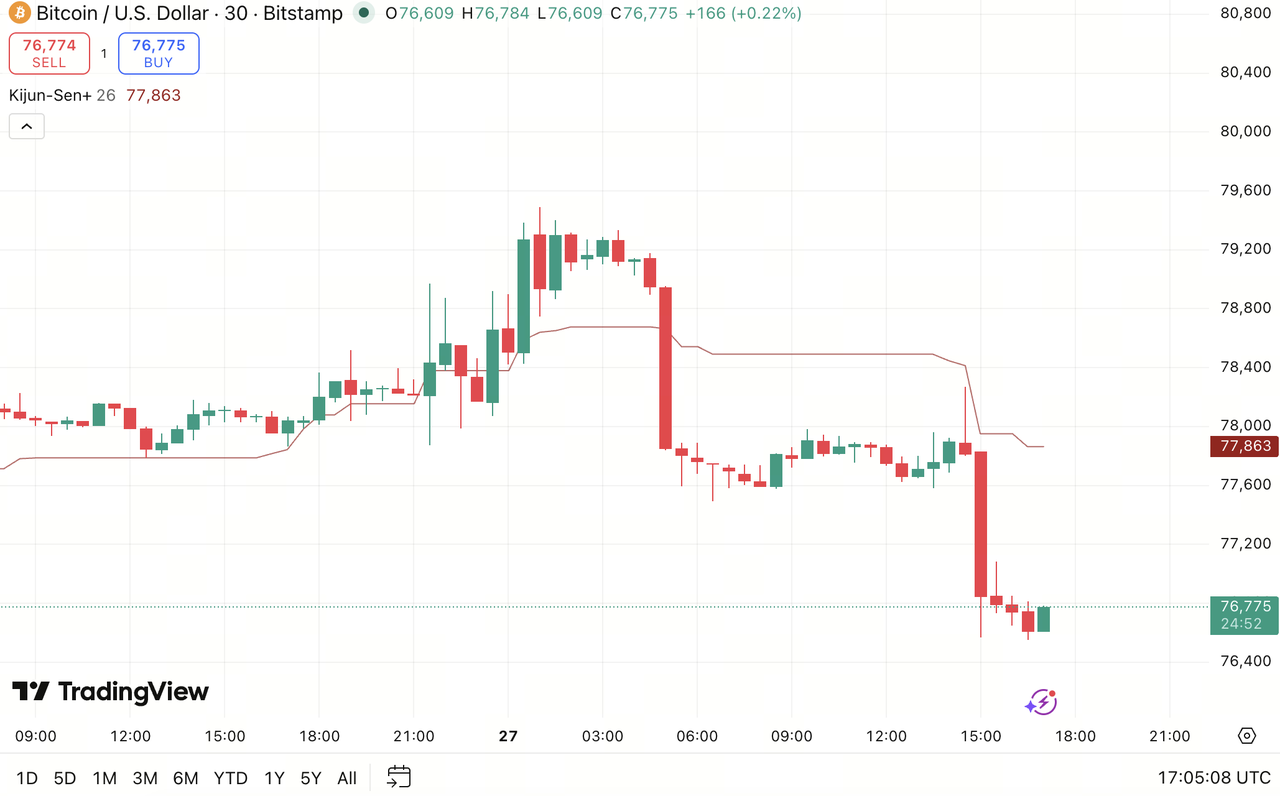
Source: TradingView
What the Kijun-sen Is
Within the Ichimoku system, the Kijun-sen works as the baseline for reading medium-term price structure. It reflects the midpoint between the highest high and lowest low over the last 26 periods, helping traders understand where price sits within its recent range.
In practical chart reading, price above the Kijun-sen may suggest bullish structure, while price below the line may suggest bearish structure. When price repeatedly returns to Kijun-sen, traders often read it as a balance area where the market is reassessing direction.
The Kijun-sen is not the same as a standard Moving Average. A Moving Average usually smooths closing prices over time. The Kijun-sen looks at the highest high and lowest low in a selected period, then marks the midpoint between them. This makes it more focused on range structure than average closing behavior.
That distinction matters in crypto markets. A coin may close strongly for several candles but still remain inside a broader range. The Kijun-sen helps traders see whether price is truly moving away from that range or simply reacting inside it.
The Kijun-sen is especially useful because it can act as:
-
A medium-term trend reference line
-
A dynamic support or resistance level
-
A pullback zone during trending markets
-
A balance point within the Ichimoku Cloud system
However, it should always be understood as one part of the Ichimoku structure, not as a complete trading system by itself.
How the Kijun-sen Is Calculated: The 26-Period Midpoint
The Kijun-sen is calculated by finding the highest high and lowest low over the last 26 periods, then dividing their sum by two.
This means the line does not follow every small price movement. It changes only when the highest high or lowest low of the 26-period range changes. Because of that, the Kijun-sen can sometimes appear flat on the chart. These flat sections are important because they show that the midpoint of the recent range has not changed.
For example, if Bitcoin trades within a defined range for several candles, the Kijun-sen may stay flat. This tells traders that the market has not made a meaningful new high or low within the 26-period window. If price later breaks away from that area, the flat Kijun-sen may become a reference point for support, resistance, or mean reversion.
The 26-period setting comes from the traditional Ichimoku system. In crypto markets, traders may apply it across different timeframes, such as 15-minute, 1-hour, 4-hour, or daily charts. The meaning of the line changes depending on the timeframe. On a short timeframe, it may reflect short-term structure. On a daily chart, it may represent a broader trend reference.
| Feature |
Kijun-sen Interpretation |
| Calculation basis |
Midpoint of the highest high and lowest low |
| Default period |
26 periods |
| Main use |
Medium-term trend reference |
| Common signal area |
Price above, below, or retesting the line |
| Best used with |
Full Ichimoku Cloud system |
| Key limitation |
Can lag or flatten during range-bound markets |
The key point is simple: the Kijun-sen does not try to predict price. It shows where the middle of the recent price range sits. Traders then use that information to judge whether price is moving with strength, returning to balance, or struggling to continue.
Reading the Kijun-sen as a Trend Reference Line
One of the most common ways traders use the Kijun-sen is as a trend reference line. It helps answer a basic question: is price trading above or below its medium-term balance point?
When price stays above the Kijun-sen, traders often view the market as having a bullish bias. This does not mean price will continue rising automatically, but it suggests buyers are keeping price above the recent midpoint. In a strong uptrend, price may pull back toward the Kijun-sen and then bounce, using it as a dynamic support area.
When price stays below the Kijun-sen, traders may read the structure as bearish. This suggests sellers are keeping price below its recent midpoint. In a downtrend, price may rally back toward the Kijun-sen and then reject, using it as dynamic resistance.
The angle of the Kijun-sen also matters. A rising Kijun-sen suggests that the recent price range is shifting higher. A falling Kijun-sen suggests the range is shifting lower. A flat Kijun-sen suggests balance, consolidation, or reduced directional pressure.
For crypto traders, this can be useful because fast-moving markets often create emotional reactions. A sharp candle may look bullish in isolation, but if price is still below the Kijun-sen and the broader Ichimoku structure remains weak, the move may simply be a short-term bounce.
The Kijun-sen helps traders slow down the reading of the chart. Instead of reacting to every candle, they can ask whether price is holding above or below a meaningful trend reference line.
How the Kijun-sen Interacts With Price Action
The relationship between price and the Kijun-sen is one of the most practical parts of the indicator. Traders usually watch how price behaves when it moves toward, above, below, or away from the line.
When price moves far above the Kijun-sen, the market may be showing strong bullish momentum. However, it may also be stretched. In these cases, traders often watch for a pullback toward the baseline. The pullback does not always mean the trend is ending. Sometimes it simply means price is returning toward balance before deciding whether to continue.
When price falls far below the Kijun-sen, the market may be showing strong bearish momentum. At the same time, price may become stretched to the downside. If price later rebounds toward the Kijun-sen, traders may watch whether it breaks above the line or gets rejected.
A clean retest of the Kijun-sen can be important. In an uptrend, price pulling back to the line and holding above it may suggest that buyers are still active. In a downtrend, price rising into the line and failing to break above it may suggest sellers remain in control.
Price crossing the Kijun-sen can also signal a possible shift, but this should not be used alone. A single cross may happen during sideways movement and create a false signal. Traders usually confirm it with the cloud, Tenkan-sen, volume, support and resistance, or broader market context.
The Kijun-sen can also act like a magnet when price moves too far away from it. Because it represents the midpoint of the recent range, price sometimes returns toward it after a strong move. This is why some traders use it to understand mean reversion risk, especially after sharp crypto rallies or sell-offs.
Still, a return to the Kijun-sen does not guarantee reversal. In strong trends, price can stay extended for longer than expected. The line is a reference point, not a prediction tool.
Limitations of the Kijun-sen
The Kijun-sen is useful, but it has clear limitations. The first limitation is lag. Because it is based on the highest high and lowest low over 26 periods, it responds only when the price range changes. This can make it slower than some short-term indicators during sudden market reversals.
The second limitation is that it can produce weak signals in sideways markets. When price repeatedly crosses above and below the Kijun-sen, traders may get confusing signals. In these conditions, the line may show balance but not clear direction.
The third limitation is that the Kijun-sen should not be used alone. It is part of the Ichimoku Cloud system, which means its meaning depends on the wider structure. A price move above the Kijun-sen may look bullish, but if price is still below the cloud, the larger trend may remain weak. A price drop below the Kijun-sen may look bearish, but if the cloud and broader trend remain supportive, it may only be a temporary pullback.
Another limitation is timeframe sensitivity. A Kijun-sen signal on a 5-minute chart may have little importance compared with a signal on a daily chart. Traders need to match the timeframe to their trading style. Short-term traders may use it for intraday structure, while swing traders may focus on higher timeframes.
Finally, the Kijun-sen does not include volume, liquidity, news, funding rates, or broader market sentiment. In crypto markets, these factors can strongly affect price movement. For that reason, traders often combine the Kijun-sen with other technical indicators and market context.
Conclusion
The Ichimoku Baseline, or Kijun-sen, is a practical technical indicator used to understand medium-term price structure. It is calculated as the midpoint between the highest high and lowest low over the last 26 periods, giving traders a clear view of where price sits relative to its recent range.
In crypto trading, the Kijun-sen can help identify trend direction, dynamic support and resistance, pullback zones, and moments when price may be returning toward balance. When price stays above the line, the structure may lean bullish. When price stays below it, the structure may lean bearish. When price repeatedly crosses the line, the market may be ranging or undecided.
The most important point is that the Kijun-sen should not be treated as a standalone trading signal. It works best inside the full Ichimoku framework, where traders can compare it with price action, the cloud, Tenkan-sen, and broader market structure. Used carefully, it can help traders read crypto charts with more discipline and less reaction to short-term noise.
FAQs
What is the Ichimoku Baseline?
The Ichimoku Baseline, also called the Kijun-sen, is a line in the Ichimoku Cloud system that shows the midpoint between the highest high and lowest low over the last 26 periods. Traders use it as a medium-term trend reference line.
Is the Kijun-sen a Moving Average?
The Kijun-sen is often compared with Moving Averages, but it is not calculated the same way. A Moving Average usually uses closing prices, while the Kijun-sen uses the midpoint of the recent high-low range.
What does price above the Kijun-sen mean?
Price above the Kijun-sen usually suggests bullish structure because the market is trading above its medium-term balance point. However, traders should confirm this with the broader Ichimoku Cloud and price action.
What does price below the Kijun-sen mean?
Price below the Kijun-sen usually suggests bearish structure because the market is trading below its medium-term midpoint. It may also act as resistance during downtrends.
Can traders use the Kijun-sen alone?
The Kijun-sen should not be used alone. It is most useful when combined with the full Ichimoku system, including the Tenkan-sen, cloud, and price position. It can guide trend reading, but it does not predict future price movement.