Vistra (VST) is listed on the New York Stock Exchange under the ticker VST and represents a multi-asset generation and integrated retail electricity company. VST stock risks should not be limited to “nuclear power” or “AI data center electricity” tags, but must also include nuclear operations, ERCOT and PJM market exposure, natural gas fuel costs, retail competition, and coal power transition. The long-term contract risks and regional market exposure related to AI data center electricity and PPA also require separate scrutiny.
Users who focus only on electricity demand or single market news risk overlooking nuclear unit availability, ERCOT price volatility, retail customer attrition, and capital expenditure pacing. Vistra’s business model is structured around its generation portfolio, wholesale market, and retail contracts, forming the revenue framework. VST vs CEG vs NextEra vs Duke clarifies the structural differences between Vistra, pure nuclear companies, renewable energy platforms, and regulated utilities.
What should be checked for nuclear operations and capacity factor?
Within Vistra’s portfolio, nuclear units provide baseload and zero-carbon power. The capacity factor—actual generation versus theoretical maximum—is the core metric for nuclear asset utilization. Planned maintenance, unplanned outages, fuel replacement, and compliance events all affect available output.
Nuclear risk is low-frequency but high-impact. When analyzing VST, prioritize nuclear operational stability, focusing on unit availability, maintenance schedules, regulatory inspection outcomes, and license renewal terms.
| Nuclear Operations Metric |
Focus Areas |
Risk Mechanism |
| Capacity Factor |
Actual output vs theoretical maximum for each unit |
Lower utilization directly reduces generation revenue |
| Planned Maintenance |
Refueling shutdowns, annual maintenance windows |
Output and revenue decline temporarily during maintenance |
| Unplanned Outage |
Equipment faults, safety incidents |
May trigger regulatory review and additional costs |
| Licensing & Compliance |
Operating license, safety standards, environmental requirements |
Compliance pressure impacts operational continuity and capital expenditures |
A stable capacity factor does not guarantee market price stability; nuclear outages increase reliance on natural gas peaking and wholesale market pricing.
What variables affect ERCOT/PJM prices and capacity markets?
Vistra’s primary market exposures are ERCOT (Electric Reliability Council of Texas) and PJM (Mid-Atlantic U.S. power market). Wholesale prices reflect real-time supply-demand, fuel costs, and weather; capacity markets indicate the scarcity of reliable future power resources. The two markets differ in rules, price caps, and dispatch logic.
ERCOT operates mainly as an energy market, where price volatility significantly impacts natural gas peaking units and unhedged volumes. PJM features both energy and capacity markets, with capacity auction outcomes affecting compensation for reliable power resources over several years.
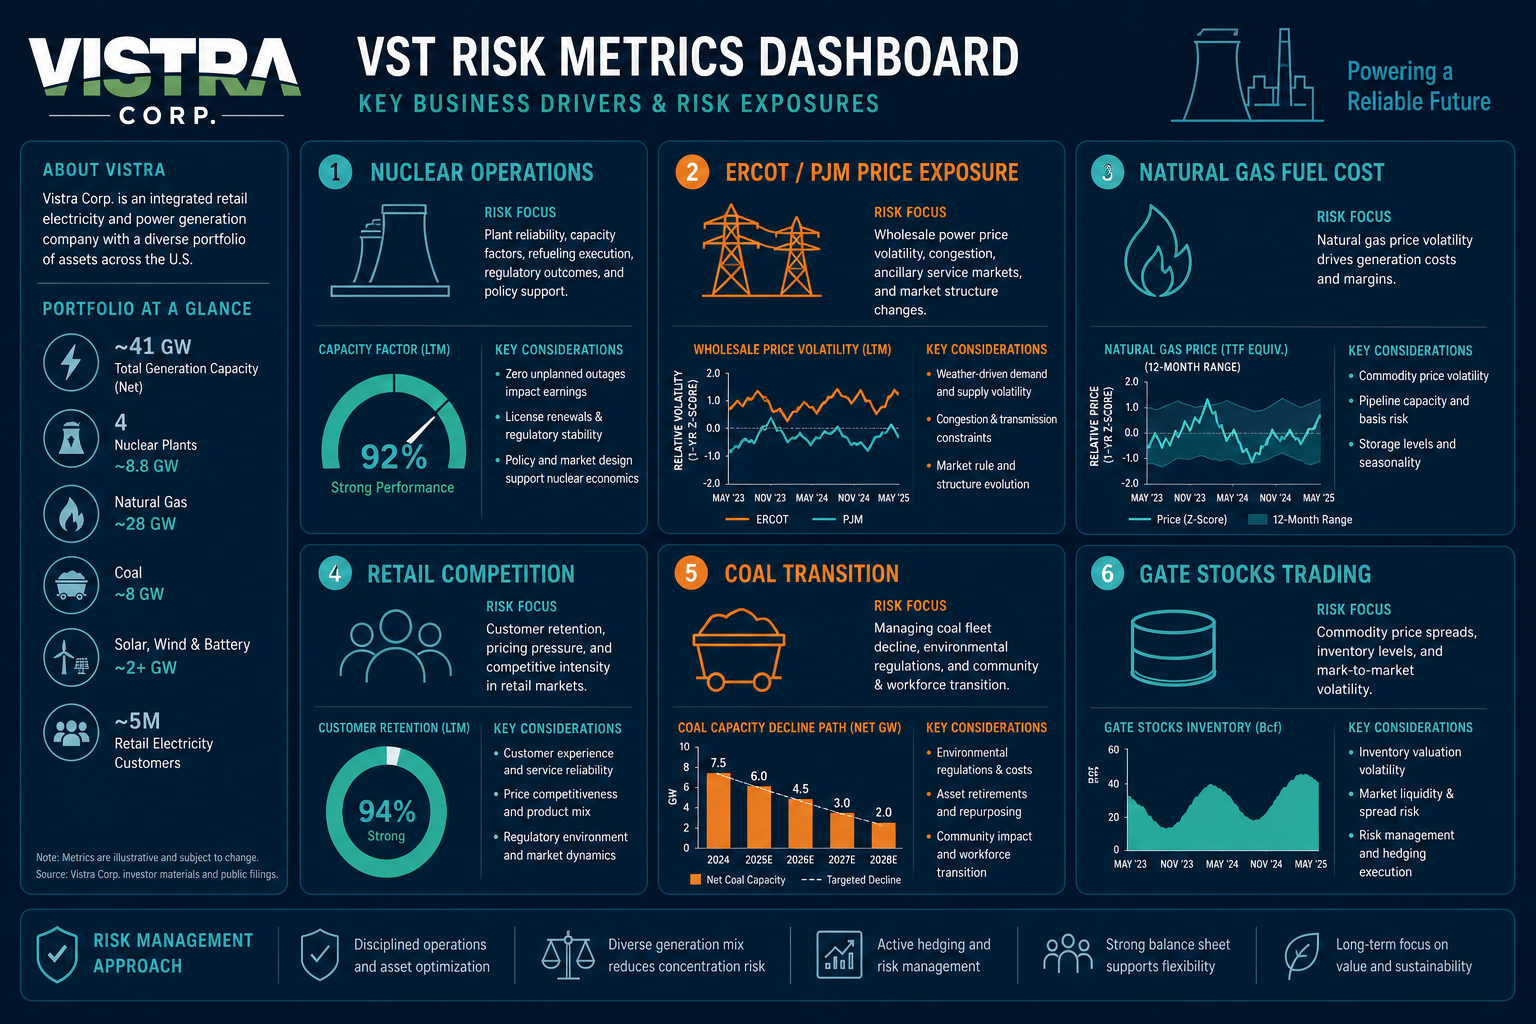
Figure 1. VST risk dashboard: Nuclear operations, ERCOT/PJM price exposure, natural gas fuel, retail competition, and coal transition form the core observation layers.
Key focus areas include capacity auction results, resource certification rules, hedge ratios, and the scale of unhedged exposure. Changes in electricity and capacity prices directly impact generation revenues.
How do natural gas fuel costs affect profitability?
Natural gas units provide peaking and balancing capacity, with fuel cost as a critical determinant of marginal profitability. When benchmark prices like Henry Hub rise, the marginal cost of unhedged natural gas generation increases; if wholesale price gains lag behind fuel costs, generation margins may be compressed. Nuclear delivers low marginal cost baseload, while natural gas offers dispatch flexibility but exposes the company to fuel price volatility. When analyzing, monitor natural gas prices, hedge ratios, unit operating hours, and procurement structure.
What are the risks for retail customers and competitive dynamics?
Vistra supplies residential and commercial customers through brands including TXU Energy, Ambit Energy, and Dynegy. Retail competition is intense; customer acquisition cost, renewal rate, rate structure, and attrition rate directly affect revenue stability. In deregulated markets such as Texas, customers can switch providers after contracts expire.
Wholesale generation and retail contracts naturally hedge each other: when wholesale prices rise, unhedged retail contracts may create cost pressure; when prices fall, fixed-rate contracts may anchor revenue. Key metrics include customer scale, contract duration, rate structure, and competitor dynamics.
What should be monitored for coal power transition and capital expenditure?
Vistra still operates some coal-fired units while advancing coal retirement, natural gas upgrades, energy storage, and solar expansion. Transition factors include retirement timelines, environmental compliance costs, replacement power development, and capital expenditure pacing. Energy storage returns depend on charge-discharge price spreads, ancillary service income, and grid connection; solar projects are constrained by resource and transmission access. Upgrades to nuclear, expansion of storage, and retail system investments require ongoing capital, with debt levels and operating cash flow alignment determining financial flexibility.
What are the trading execution risks for Gate Stocks?
Trading and business risks must be assessed separately. VST trades on Gate Stocks under the U.S. ticker, and it is essential to confirm that the page displays Vistra Corp. Order types, trading hours, fees, liquidity, and USDT funding denomination all impact execution. Buying VST on Gate Stocks covers search, order placement, and position review; use the Gate Stocks page to verify ticker, company name, and trading rules.
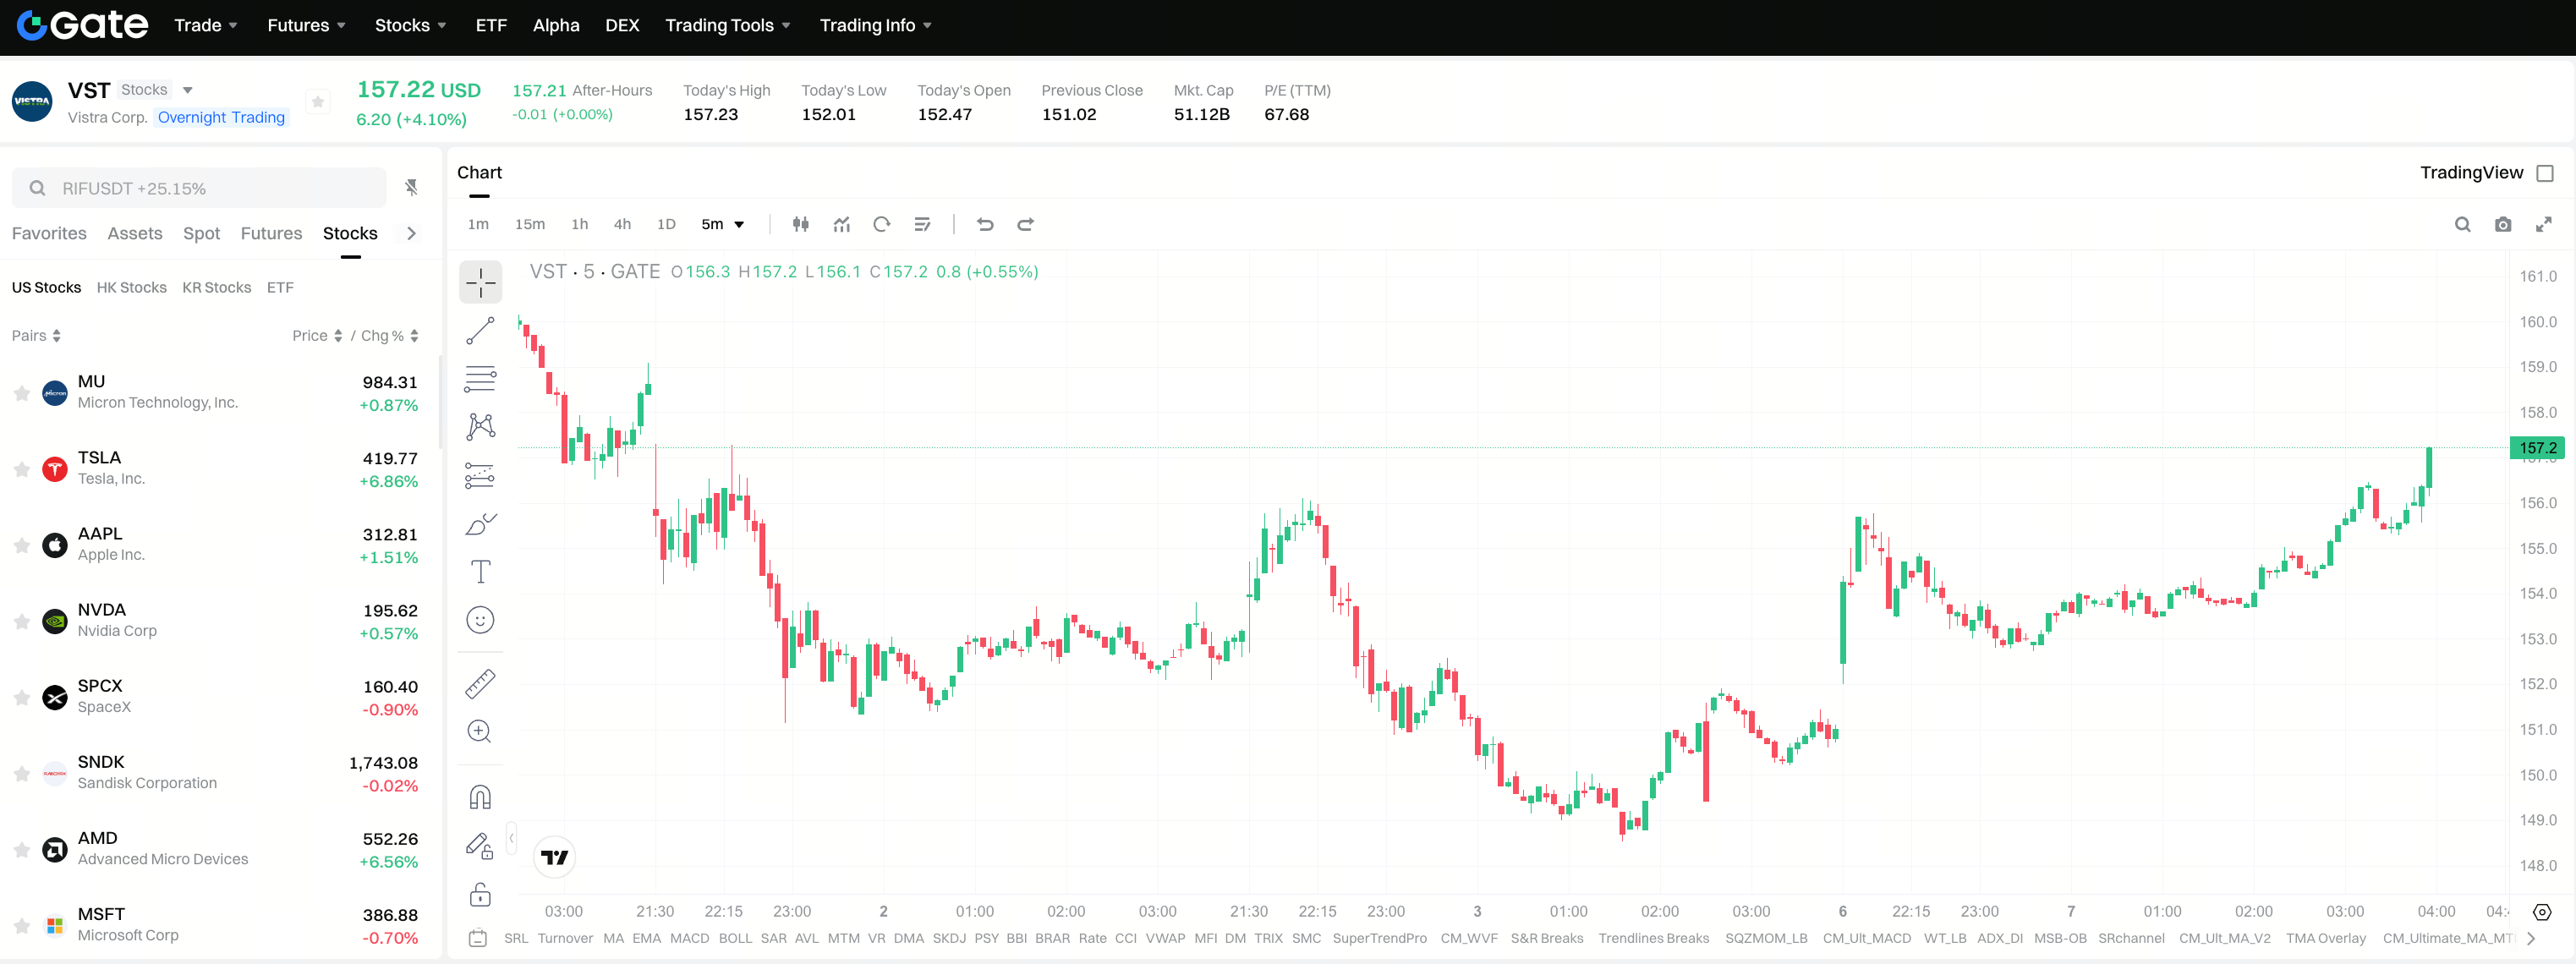
One-table checklist for verification
Breaking VST risk indicators into business, financial, and trading layers enables systematic assessment. These layers are not interchangeable.
| Risk Layer |
Core Metric |
Verification Focus |
| Business—Nuclear |
Capacity factor, maintenance schedule, compliance status |
Is unit availability stable? Are there regulatory events? |
| Business—Market |
ERCOT/PJM wholesale price, capacity auction, hedge ratio |
Scale of unhedged exposure, regional supply-demand and rule changes |
| Business—Retail |
Customer scale, renewal rate, rate structure, competitive landscape |
Is customer attrition and rate pressure intensifying? |
| Business—Transition |
Coal retirement progress, storage/solar returns, grid conditions |
Capital expenditure pacing and asset replacement alignment |
| Financial |
Natural gas fuel cost, operating cash flow, liabilities, capital expenditure |
Fuel cost transmission and financing pressure |
| Trading |
VST ticker, trading hours, fees, USDT denomination, liquidity |
Page main body, order rules, and fund transfers |
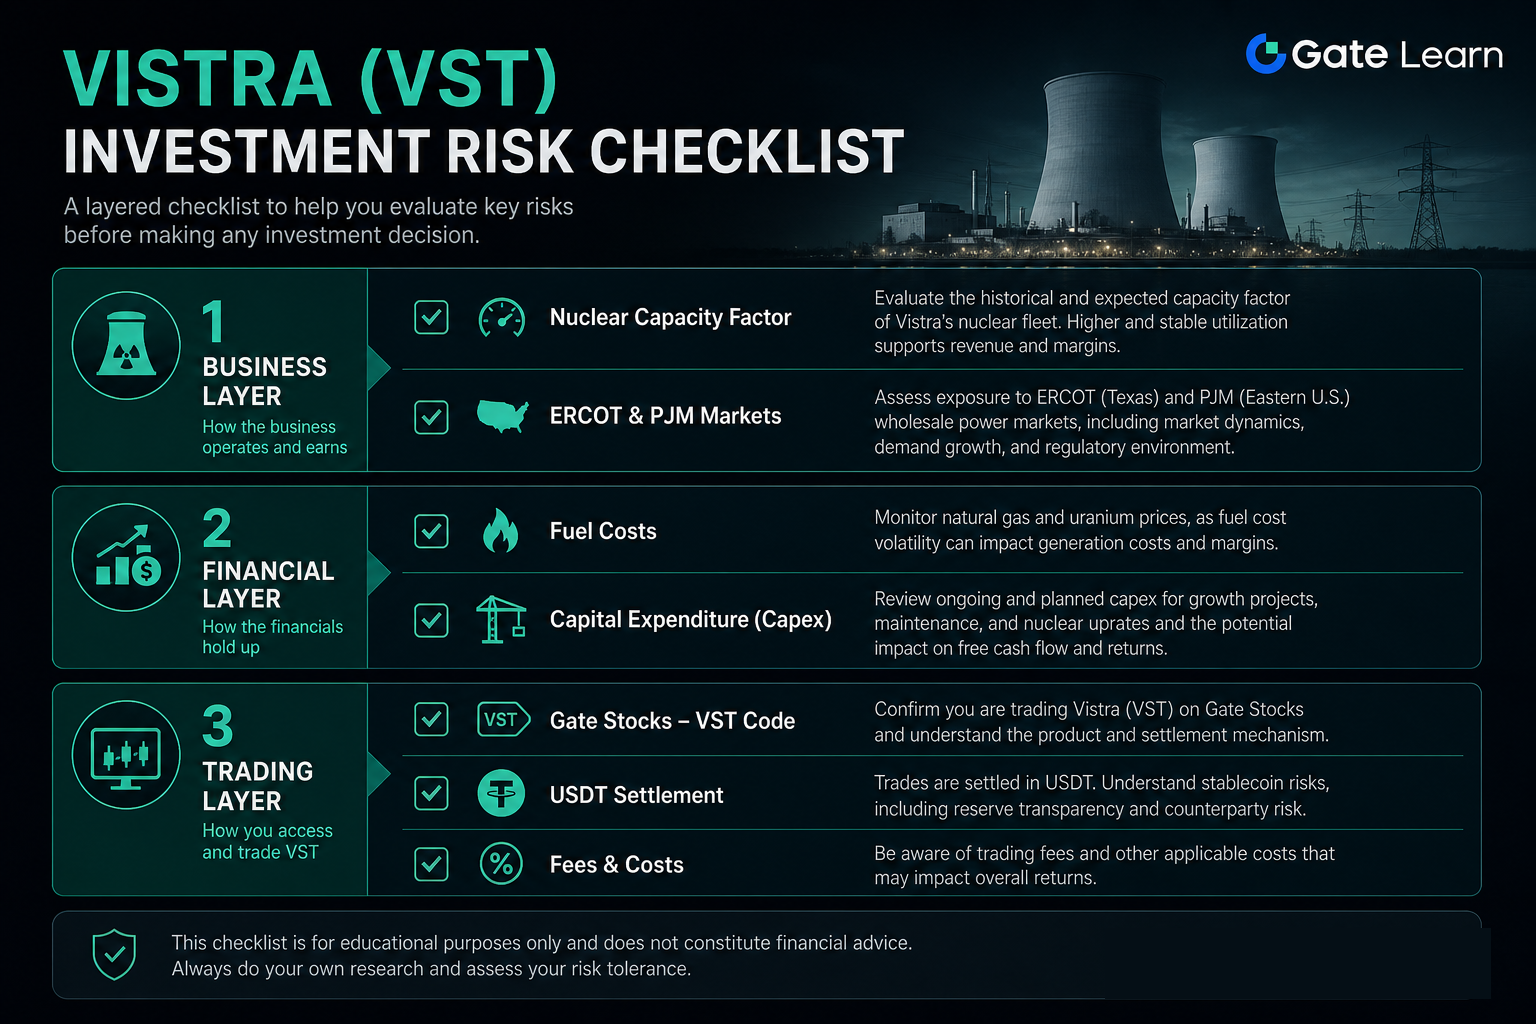
Figure 2. VST risk indicator three-layer verification framework: business, financial, and trading layers correspond to distinct risk sources.
First, confirm the Vistra Corp entity, then separately check asset operations, power markets, retail competition, and platform trading rules.
Summary
VST stock risk indicators should be built around nuclear operations and capacity factor, ERCOT and PJM price and capacity markets, natural gas fuel costs, retail customer competition, coal power transition and capital expenditure, and Gate Stocks trading execution. As a multi-asset generation and integrated retail electricity company, Vistra’s revenue is exposed to wholesale markets, fuel costs, and retail contracts. Before trading, confirm the ticker and entity, then cross-check business, financial, and trading metrics to avoid relying on a single narrative instead of multidimensional analysis.
FAQ
What should be checked for nuclear operations and capacity factor?
Capacity factor measures the ratio of actual output to theoretical maximum for nuclear units and is the core metric for nuclear asset utilization. Planned maintenance, unplanned outages, fuel replacement, and compliance events all affect available output. Low-frequency, high-impact events must be prioritized in the checklist.
Why does ERCOT price volatility significantly impact VST?
Vistra owns large-scale natural gas, as well as nuclear and storage assets in ERCOT. ERCOT operates mainly as an energy market, where real-time price volatility directly affects marginal revenue for unhedged generation. Extreme weather, peak demand, and fuel cost changes can amplify profit transmission.
How do natural gas fuel costs affect Vistra’s profitability?
Natural gas units provide peaking capacity; when benchmark prices like Henry Hub rise, the marginal cost of unhedged generation increases. If wholesale price gains lag behind fuel costs, generation margins may be compressed. Key metrics include hedge ratios and unit operating hours.
What are the risk signals for retail customer competition?
Markets served by TXU Energy and other brands are highly competitive. Customer acquisition cost, renewal rate, rate structure, and attrition rate are core metrics. When wholesale prices rise, unhedged retail contracts may create cost pressure; when prices fall, fixed-rate contracts may anchor revenue.
What key metrics should be monitored when analyzing VST?
Monitor nuclear unit capacity factor, ERCOT/PJM wholesale price and capacity auction results, natural gas fuel cost and hedge ratio, retail customer scale and renewal rate, as well as capital expenditure and operating cash flow. Business metrics and Gate Stocks trading execution risks should be assessed separately.