Tinjauan Pasar: BTC Memasuki Fase Pemulihan Struktural
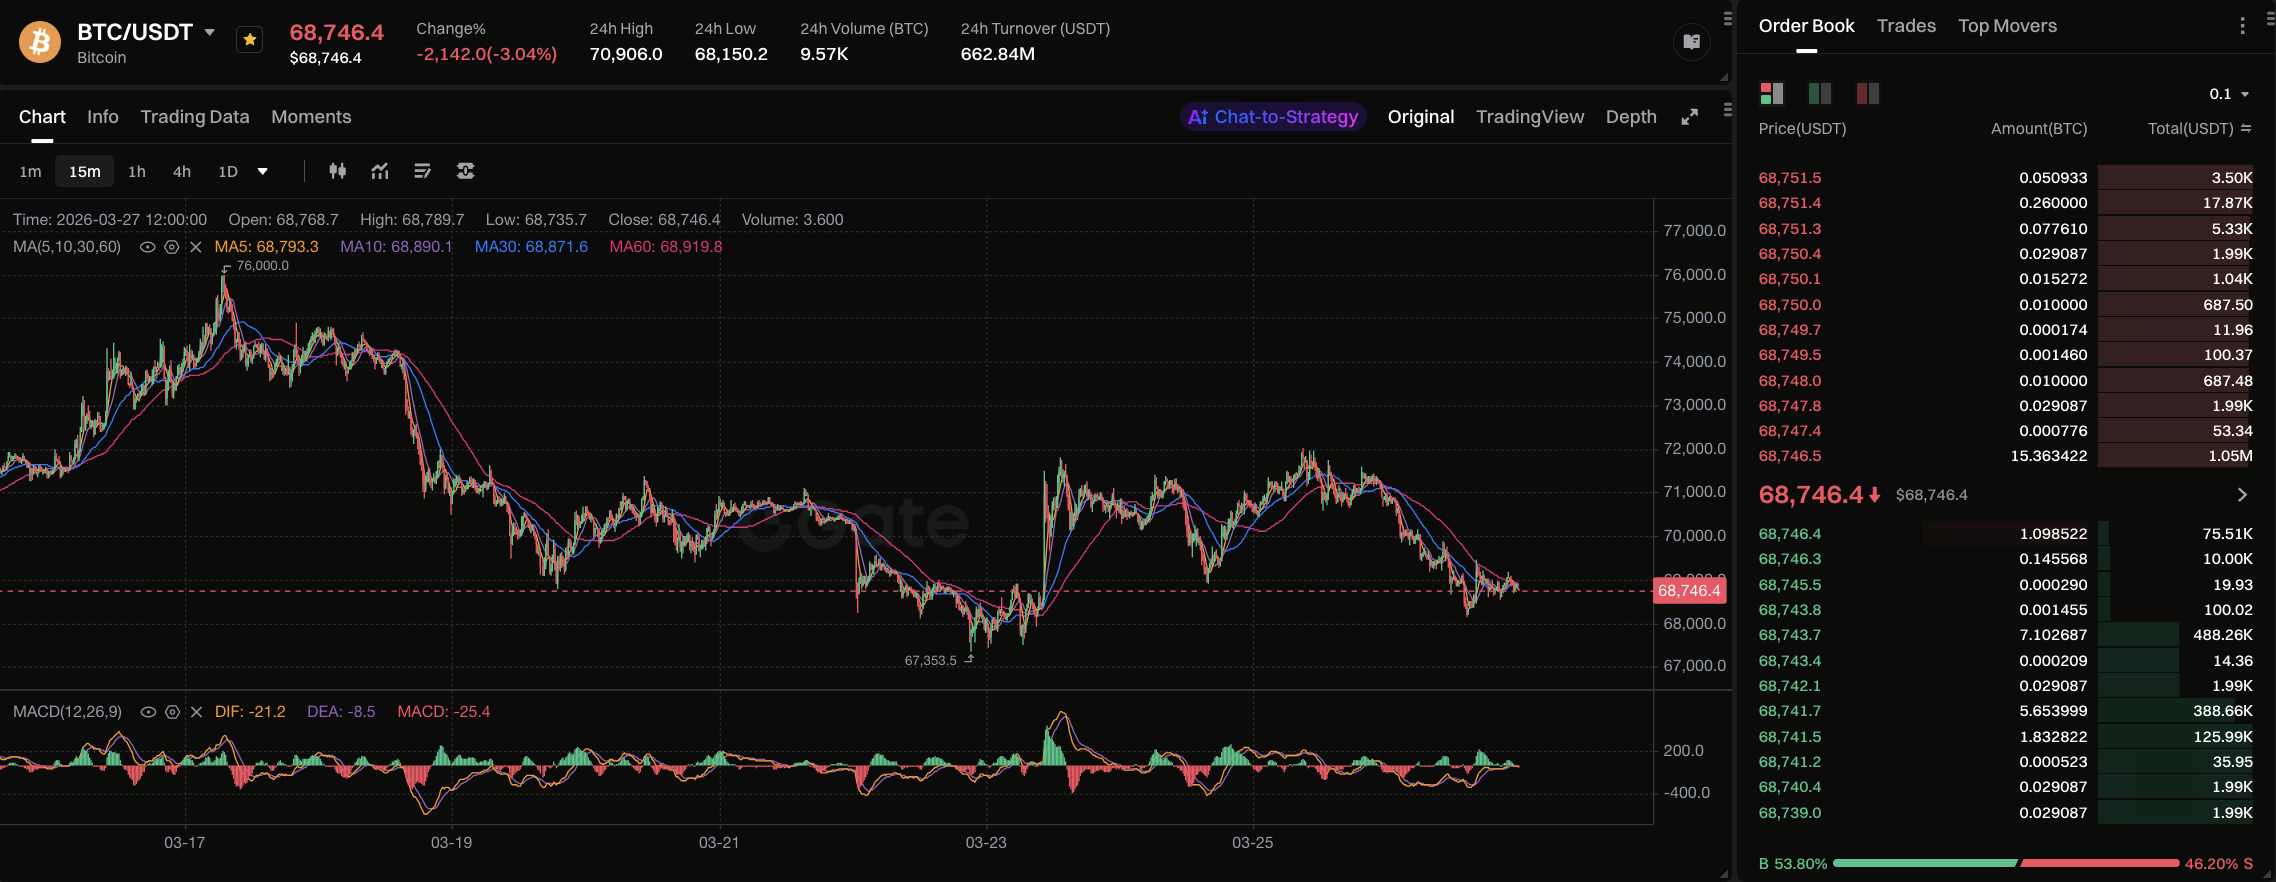 Sumber gambar: Halaman Pasar Gate
Per 27 Maret 2026, Bitcoin diperdagangkan di kisaran $69.000. Setelah sempat anjlok ke $67.000, harga mulai stabil secara bertahap. Dari sisi teknikal, pasar mulai membentuk higher low—indikasi awal klasik pemulihan tren. Namun, berbeda dari fase awal bull market pada umumnya, rebound kali ini tidak diiringi volume maupun arus modal signifikan, sehingga momentum kenaikan masih kurang kuat.
Menurut Glassnode, kondisi pasar saat ini paling tepat digambarkan sebagai transisi dari “penurunan satu arah” menuju fase “penyeimbangan ulang pasokan-permintaan.”
Ciri-ciri utama fase ini meliputi:
- Harga tidak lagi turun tajam, tetapi pergerakan naik masih tidak konsisten
- Sentimen pasar beralih dari kepanikan menjadi kehati-hatian
- Modal berpindah dari penarikan ke posisi menunggu
Singkatnya, pasar telah “berhenti berdarah,” namun belum masuk ke tahap pemulihan pertumbuhan.
Analisis Data On-Chain: Tekanan Jual Mereda, Permintaan Belum Terbentuk
Data on-chain memberikan wawasan penting terkait struktur pasar saat ini. PnL Tidak Terealisasi menunjukkan kerugian belum terealisasi masih lebih dari 15% kapitalisasi pasar—angka yang lazim pada fase akhir bear market—menandakan tekanan pasar yang masih berlangsung.
Namun, tekanan ini belum berubah menjadi kepanikan ekstrem. Misalnya, saat kejatuhan FTX, pasar mengalami aksi jual kapitulasi massal, sedangkan saat ini masih berupa proses “de-risking yang teratur.” Artinya:
- Pasar belum sepenuhnya bersih
- Investor masih menunggu arah yang lebih jelas
Di sisi lain, metrik keuntungan terealisasi turun tajam—lebih dari 90% dari puncak siklus. Pergeseran ini memiliki dua sisi:
- Sisi positif: Posisi untung sudah banyak terealisasi, tekanan jual menurun signifikan
- Sisi negatif: Likuiditas on-chain menipis dan aktivitas perdagangan pasar melemah
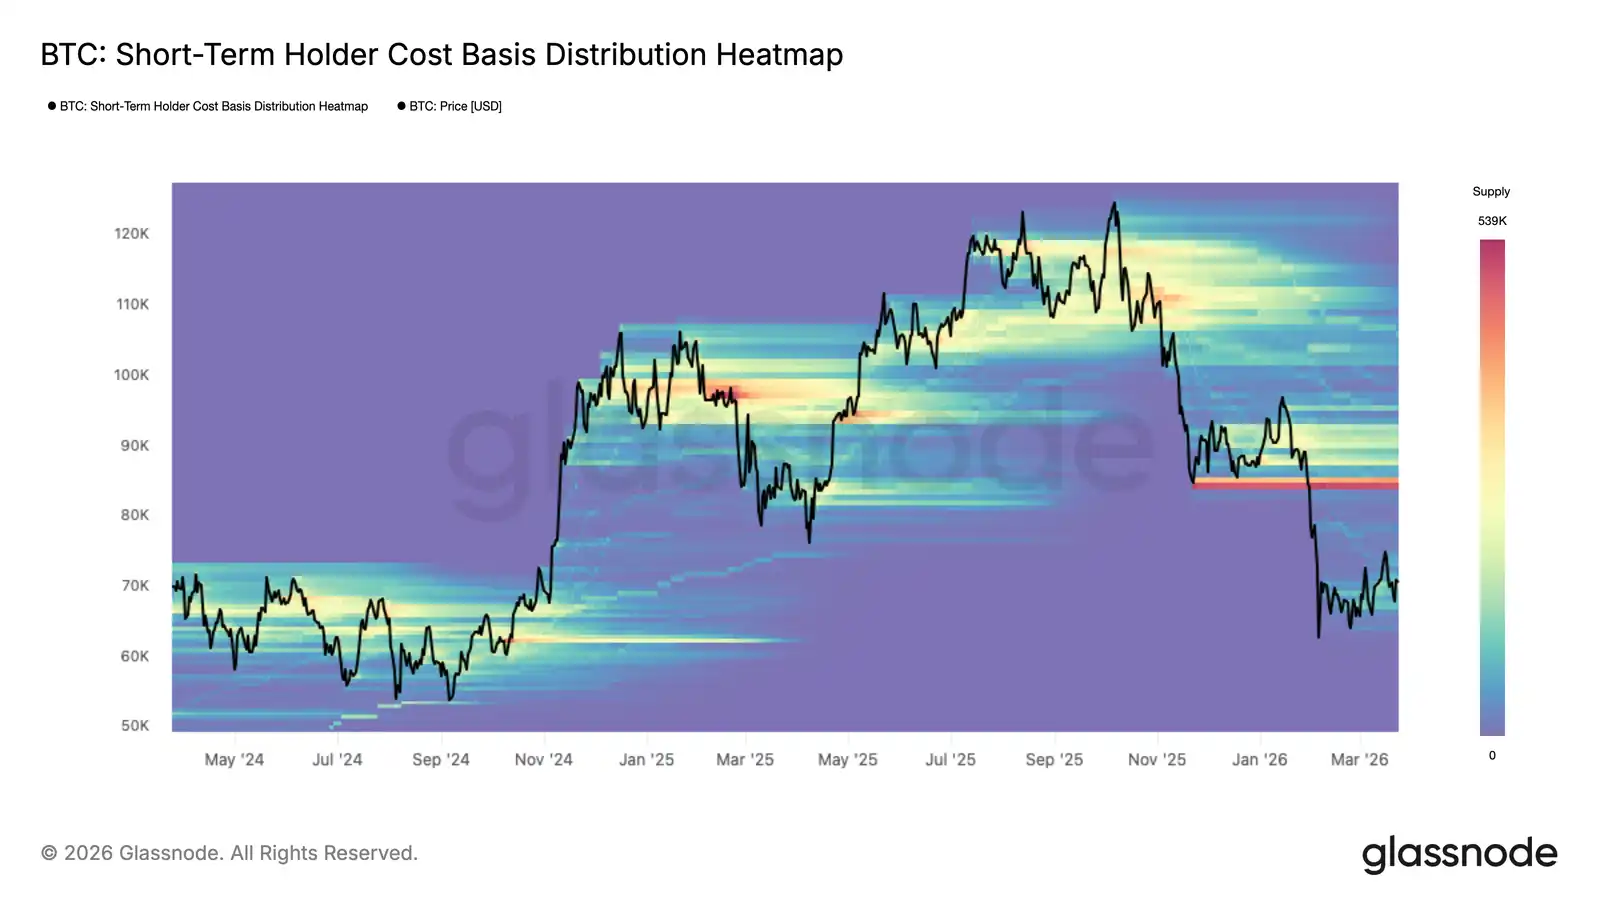
Distribusi biaya pemegang jangka pendek juga mengungkapkan:
- Sekitar $70.000 menjadi zona support saat ini
- Sekitar $82.000 sebagai resistance menengah
- $93.000–$97.000 merupakan zona pasokan padat
Ini menandakan pasar telah membentuk rentang perdagangan menengah yang jelas, namun untuk breakout dibutuhkan permintaan jauh lebih besar.
Arus ETF: Pergeseran Marginal Perilaku Institusi
Arus modal ETF menjadi salah satu variabel terpenting di pasar. Baru-baru ini, institusi seperti BlackRock dan Fidelity Investments beralih dari net outflow ke net inflow.
Pergeseran ini menandakan bahwa:
- Institusi mulai beralih dari menghindari risiko ke alokasi secara hati-hati
- Keuangan tradisional kembali melirik pasar kripto
Namun, perubahan ini masih tahap awal dan terbatas:
- Besaran inflow kecil
- Durasi singkat
- Belum terbentuk tren pembelian berkelanjutan
Dengan demikian, arus ETF saat ini dapat dirangkum sebagai:
- Arah: Positif
- Besaran: Masih kurang
Secara historis, hanya inflow berkelanjutan dan berskala besar—bukan kenaikan marginal jangka pendek—yang mampu mendorong BTC ke tren utama.
Tiga Hambatan Utama: Faktor Struktural Pembatas Potensi BTC
Meski ada pemulihan, tiga hambatan utama masih membayangi reli saat ini.
Pertama: Tekanan pasokan di atas. Zona $82.000 dan $90.000+ menyimpan volume perdagangan historis besar. Ketika harga mencapai level ini, banyak investor memilih keluar di titik impas, menciptakan tekanan jual yang persisten. Pasokan struktural ini menjadi hambatan utama setiap rebound.
Kedua: Volume perdagangan spot rendah. Masalah utama bukan pada harga, melainkan volume. Dalam tren naik sehat, harga dan volume naik bersama. Namun saat ini:
- Harga rebound
- Volume perdagangan belum meningkat signifikan
Perbedaan ini berarti:
- Pembelian didominasi modal jangka pendek
- Modal jangka panjang masih wait and see
Reli tanpa dukungan volume biasanya tidak bertahan lama.
Ketiga: Pasar derivatif masih bearish. Secara struktural:
- Funding rate tetap negatif
- Open interest rendah
- Modal leverage belum bertambah
Sinyal-sinyal ini menunjukkan modal utama tetap defensif—bahkan ada posisi net short. Ini sangat berbeda dengan dinamika “ekspansi leverage + dominasi long” di awal bull market.
Derivatif dan Opsi: Sikap Hati-hati Jangka Pendek, Divergensi Jangka Panjang
Pasar opsi memberikan gambaran sentimen yang detail. Volatilitas tersirat tetap rendah, menandakan pasar menunggu katalis baru untuk repricing risiko. Sementara itu, 25 Delta skew menunjukkan permintaan put masih dominan—investor tetap waspada terhadap risiko penurunan jangka pendek.
Untuk jangka lebih panjang, struktur pasar mulai berbeda:
- Jangka pendek: Bearish, defensif
- Jangka panjang: Netral hingga agak bullish
Artinya:
- Pasar kurang percaya diri dalam jangka pendek
- Namun, tesis bullish jangka panjang tetap terjaga
Selain itu, jatuh tempo opsi dan posisi gamma market maker dapat memengaruhi pergerakan harga jangka pendek. Dalam kondisi likuiditas rendah, arus ini bisa memperbesar volatilitas, namun tidak mengubah tren menengah atau panjang.
Tiga Syarat Utama untuk Reli BTC Sebenarnya
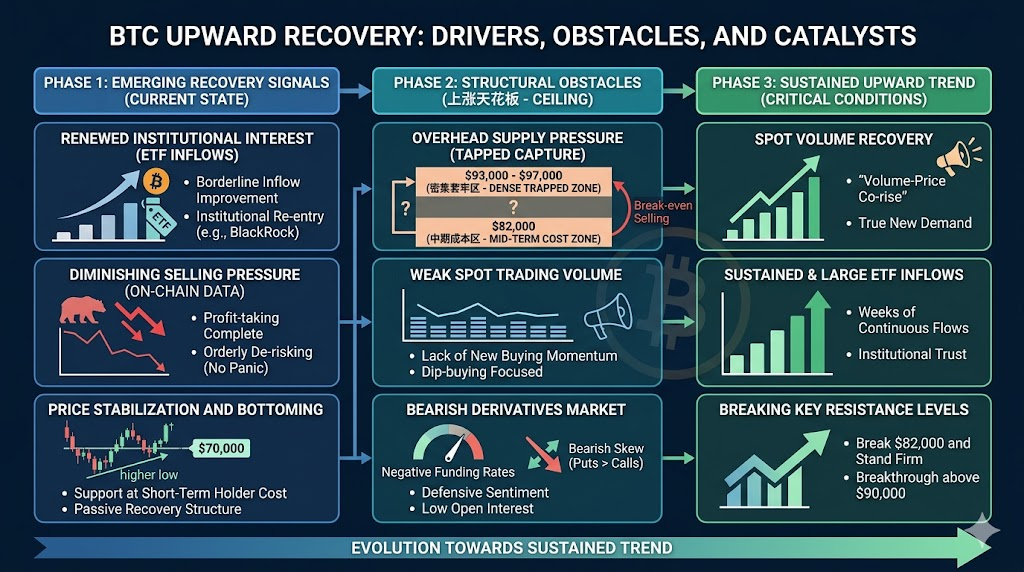
Agar Bitcoin benar-benar memasuki tren naik berkelanjutan, setidaknya tiga syarat utama harus terjadi bersamaan:
-
Volume perdagangan spot bertambah konsisten
- Kenaikan harga dan volume adalah ciri tren nyata
- Menandakan permintaan riil kembali
-
Net inflow ETF berkelanjutan
- Inflow konsisten selama berminggu-minggu atau berbulan-bulan
- Skala bertambah, membentuk tren
-
Menembus dan bertahan di zona resistance utama
- Menembus dan bertahan di atas $82.000
- Menyerap pasokan di atas $90.000
Ketiganya mencerminkan logika yang sama: modal baru terus-menerus masuk ke pasar.
Likuiditas Makro: Variabel Inti Penggerak Siklus Pasar
Secara makro, Bitcoin tetap menjadi aset yang sangat sensitif terhadap perubahan likuiditas global. Arah kebijakan Federal Reserve menjadi variabel kunci.
Mekanisme transmisi meliputi:
- Suku bunga lebih rendah → biaya modal turun → daya tarik aset berisiko meningkat
- Ekspansi likuiditas → alokasi institusi bertambah → inflow ETF
- Dolar melemah → arus modal ke aset alternatif (termasuk BTC)
Dengan demikian, apakah siklus ini benar-benar menyala bergantung tidak hanya pada struktur on-chain dan pasar, tetapi juga pada apakah likuiditas makro memasuki fase pelonggaran.
Kesimpulan: Pemulihan Awal, Bukan Pasar Tren
Data on-chain, arus ETF, dan derivatif menunjukkan adanya perbaikan, namun secara keseluruhan, Bitcoin masih berada di fase “pemulihan awal.”
Ciri pasar saat ini:
- Tekanan jual menurun
- Modal mulai kembali
- Namun permintaan masih kurang kuat
Dalam kondisi ini, harga cenderung bergerak dalam rentang, bukan reli berkelanjutan. Bagi investor, memantau indikator kunci lebih penting daripada sekadar menebak arah harga—misalnya:
- Apakah volume perdagangan bertambah?
- Apakah ETF mengalami net inflow yang stabil?
- Apakah pasar derivatif mulai bullish?
Singkatnya: Bitcoin telah “berhenti turun,” namun untuk memasuki reli sejati masih dibutuhkan “arus modal baru yang berkelanjutan dan berskala besar.”