Futures
Access hundreds of perpetual contracts
TradFi
Gold
One platform for global traditional assets
Options
Hot
Trade European-style vanilla options
Unified Account
Maximize your capital efficiency
Demo Trading
Introduction to Futures Trading
Learn the basics of futures trading
Futures Events
Join events to earn rewards
Demo Trading
Use virtual funds to practice risk-free trading
Launch
CandyDrop
Collect candies to earn airdrops
Launchpool
Quick staking, earn potential new tokens
HODLer Airdrop
Hold GT and get massive airdrops for free
Pre-IPOs
Unlock full access to global stock IPOs
Alpha Points
Trade on-chain assets and earn airdrops
Futures Points
Earn futures points and claim airdrop rewards
Is ETH's sideways movement an illusion? The key turning point window on April 19th—will it lead to a main rally or a sharp decline?
Current Price: 2342.31
From the overall trend perspective, ETH is currently in a critical stage of “high-level compression + emotional divergence.” On the surface, it looks like range-bound movement, but in reality, this is the final shakeout before the main players choose a direction. Next, we’ll break down the structure in depth across multiple time cycles.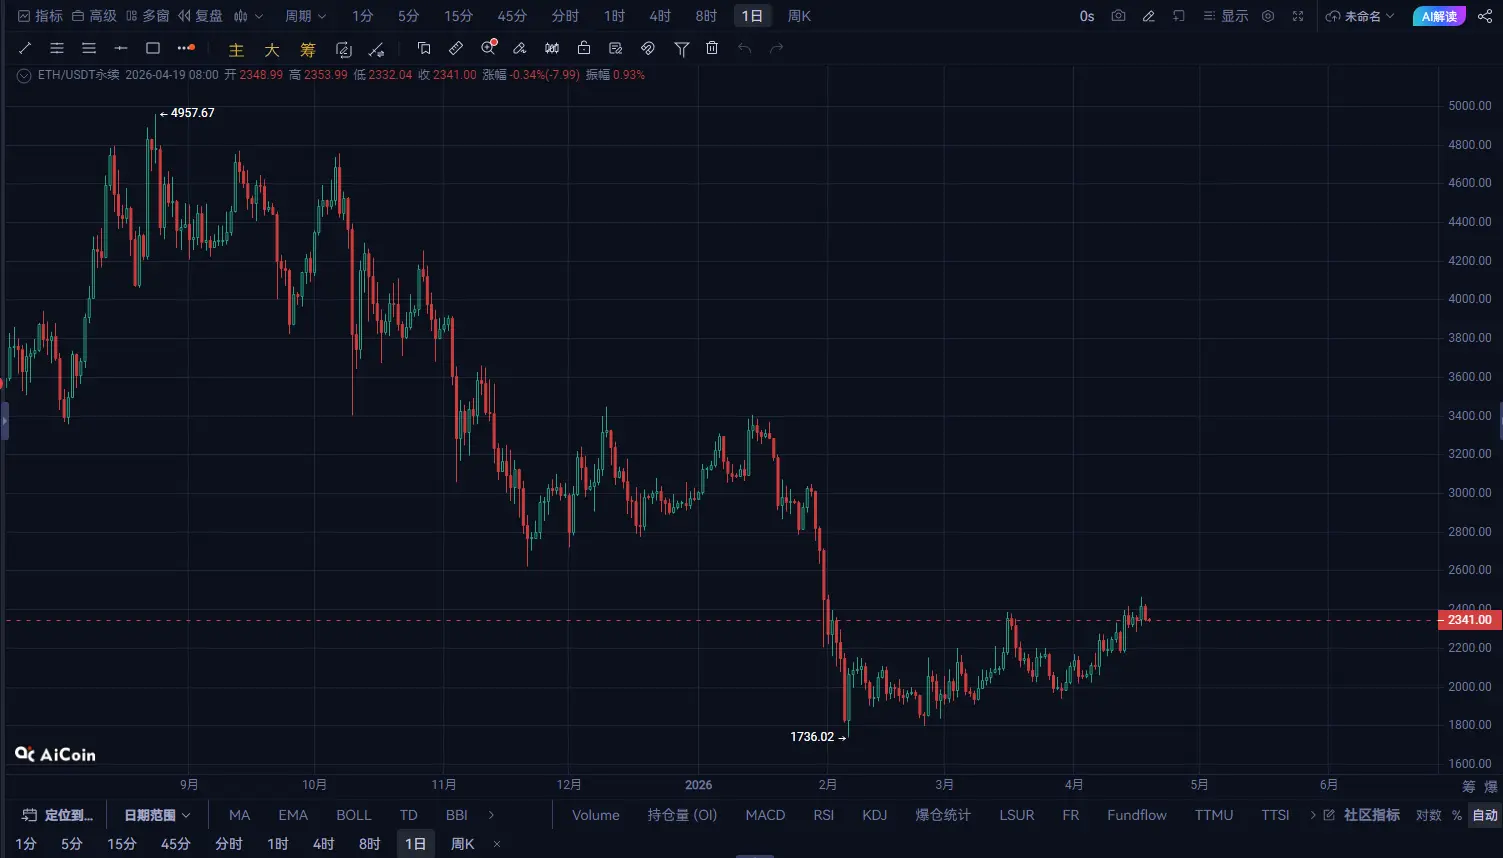
The daily chart still maintains a medium-term uptrend structure, but the details have begun to change:
Consecutive days closing as doji stars / small-bodied candlesticks → Bull-bear divergence intensifies
MACD red histogram continues to shorten, showing signs of a bearish divergence at the top
RSI falls from the high level to around 60 → Bullish momentum weakens
Key levels:
Strong support: 2250
Key defense level: 2180
Resistance above: 2450
Conclusion: The daily timeframe is “the trend hasn’t broken, but the rally is paused,” entering a buildup/consolidation phase.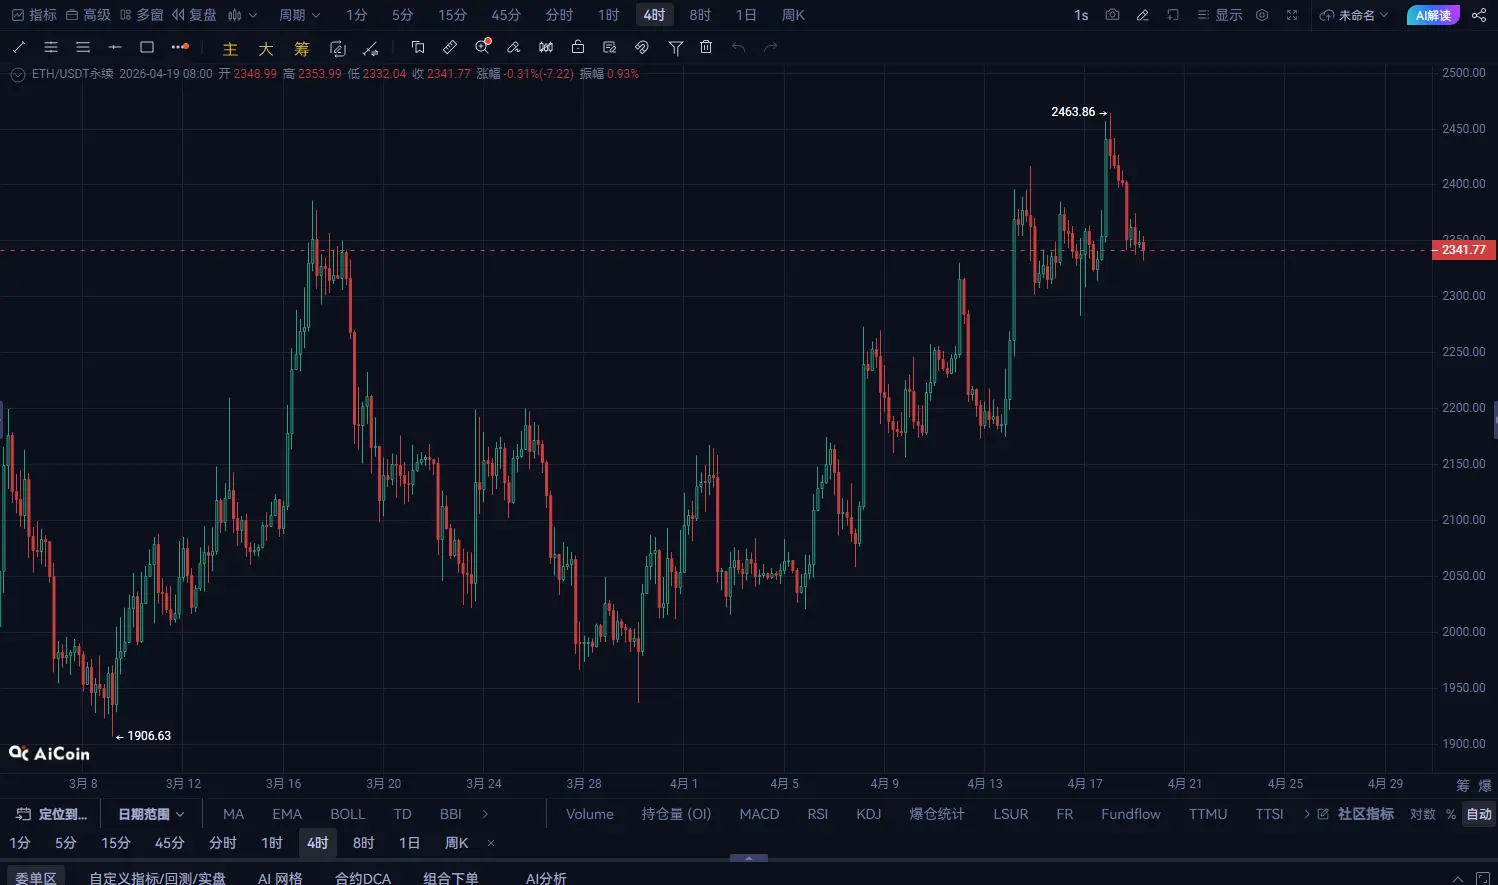
The 4-hour structure is very important. It has already formed a clear converging pattern:
The swing highs gradually trend lower
The swing lows gradually trend higher
This is a typical “volatility compression → waiting for an expansion/breakout.”
Technical signals:
The Bollinger Bands are extremely tight (a turning-point signal)
MACD repeatedly oscillates around the 0 axis → No clear trend
Trading volume continues to shrink → The main players clearly control the market
Key breakout levels:
Break upward: 2400-2450
Break downward: 2280
Once a breakout occurs with increased volume, the market will enter a one-direction phase.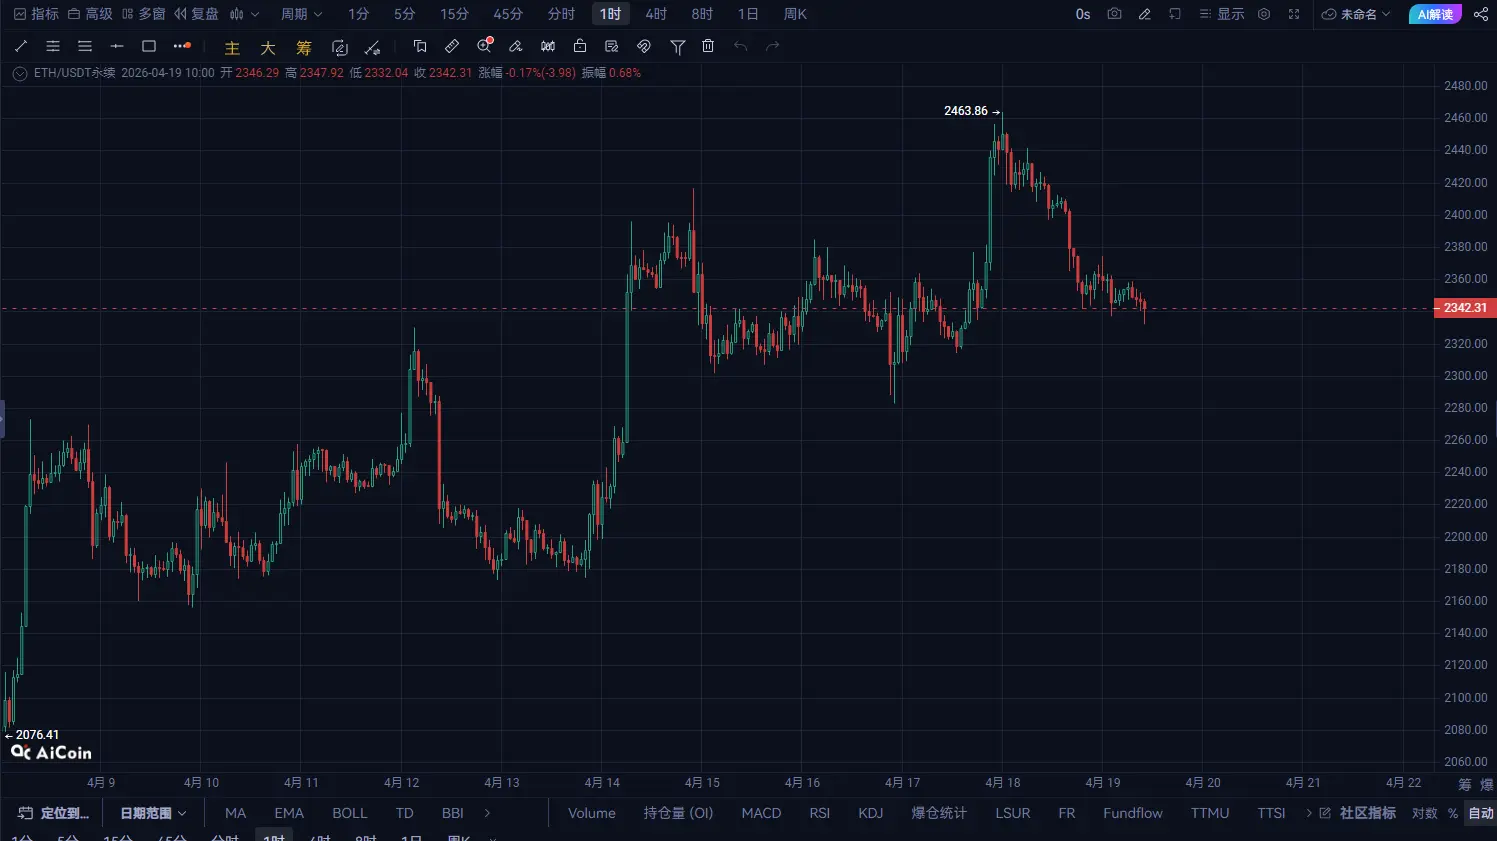
From the short-cycle perspective, the market has already started to lean bearish:
Price breaks below the short-term moving average system (MA20/MA60)
The rebound strength is weak, showing a “drifting-lower structure”
Bearish MACD energy is gradually expanding
Short-term key levels:
Resistance: 2360-2380
Support: 2300
Current rhythm: Rebounds face sell pressure—bears are gradually probing the liquidity below
The three timeframes are showing clear confluence:
Daily: Uptrend is slowing down
4-hour: Extreme compression
1-hour: Short-term turning bearish
This usually means: The market is entering the “eve of a trend reversal.”
Trading strategy (core takeaways)
Short-term trading strategy
Lightly short in the 2360-2380 zone
Stop-loss: above 2450
Targets: 2300 / 2250
Logic: 1-hour weakness continues + 4-hour has not broken through
Only trade what’s confirmed—don’t guess:
Break out with volume above 2450 → go long (look toward 2550+)
Break down below 2280 → go short (look toward 2200)
This is not suitable for heavy position entries right now. You must wait until the direction becomes clear:
Bullish: wait for the breakout before chasing
Bearish: wait for the breakdown before following through
This kind of “compressed market” is most prone to bait both bulls and bears:
Frequent fake breakouts
Higher probability of stop-hunt/poke-through (intraday wicks)
Be sure to use a stop-loss and control position size.