
Zcash and Shiba Inu are two totally different kinds of projects, and that is being more and more evident.
Zcash is more focused on the serious side of crypto, like privacy, infrastructure, tools, etc. It even raised more than $25 million and is moving towards an institutional mining model.
Shiba Inu is on a different path. It’s trying to move beyond being just a meme coin by building out its Shibarium network. There have been upgrades there, and big holders seem to be quietly stacking tokens, even if some of the activity looks a bit inflated.
In simple terms, they’re both growing, just in totally different ways.
- Zcash (ZEC) Chart Analysis
- DeepSeek AI Price Prediction for Zcash in April 2026
- Shiba Inu (SHIB) Chart Analysis and DeepSeek AI Price Prediction
- DeepSeek AI Price Prediction for Shiba Inu in April 2026
Zcash (ZEC) Chart Analysis
Looking at the daily chart for ZEC, the price sits at $38.92, showing a 5.39% gain with an amplitude of 6.53%.
This is a far cry from the $226 price point discussed earlier in the text, but the chart shows that the Zcash price is trading at much lower levels, which is in line with its volatility and the need to consider the current market data.
The RSI indicators point to RSI1 at 45.41, RSI2 at 41.97, and RSI3 at 44.63. All three RSI indicators point to a neutral or bearish trend.
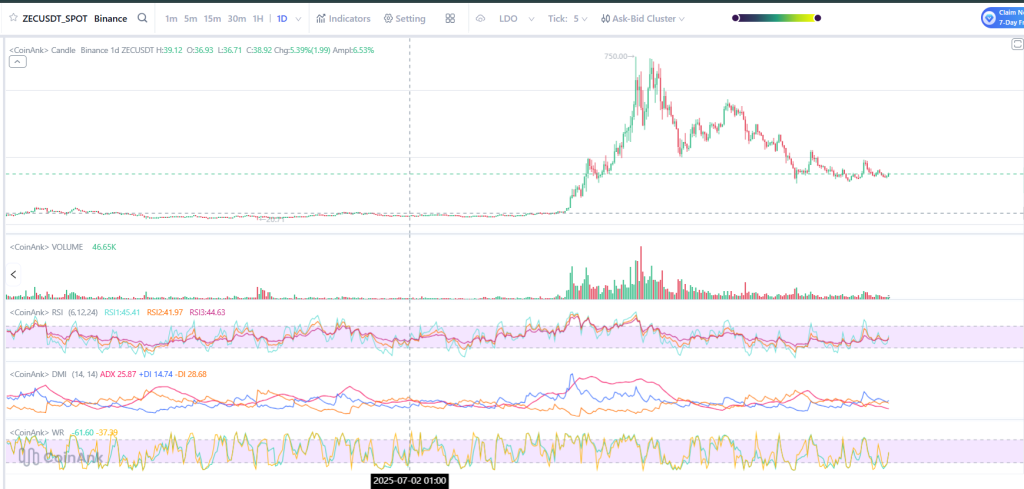
Source: Coinank
The DMI indicator indicates ADX is at 25.87, which is an indication of a trending market. However, -DI is also higher than +DI, with -DI being 28.68 and +DI being 14.74. This is an indication that bearish pressure is dominating the current trend.
The Williams %R is -61.60 and -37.39. This indicates that the asset is almost oversold, but it is also in neutral. This is an indication that the selling pressure may be waning.
DeepSeek AI Price Prediction for Zcash in April 2026
The price of ZEC, according to DeepSeek AI, is expected to trade in the range of $215 to $250 for most of April, with a 30% probability of a bullish breakout to $280.
The technical analysis of the market indicates that there is a momentum shift to a bullish market, with a break above $235 expected to see the price trade to $250 to $260.
The bearish scenario, which accounts for 15%, could be due to delays in the launch of the CashZ wallet, which could see the price trade towards the support of $200.
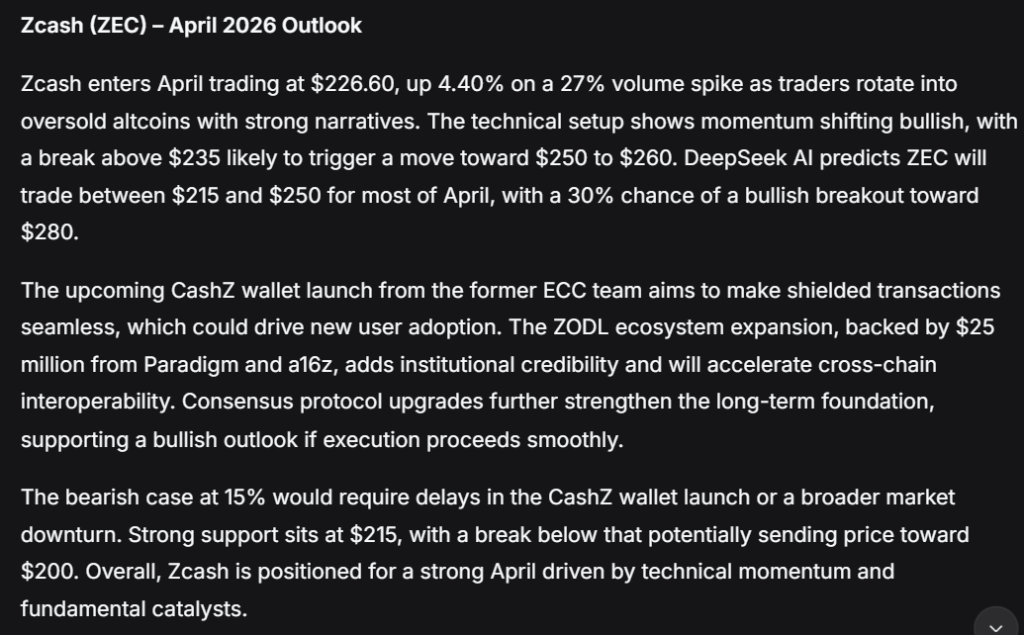
Source: Deepseek
Shiba Inu (SHIB) Chart Analysis and DeepSeek AI Price Prediction
We took a look at the daily chart for SHIB and the price sits at $0.00001482, showing a 5.73% decline with an amplitude of 9.29%. This is further evidence of the volatility in the market due to infrastructure upgrades on Shibarium.
The DMI indicator shows that the ADX is at 24.05, with +DI at 23.91 and -DI at 17.66. This is interesting because we see that +DI is above -DI, indicating that bullish momentum is now taking control of the market, which had been dominated by bearish momentum.
_****Crypto Price Prediction for Today, March 30: Ethereum (ETH), XRP, Jupiter (JUP)**
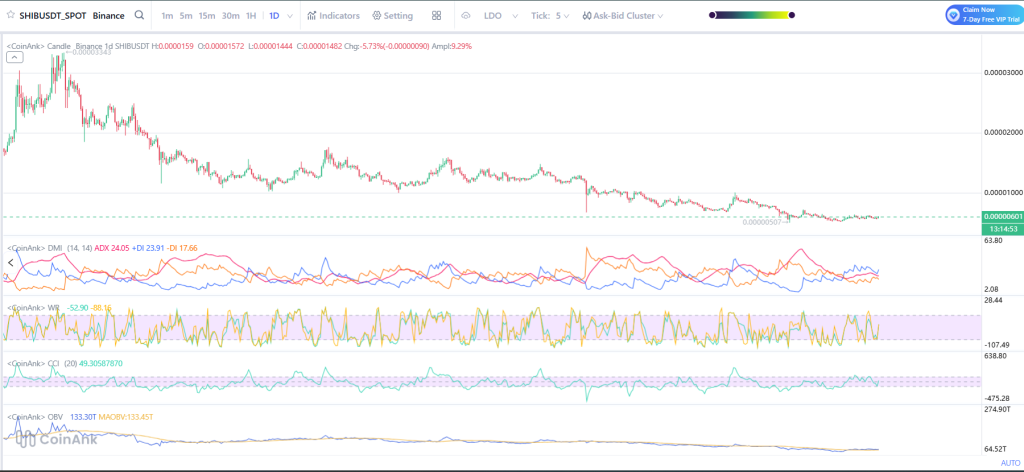
Source: Coinank
The CCI (20) stands at 49.31, and this reading is near the +100 level, where a strong bullish indication will be seen. This shows that there is a build-up of momentum but not yet in the overbought zone.
OBV shows a reading of 133.30T, while the MAOBV stands at 133.45T. This shows that the volume of buyers is lower than the moving average.
DeepSeek AI Price Prediction for Shiba Inu in April 2026
DeepSeek AI predicts the SHIB price will likely range between $0.0000058 and $0.0000068 in April, with a 30% chance of a bullish push toward $0.0000075.
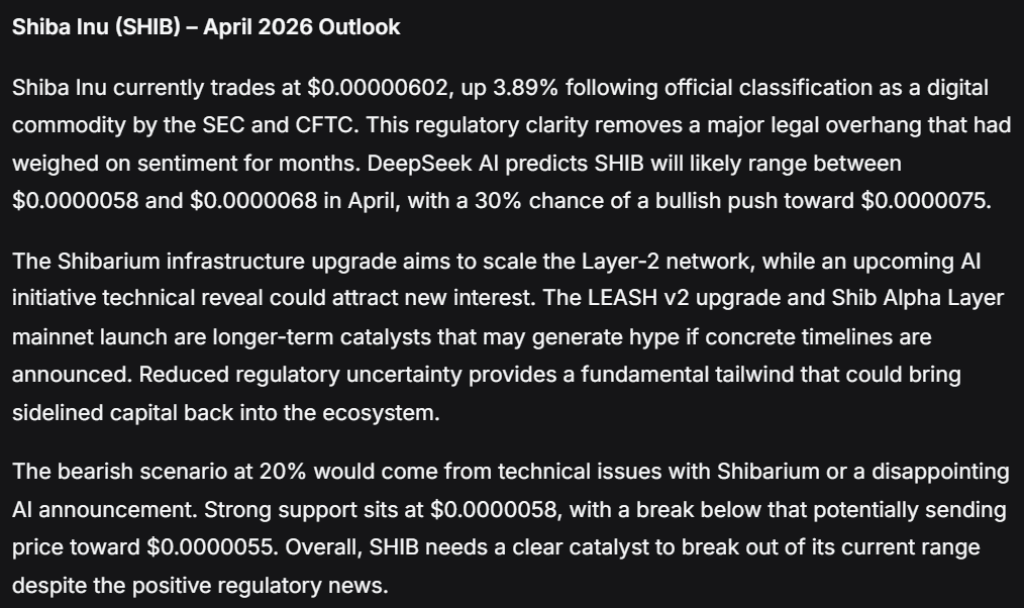
Source: Deepseek
The regulatory clarity from the SEC and CFTC classification removes a major legal overhang, while Shibarium upgrades and the upcoming AI initiative could serve as catalysts.
The bearish scenario at 20% would come from technical issues with Shibarium or a disappointing AI announcement, which could send price back toward $0.0000055 support.
Disclaimer: The information on this page may come from third parties and does not represent the views or opinions of Gate. The content displayed on this page is for reference only and does not constitute any financial, investment, or legal advice. Gate does not guarantee the accuracy or completeness of the information and shall not be liable for any losses arising from the use of this information. Virtual asset investments carry high risks and are subject to significant price volatility. You may lose all of your invested principal. Please fully understand the relevant risks and make prudent decisions based on your own financial situation and risk tolerance. For details, please refer to
Disclaimer.
