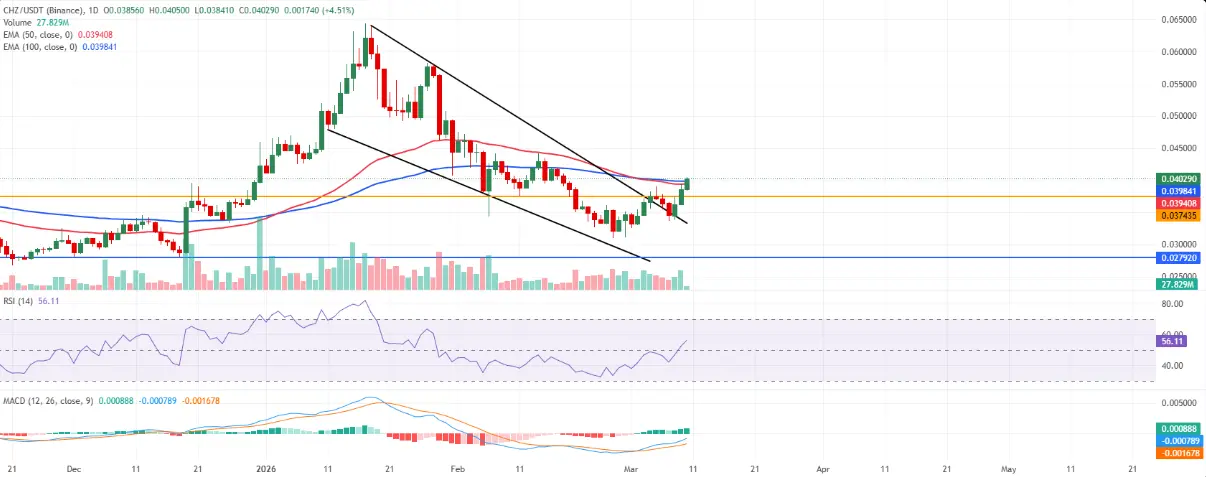
Chiliz (CHZ) is showing notable signs of recovery as it trades steadily above the $0.040 USD level on Tuesday. The upward momentum emerged after the altcoin broke out of a falling wedge pattern — a technical structure often indicating a potential reversal to the upside.
On-chain data still presents a somewhat mixed picture, but the overall trend is leaning slightly positive. Meanwhile, momentum indicators are gradually strengthening, suggesting CHZ could continue to extend its gains in the short term if buying pressure remains stable.
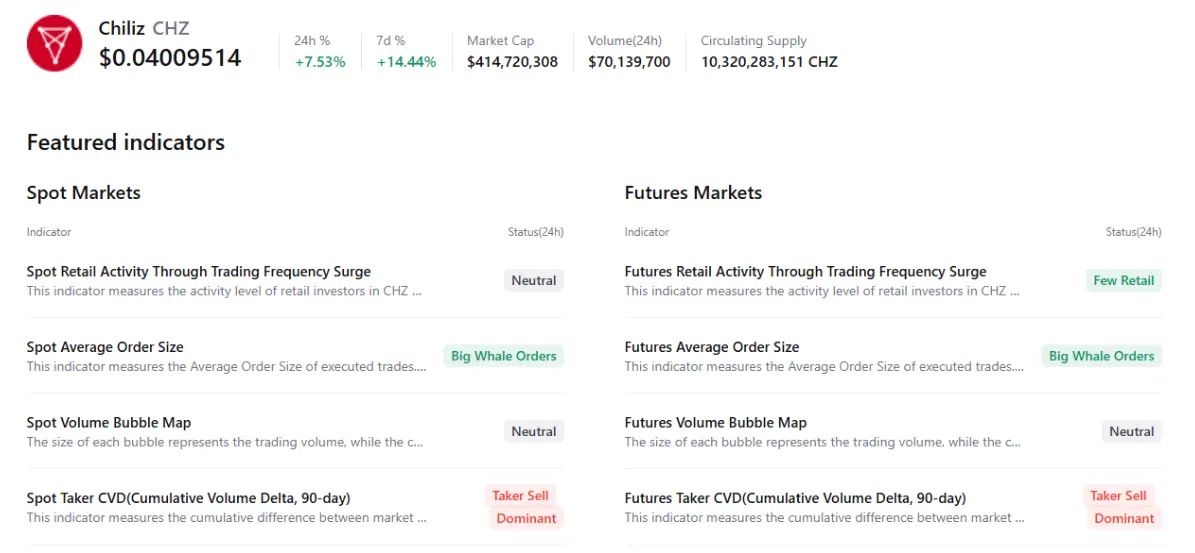
Mixed Outlook but Slightly Bullish
Data aggregated from CryptoQuant indicates that Chiliz’s market landscape remains somewhat mixed, but initial optimistic signals are beginning to appear. Notably, the increase in large buy orders from whale groups amid cautious retail investor flows is creating a slight tilt toward a positive scenario for CHZ. However, trading activity on both spot and futures markets still shows selling pressure dominating, reflecting a cautious sentiment among most investors.
From a social data perspective, the Social Dominance index from Santiment also supports a positive outlook. This index measures the proportion of discussions about CHZ across crypto media channels. Since early March, Social Dominance has maintained a steady upward trend, reaching 0.016% on Tuesday — the highest since early February. This development indicates growing market interest in CHZ, along with a clear improvement in investor sentiment.
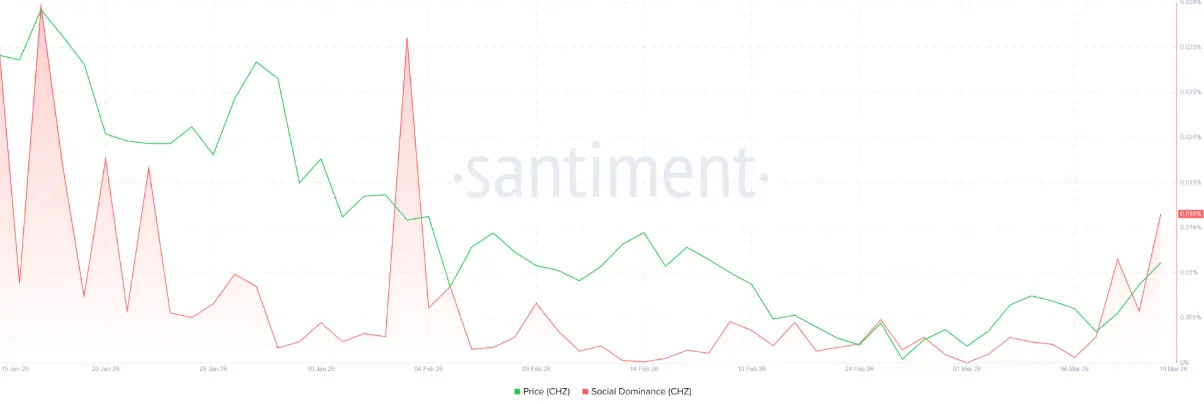 Social dominance chart of CHZ | Source: Santiment
Chiliz Price Forecast: Bulls in Control
The price of Chiliz (CHZ) remained above the $0.040 USD level on Tuesday, signaling a notable recovery after previous weakness. The short-term trend is slightly tilted upward as the price stays above the recently broken descending wedge pattern — a technical signal often indicating a potential reversal to the upside.
Recent candles have also moved back above the 50-day and 100-day EMAs, which are converging around the $0.039–0.040 USD zone. This suggests that this area is gradually transforming into a dynamic support zone, especially after the price surged from $0.034 USD — the upper boundary of the previous wedge pattern.
 Daily BTC/USD chart | Source: TradingView
Market momentum is also improving clearly. The daily RSI has risen above 50, reflecting renewed buying interest. Additionally, the MACD line has crossed above the signal line and entered positive territory, further reinforcing the short-term bullish outlook.
Regarding key technical levels, the nearest support zone is around $0.037 USD, with a potential drop to $0.027 USD if selling pressure intensifies. Conversely, if the price can close firmly above the $0.040–0.041 USD range, CHZ could extend its rally toward the February peak near $0.043 USD, and further toward the $0.045 USD zone — where significant supply was previously observed along the old trendline.
SN_Nour
Disclaimer: The information on this page may come from third parties and does not represent the views or opinions of Gate. The content displayed on this page is for reference only and does not constitute any financial, investment, or legal advice. Gate does not guarantee the accuracy or completeness of the information and shall not be liable for any losses arising from the use of this information. Virtual asset investments carry high risks and are subject to significant price volatility. You may lose all of your invested principal. Please fully understand the relevant risks and make prudent decisions based on your own financial situation and risk tolerance. For details, please refer to
Disclaimer.