This comprehensive guide compares ATH and AAVE, two distinct cryptocurrency assets operating in different sectors. ATH (Aethir) is an emerging 2024 cloud computing infrastructure platform leveraging decentralized GPU resource sharing for AI and machine learning, currently trading at $0.010116 with lower liquidity. AAVE is an established 2020 decentralized lending protocol commanding $170.90 price with $6.4M daily volume and over $7.5 billion in active loans across 13 blockchain networks. The article examines historical price trends, tokenomics, institutional adoption via Gate, technical ecosystems, and macroeconomic factors influencing both assets. AAVE demonstrates advantages through higher liquidity, institutional recognition (Grayscale portfolio inclusion), nearly full token dilution, and multi-chain deployment with V4 unified liquidity innovations. ATH offers early-stage growth potential but presents higher volatility and lower trading volume. Investment recommendations favor AAVE for conservative and new
Introduction: Investment Comparison Between ATH and AAVE
In the cryptocurrency market, the comparison between ATH and AAVE has consistently been a topic that investors cannot overlook. These two assets demonstrate notable differences in market cap ranking, application scenarios, and price performance, representing distinct positions within the crypto asset landscape.
Aethir (ATH): Since its launch in 2024, this cloud computing infrastructure platform has gained market attention by optimizing GPU utilization for compute-intensive domains such as AI, machine learning, and cloud gaming through its decentralized resource-sharing framework.
AAVE (AAVE): Introduced in 2020, this decentralized lending protocol has established itself as a cornerstone of DeFi infrastructure, enabling deposit and lending services with algorithmic interest rate determination based on platform supply and demand dynamics.
This article will provide a comprehensive analysis of the investment value comparison between ATH and AAVE, examining historical price trends, supply mechanisms, institutional adoption, technical ecosystems, and future projections, while addressing investors' most pressing question:
"Which is the better buy right now?"
I. Historical Price Comparison and Current Market Status
ATH (Aethir) and AAVE Historical Price Trends
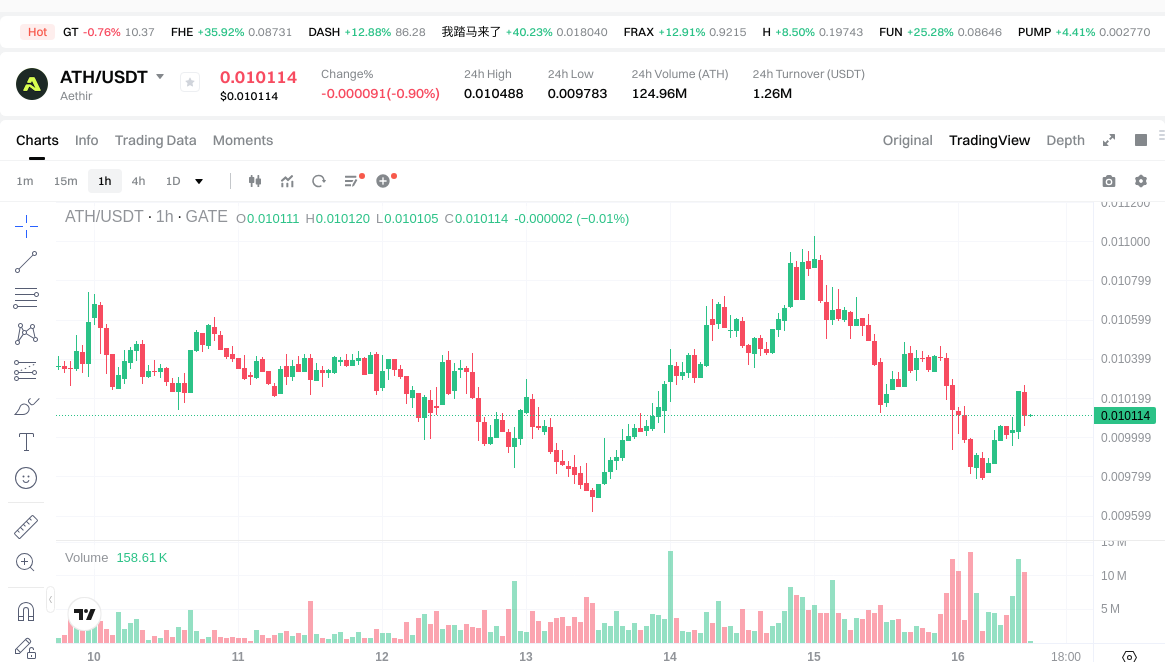
- 2024: ATH experienced significant price volatility, reaching its highest recorded price of $0.14724 on June 12, 2024, following its market launch and initial trading activity.
- 2021: AAVE reached its peak price of $661.69 on May 19, 2021, during a broader rally in decentralized finance (DeFi) protocols and increased adoption of lending platforms.
- Comparative Analysis: During the 2024-2025 market cycle, ATH declined from its high of $0.14724 to a low of $0.00843 (recorded on December 31, 2025), representing substantial downward pressure. In contrast, AAVE showed a longer-term decline from its 2021 peak of $661.69 to a low of $26.02 in November 2020, followed by periods of recovery and subsequent volatility.
Current Market Situation (January 16, 2026)
- ATH Current Price: $0.010116
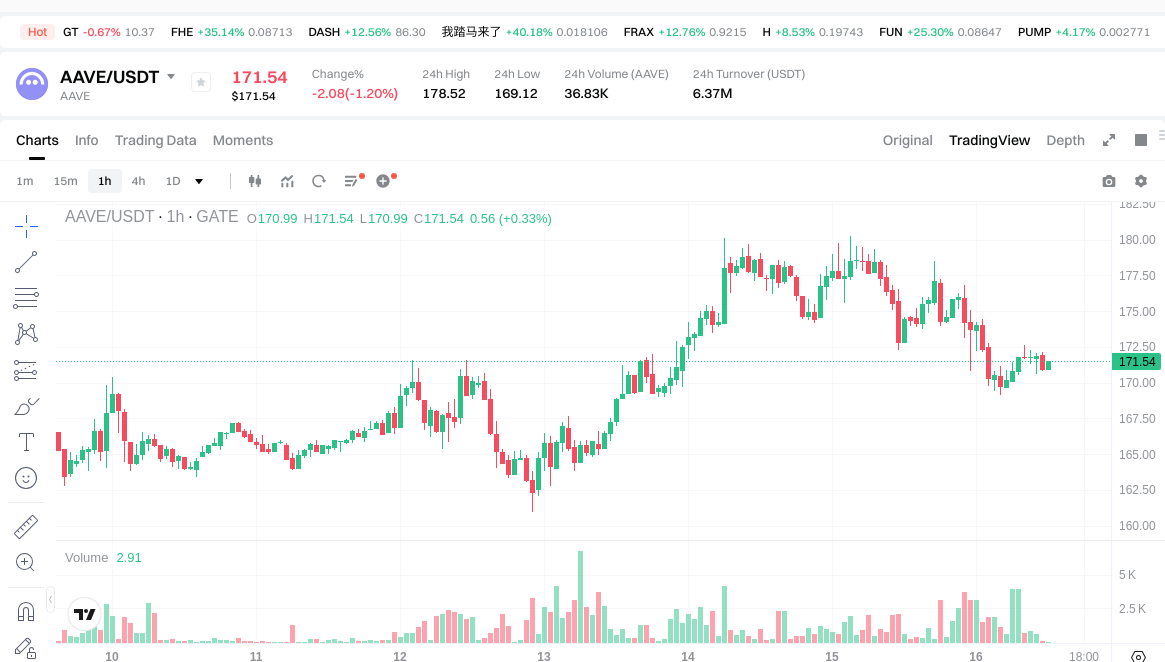
- AAVE Current Price: $170.90
- 24-Hour Trading Volume: ATH recorded $1,268,115.76, while AAVE showed significantly higher liquidity with $6,421,114.96 in trading volume.
- Market Sentiment Index (Fear & Greed Index): 49 (Neutral)
View real-time prices:
- Check ATH current price Market Price
- Check AAVE current price Market Price
II. Core Factors Influencing ATH vs AAVE Investment Value
Supply Mechanism Comparison (Tokenomics)
- ATH: Information about ATH's supply mechanism is not available in the provided materials.
- AAVE: AAVE has nearly reached full dilution in circulation with no large-scale supply unlocks anticipated in the future. This contrasts with some recent token issuances that experienced value loss during Token Generation Events (TGE) due to low circulation and high fully diluted valuation (FDV).
- 📌 Historical Pattern: AAVE's tokenomics reform introduces revenue-sharing mechanisms through staking models (stkAAVE, stk aToken) to enhance value capture while managing risk through the Security Module.
Institutional Adoption and Market Application
- Institutional Holdings: AAVE received support from institutional investors, with Grayscale adding AAVE to its investment portfolio fund in December 2020. Information about institutional preference between ATH and AAVE is limited in the materials.
- Enterprise Adoption: AAVE serves as a decentralized lending protocol with over 7.5 billion in active loans, representing the infrastructure layer of DeFi. The protocol supports ETH, WBTC, DAI, stablecoins, and other mainstream assets across multiple chains. Details about ATH's enterprise applications are not provided.
- National Policy: Both protocols operate within the evolving regulatory landscape of decentralized finance, though specific comparative regulatory attitudes toward ATH versus AAVE are not detailed in the materials.
Technology Development and Ecosystem Building
- ATH Technology Upgrade: Specific information about ATH's technology upgrades is not available in the reference materials.
- AAVE Technology Development: Aave V4 aims to revolutionize DeFi user experience by building a Unified Liquidity Layer, enabling seamless cross-chain liquidity access across multiple networks (including EVM and eventually non-EVM chains). The upgrade will integrate Account Abstraction and Smart Accounts, allowing users to manage positions across isolated assets. Aave has deployed on 13 blockchain networks including zkSync and is exploring deployment on Aptos (first non-EVM network).
- Ecosystem Comparison: AAVE demonstrates strong ecosystem expansion including the stablecoin GHO, decentralized social protocol Lens Protocol, and deployment across Ethereum, Polygon, Avalanche, Arbitrum, Base, and other major L1/L2 networks. The protocol leads in TVL on most deployment chains except BNB Chain. Information about ATH's DeFi, NFT, payment, and smart contract implementation is not provided.
Macroeconomic Environment and Market Cycles
- Performance Under Inflation: AAVE's asset composition consists of over 75% non-stable assets (primarily Bitcoin and Ethereum derivatives), positioning its TVL and revenue growth to correlate directly with these assets. As global central banks signal entry into rate-cutting cycles, capital may flow from traditional financial yield instruments toward DeFi stablecoin farming for higher returns, potentially benefiting Aave's stablecoin lending activities.
- Macroeconomic Monetary Policy: The introduction of Bitcoin and Ethereum ETFs represents a watershed moment in cryptocurrency adoption, providing traditional and regulated investment vehicles. Lower participation barriers may attract institutional and retail capital, driving further integration of digital assets into mainstream portfolios. This development serves as a positive factor for AAVE.
- Geopolitical Factors: AAVE's multi-chain positioning and support for stablecoins position it to benefit from cross-border transaction demands. The protocol's expansion into RWA (Real World Assets) products around GHO may connect traditional finance with DeFi, attracting institutional investors. Specific geopolitical impacts on ATH versus AAVE are not detailed in the materials.
III. 2026-2031 Price Prediction: ATH vs AAVE
Short-term Prediction (2026)
- ATH: Conservative $0.0079-$0.0101 | Optimistic $0.0101-$0.0141
- AAVE: Conservative $149.22-$171.52 | Optimistic $171.52-$207.54
Medium-term Prediction (2028-2029)
- ATH may enter a consolidation phase, with projected price range of $0.0138-$0.0206
- AAVE may enter an expansion phase, with projected price range of $113.57-$322.76
- Key drivers: institutional capital inflows, ETF developments, ecosystem growth
Long-term Prediction (2030-2031)
- ATH: Base scenario $0.0149-$0.0181 | Optimistic scenario $0.0181-$0.0201
- AAVE: Base scenario $174.62-$281.64 | Optimistic scenario $281.64-$380.22
View detailed price predictions for ATH and AAVE
Disclaimer
ATH:
| Year |
Predicted High Price |
Predicted Average Price |
Predicted Low Price |
Price Change |
| 2026 |
0.0140668 |
0.01012 |
0.0078936 |
0 |
| 2027 |
0.016447024 |
0.0120934 |
0.010642192 |
19 |
| 2028 |
0.0171242544 |
0.014270212 |
0.01384210564 |
41 |
| 2029 |
0.020563375492 |
0.0156972332 |
0.015069343872 |
55 |
| 2030 |
0.0199433347806 |
0.018130304346 |
0.01486684956372 |
79 |
| 2031 |
0.020179028737098 |
0.0190368195633 |
0.017894610389502 |
88 |
AAVE:
| Year |
Predicted High Price |
Predicted Average Price |
Predicted Low Price |
Price Change |
| 2026 |
207.5392 |
171.52 |
149.2224 |
0 |
| 2027 |
216.063744 |
189.5296 |
164.890752 |
10 |
| 2028 |
261.60770688 |
202.796672 |
113.56613632 |
18 |
| 2029 |
322.7610433216 |
232.20218944 |
118.4231166144 |
35 |
| 2030 |
285.806064872224 |
277.4816163808 |
230.309741596064 |
62 |
| 2031 |
380.2191848457912 |
281.643840626512 |
174.61918118843744 |
64 |
IV. Investment Strategy Comparison: ATH vs AAVE
Long-term vs Short-term Investment Strategies
- ATH: May suit investors focused on emerging cloud computing infrastructure and decentralized GPU resource sharing, with tolerance for higher volatility in early-stage projects.
- AAVE: May suit investors seeking established DeFi protocol exposure with demonstrated institutional adoption and multi-chain ecosystem presence.
Risk Management and Asset Allocation
- Conservative Investors: ATH: 20-30% vs AAVE: 70-80%
- Aggressive Investors: ATH: 40-50% vs AAVE: 50-60%
- Hedging Tools: Stablecoin allocation, options strategies, cross-asset portfolio diversification
V. Potential Risk Comparison
Market Risk
- ATH: Limited historical price data since 2024 launch, with recorded decline from $0.14724 to $0.00843, indicating substantial downward pressure during initial market cycles. Lower 24-hour trading volume of $1,268,115.76 suggests reduced liquidity compared to established protocols.
- AAVE: Historical volatility demonstrated through peak-to-trough movement from $661.69 (May 2021) to lower price levels, though with subsequent recovery periods. Current 24-hour trading volume of $6,421,114.96 indicates higher liquidity profile.
Technical Risk
- ATH: Scalability and network stability considerations for decentralized cloud computing infrastructure remain subjects for ongoing evaluation.
- AAVE: Protocol risks include smart contract vulnerabilities across 13 blockchain deployments, though the protocol implements Security Module mechanisms. The transition to Aave V4's Unified Liquidity Layer introduces technical implementation considerations.
Regulatory Risk
- Global regulatory frameworks continue evolving for decentralized finance protocols, with potential differential impacts on lending platforms versus infrastructure projects. Both assets operate within developing regulatory landscapes for cryptocurrency and DeFi services.
VI. Conclusion: Which Is the Better Buy?
📌 Investment Value Summary:
- ATH Advantages: Positioned in emerging cloud computing and GPU resource sharing sector; launched during recent market cycle with potential for early-stage growth.
- AAVE Advantages: Established DeFi lending protocol with over 7.5 billion in active loans; institutional recognition through Grayscale portfolio inclusion; multi-chain deployment across 13 networks; nearly full token dilution reached; developing Unified Liquidity Layer through V4 upgrade; revenue-sharing mechanisms through staking models.
✅ Investment Recommendations:
- New Investors: Consider AAVE for exposure to established DeFi infrastructure with demonstrated institutional adoption and higher liquidity profile.
- Experienced Investors: May evaluate portfolio allocation across both assets based on risk tolerance, with consideration of ATH's early-stage positioning versus AAVE's established protocol status.
- Institutional Investors: AAVE's multi-chain presence, institutional recognition, stablecoin GHO development, and potential Real World Assets integration may align with diversified DeFi exposure strategies.
⚠️ Risk Disclaimer: Cryptocurrency markets demonstrate high volatility. This content does not constitute investment advice.
VII. FAQ
Q1: What are the main differences between ATH and AAVE's market positioning?
ATH is an emerging cloud computing infrastructure platform launched in 2024, focusing on decentralized GPU resource sharing for AI, machine learning, and cloud gaming. AAVE is an established decentralized lending protocol introduced in 2020, serving as core DeFi infrastructure with over 7.5 billion in active loans across 13 blockchain networks. The fundamental difference lies in their sectors: ATH operates in cloud computing infrastructure while AAVE provides financial lending services.
Q2: Which asset shows better liquidity for trading purposes?
AAVE demonstrates significantly higher liquidity with a 24-hour trading volume of $6,421,114.96 compared to ATH's $1,268,115.76 (as of January 16, 2026). This fivefold difference in trading volume indicates that AAVE offers more favorable conditions for entering and exiting positions, particularly for larger transactions. The higher liquidity also typically results in tighter bid-ask spreads and reduced slippage.
Q3: How do the tokenomics differ between ATH and AAVE?
AAVE has nearly reached full dilution in circulation with no large-scale supply unlocks anticipated, which reduces the risk of value dilution from future token releases. The protocol has implemented revenue-sharing mechanisms through staking models (stkAAVE, stk aToken) to enhance value capture. Detailed information about ATH's supply mechanism and tokenomics structure is not available in current market materials, which may require additional research before investment decisions.
Q4: What institutional recognition exists for these protocols?
AAVE has received institutional validation, notably through Grayscale's addition of AAVE to its investment portfolio fund in December 2020. The protocol's multi-chain deployment across 13 networks and leadership in Total Value Locked (TVL) on most chains demonstrates institutional-grade infrastructure. Information regarding institutional holdings or enterprise partnerships for ATH is currently limited in available market materials.
Q5: What are the key technical developments for each protocol?
AAVE is developing Aave V4, which introduces a Unified Liquidity Layer enabling seamless cross-chain liquidity access across multiple networks, including both EVM and non-EVM chains. The upgrade will integrate Account Abstraction and Smart Accounts for enhanced user experience. AAVE's ecosystem includes the stablecoin GHO, Lens Protocol for decentralized social applications, and deployments across major L1/L2 networks. Specific technical upgrade information for ATH is not detailed in current materials.
Q6: How do macroeconomic factors affect these two assets differently?
AAVE's asset composition of over 75% non-stable assets (primarily Bitcoin and Ethereum derivatives) creates direct correlation with these major cryptocurrencies. As global central banks enter rate-cutting cycles, capital may flow from traditional financial instruments toward DeFi stablecoin farming, potentially benefiting AAVE's stablecoin lending activities. The introduction of Bitcoin and Ethereum ETFs provides regulated investment vehicles that may increase institutional capital flows to established DeFi protocols like AAVE. ATH's positioning in cloud computing infrastructure may respond differently to macroeconomic conditions based on enterprise adoption of decentralized GPU resources.
Q7: What are the main risks to consider for each investment?
ATH presents risks associated with early-stage projects, including limited historical price data, substantial volatility (declining from $0.14724 to $0.00843 during initial cycles), and lower trading volume indicating reduced liquidity. AAVE's risks include smart contract vulnerabilities across 13 blockchain deployments, though mitigated by Security Module mechanisms, and technical implementation considerations during the V4 upgrade transition. Both assets face evolving regulatory frameworks for decentralized finance, with potential differential impacts on lending platforms versus infrastructure projects.
Q8: What investment allocation strategy is appropriate for different investor profiles?
Conservative investors may consider a 70-80% AAVE allocation versus 20-30% ATH, prioritizing established protocol exposure with demonstrated institutional adoption. Aggressive investors might opt for a more balanced 50-60% AAVE and 40-50% ATH allocation to capture potential early-stage growth while maintaining exposure to proven DeFi infrastructure. New investors should consider AAVE for initial DeFi exposure given its higher liquidity profile and institutional recognition, while experienced investors may evaluate both assets based on their risk tolerance and sector diversification strategies.
* The information is not intended to be and does not constitute financial advice or any other recommendation of any sort offered or endorsed by Gate.