Summary
-
Lower U.S. inflation improved market risk appetite, but tensions in the Middle East pushed oil prices higher, keeping U.S. Treasury yields elevated and limiting the rebound in risk assets. BTC and ETH rose 1.48% and 3.62%, respectively, while ETFs returned to net inflows overall, with a more pronounced recovery in ETH flows.
-
TradFi trading shifted back toward equities, with equity contracts rising to roughly 65%–70% of volume. Gate TradFi weekly turnover recovered to approximately $90 billion, while allocations to U.S. equities and ETFs also increased.
-
Robinhood Chain shifted market attention from Solana memes to the “RWA + Tokenized Stocks + Meme” narrative. Uniswap’s user base continued to grow, the Ethereum ecosystem benefited, and both Lido TVL and Aave’s Ethereum lending volume expanded further.
-
Stablecoin competition is gradually shifting from scale to compliance and distribution. Open USD and the GENIUS Act became key market themes. Meanwhile, protocol revenue did not broadly rise alongside market narratives; only stablecoins, lending, and leading derivatives protocols maintained strong profitability.
-
BTC remained range-bound between $63,000 and $65,000. Funding rates stayed positive, but open interest did not expand materially, indicating bullish sentiment while leveraged capital remained restrained.
-
The options market was dominated by monthly-contract rolling and risk management. The 25D skew continued to normalize, while DVOL stayed range-bound at low levels, reflecting weaker defensive sentiment but leaving volatility vulnerable to rapid expansion after a range breakout.
1. Market Focus
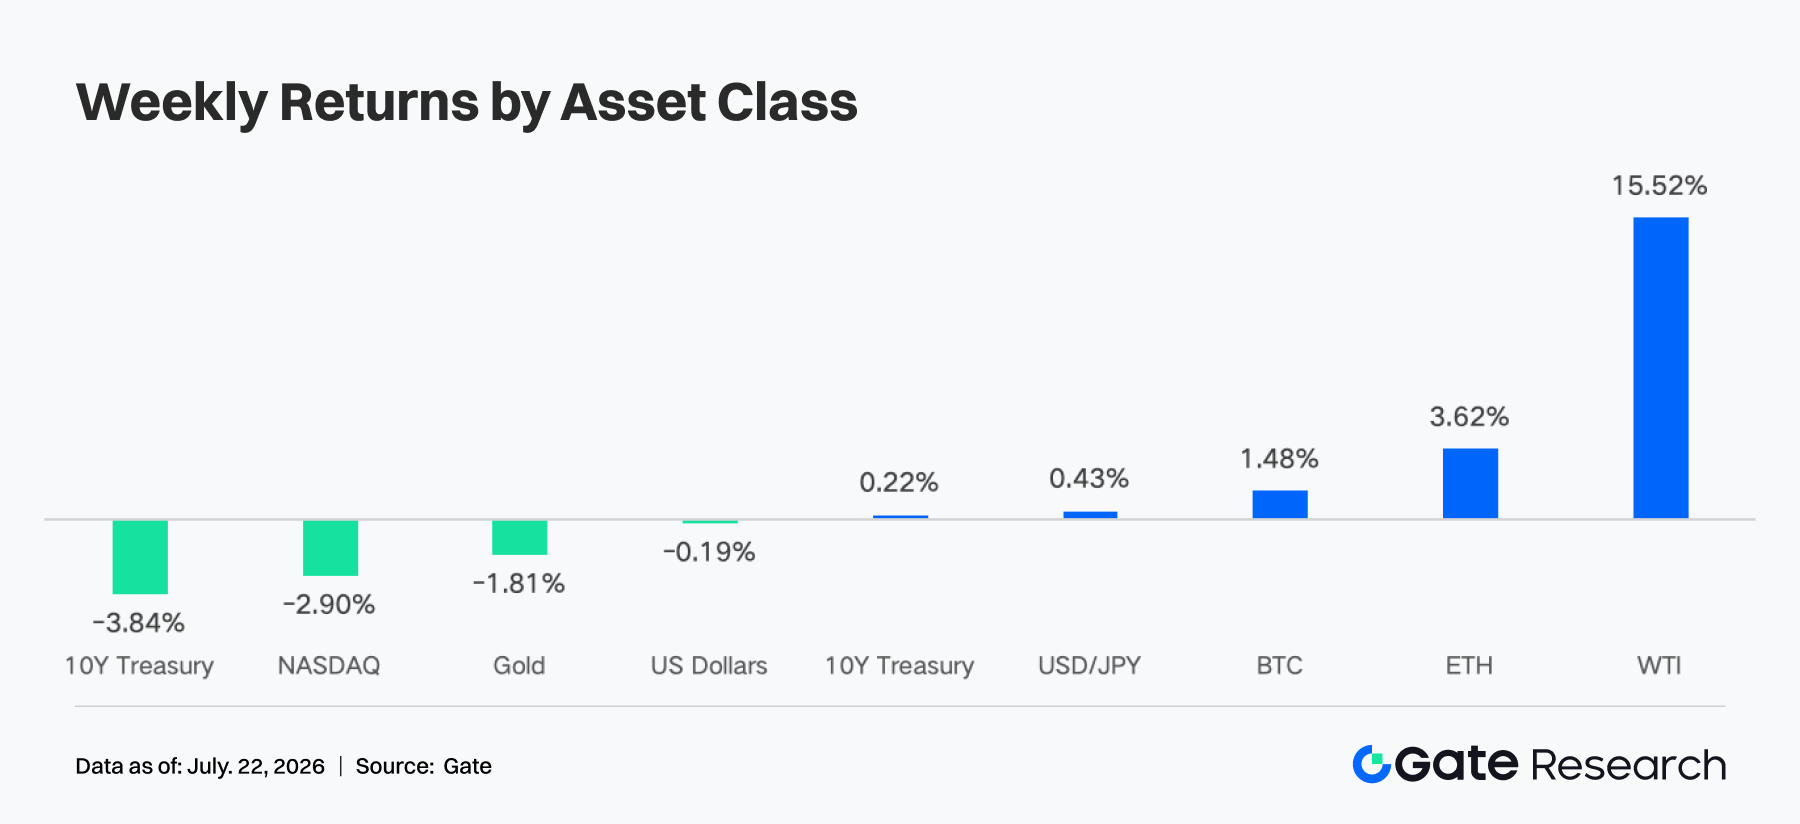
Last week (July 13–19, 2026), global assets were caught between easing inflation and a geopolitical oil-price shock. U.S. CPI fell 0.4% month over month in June, while the year-over-year rate declined from 4.2% in May to 3.5%; core CPI eased to 2.6% year over year. June PPI fell 0.3% month over month, indicating that lower energy prices temporarily relieved inflationary pressure. After the data, markets briefly reduced the probability of further Federal Reserve rate hikes, risk appetite improved, and BTC moved back toward 65,000 USDT. However, the easing trade did not last through the week, as renewed tensions in the Middle East drove crude oil higher. LPL reported a 15.01% weekly gain in crude, while AP noted that Brent rose another 4.6% on Friday amid concerns about war with Iran. The rebound in oil lifted inflation expectations again, preventing a clear downtrend in Treasury yields despite some easing; the 10-year U.S. Treasury yield remained around 4.55%.
In U.S. equities, crowded AI and semiconductor trades saw a notable pullback. The S&P 500 fell 1.6% last week, the Dow declined 0.9%, and the Nasdaq dropped 2.9%. Capital rotated out of highly valued technology stocks, while rising oil prices revived concerns about imported inflation. As a result, crypto markets entered a mixed environment in which supportive macro developments provided a floor, but risk-asset valuations remained under pressure. BTC gained 1.48% over the week and ETH rose 3.62%, both outperforming the Nasdaq. This suggests that cooling inflation, regulatory expectations, and partial capital reallocation continued to support crypto. However, repeated intraday rallies followed by reversals also showed that oil prices and geopolitical risk were still restraining the expansion of leveraged positions.
2. Liquidity Analysis
2.1 Institutional sentiment shifts from defensive to cautiously constructive as ETF flows return
U.S. spot BTC ETFs recorded total net inflows of $76 million last week, down 61.75% from $197 million the previous week. A $425 million net outflow on Monday was followed by four consecutive days of inflows, indicating that institutional demand recovered but remained weak in both strength and consistency. IBIT led with $204 million in net inflows, while FBTC posted the largest net outflow at $181 million; GBTC also saw $53 million in outflows. Capital clearly continued to concentrate in leading low-fee products. Total BTC ETF AUM rose from approximately $77.42 billion to about $77.60–$77.72 billion, an increase of roughly 0.3% week over week.
ETH ETFs recorded total net inflows of $106 million, up 25.15% from $84 million the previous week. ETHA ranked first with $135 million in inflows, while FETH was the weakest with $22 million in net outflows; flows again concentrated in BlackRock’s product. Because no consistent, precise public snapshot of total AUM was available for July 17, estimated period-end AUM was approximately $9.94 billion based on the prior week’s $9.59 billion, ETH’s Friday price change, and net subscriptions and redemptions—an increase of about 3.6% week over week. Overall, institutional sentiment shifted from defensive to cautiously constructive. ETH showed a more solid improvement in both flows and asset size, while BTC remained burdened by large redemptions across products and could not yet be viewed as reflecting a broad return of risk appetite.
2.2 TradFi Liquidity
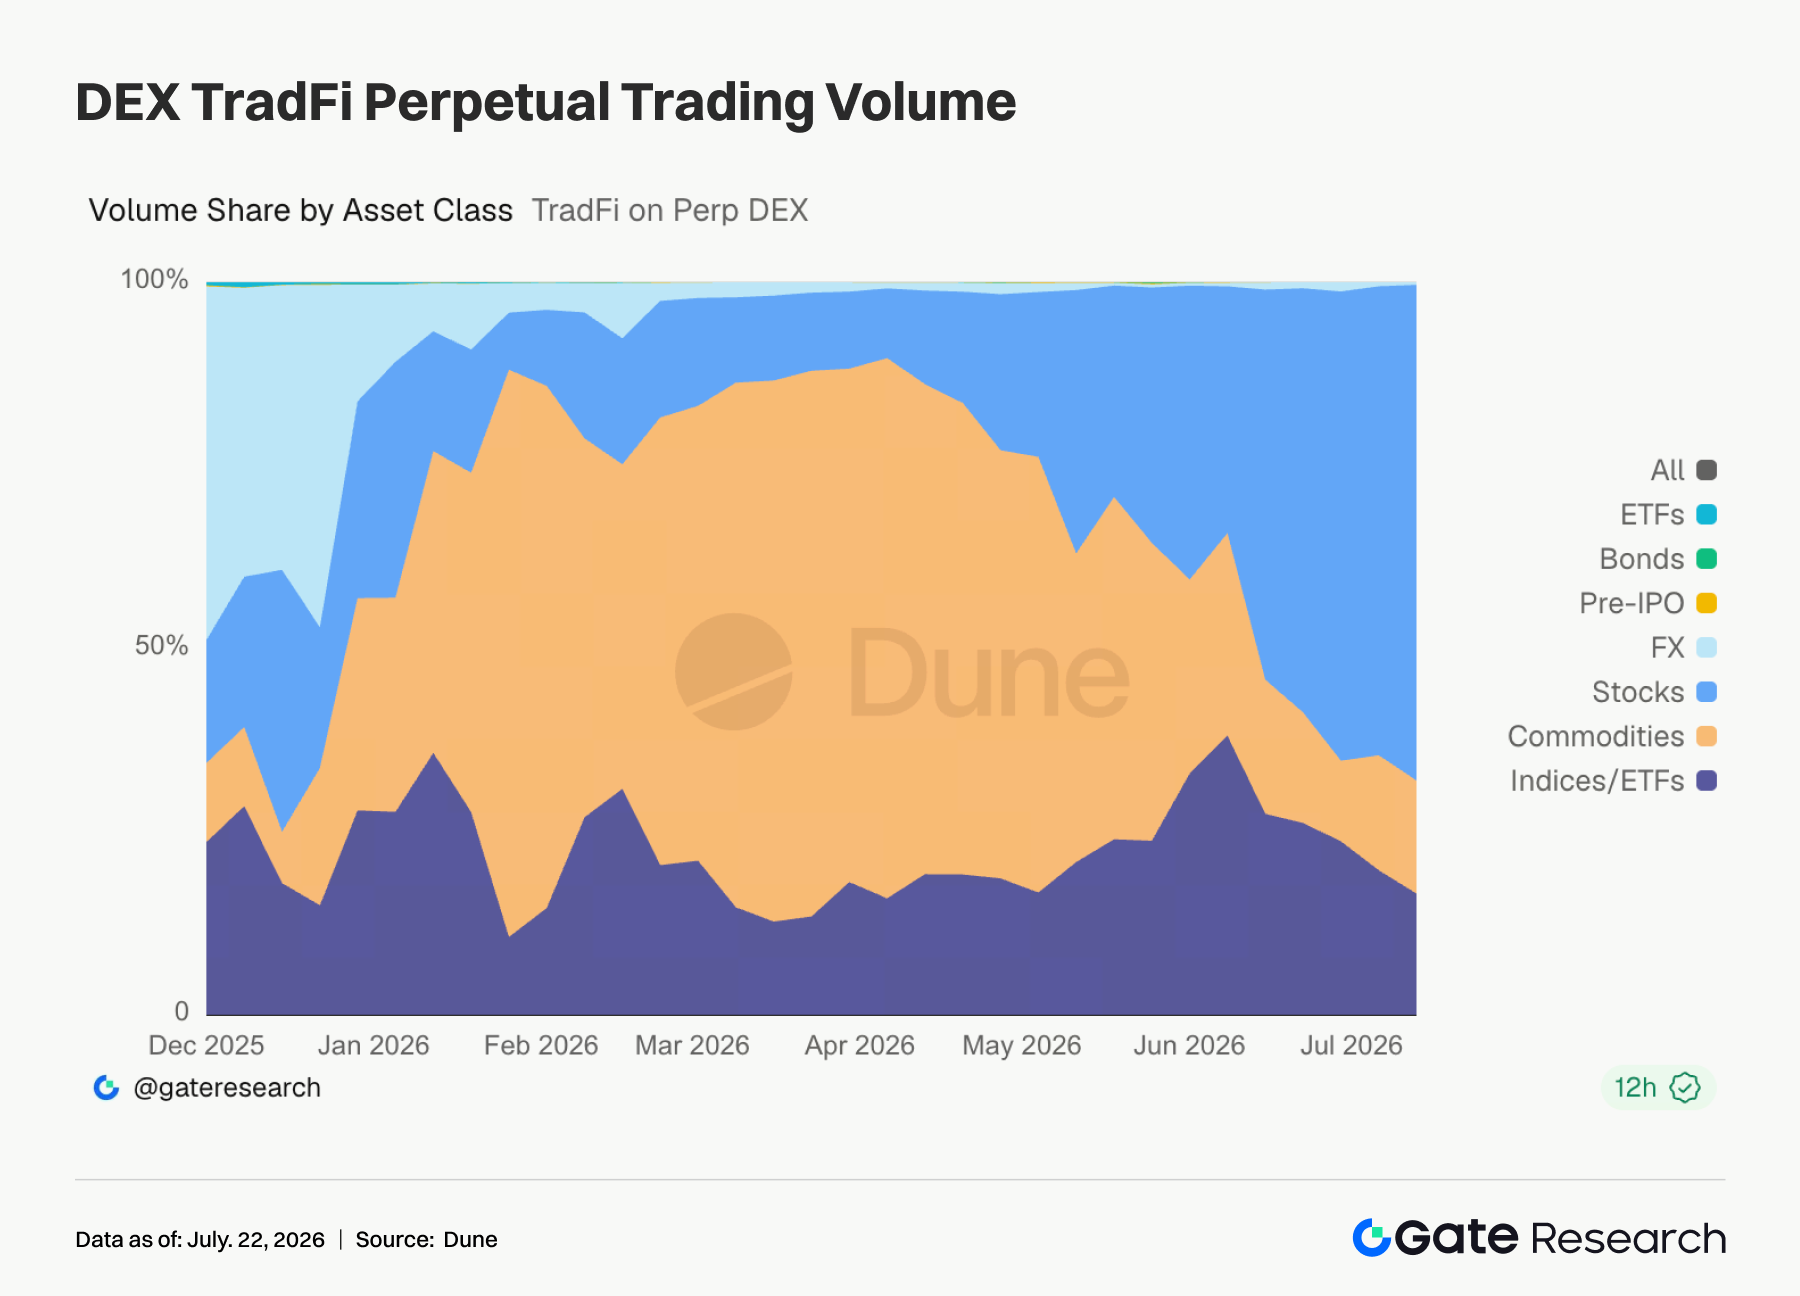
- TradFi Perp DEX: Over the past week, the trading mix on TradFi perpetual DEXs continued to concentrate in equities. Equity contracts rose to roughly 65%–70% of volume, a recent high, showing continued capital flows into U.S., Hong Kong, and South Korean equities. Meanwhile, commodities fell further to around 10%, cooling significantly from their second-quarter peak, while indices and ETFs maintained a stable share of approximately 20%. Overall, the center of trading activity shifted back from oil-driven commodities to equities, reflecting an improvement in risk appetite and a continued recovery in demand for equity trading.
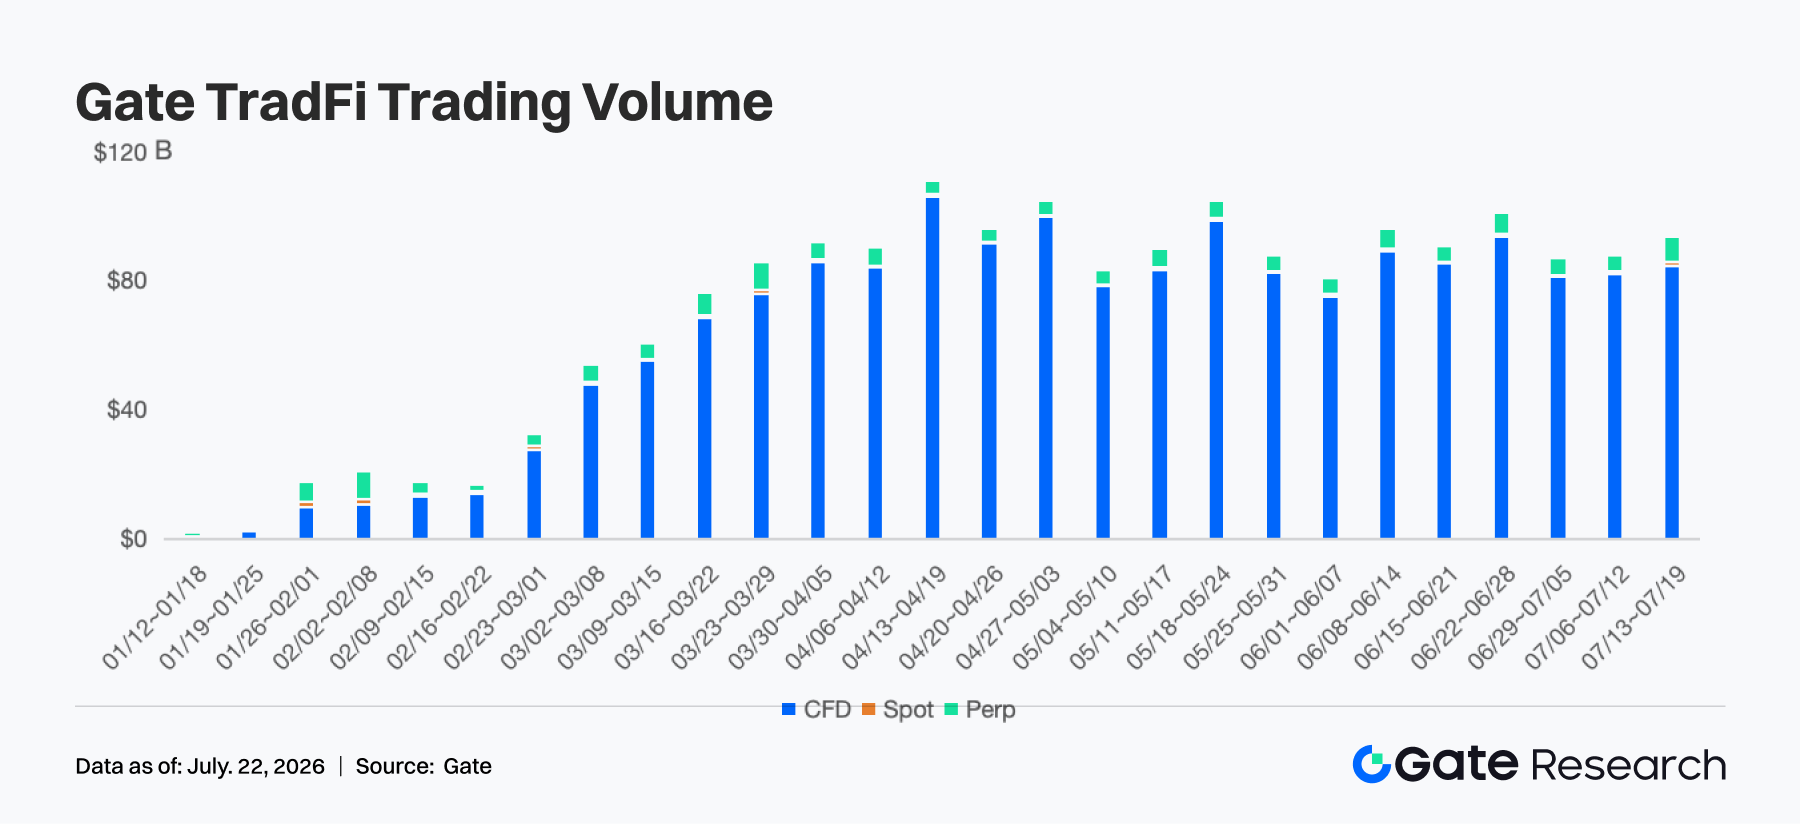
- Gate TradFi trading volume: Over the past week, Gate TradFi’s total turnover was approximately $90 billion, up about 4%–5% from the previous week and ending two consecutive weeks of decline, while overall trading activity remained elevated. CFDs continued to dominate, generating roughly $86 billion and accounting for about 95% of total volume. Perpetuals remained stable at $4–5 billion, or approximately 5% of volume. With the U.S. earnings season beginning and market risk appetite improving, trading in equity-related TradFi products remained active, driving a moderate recovery in platform-wide volume and demonstrating resilient demand for equity exposure.
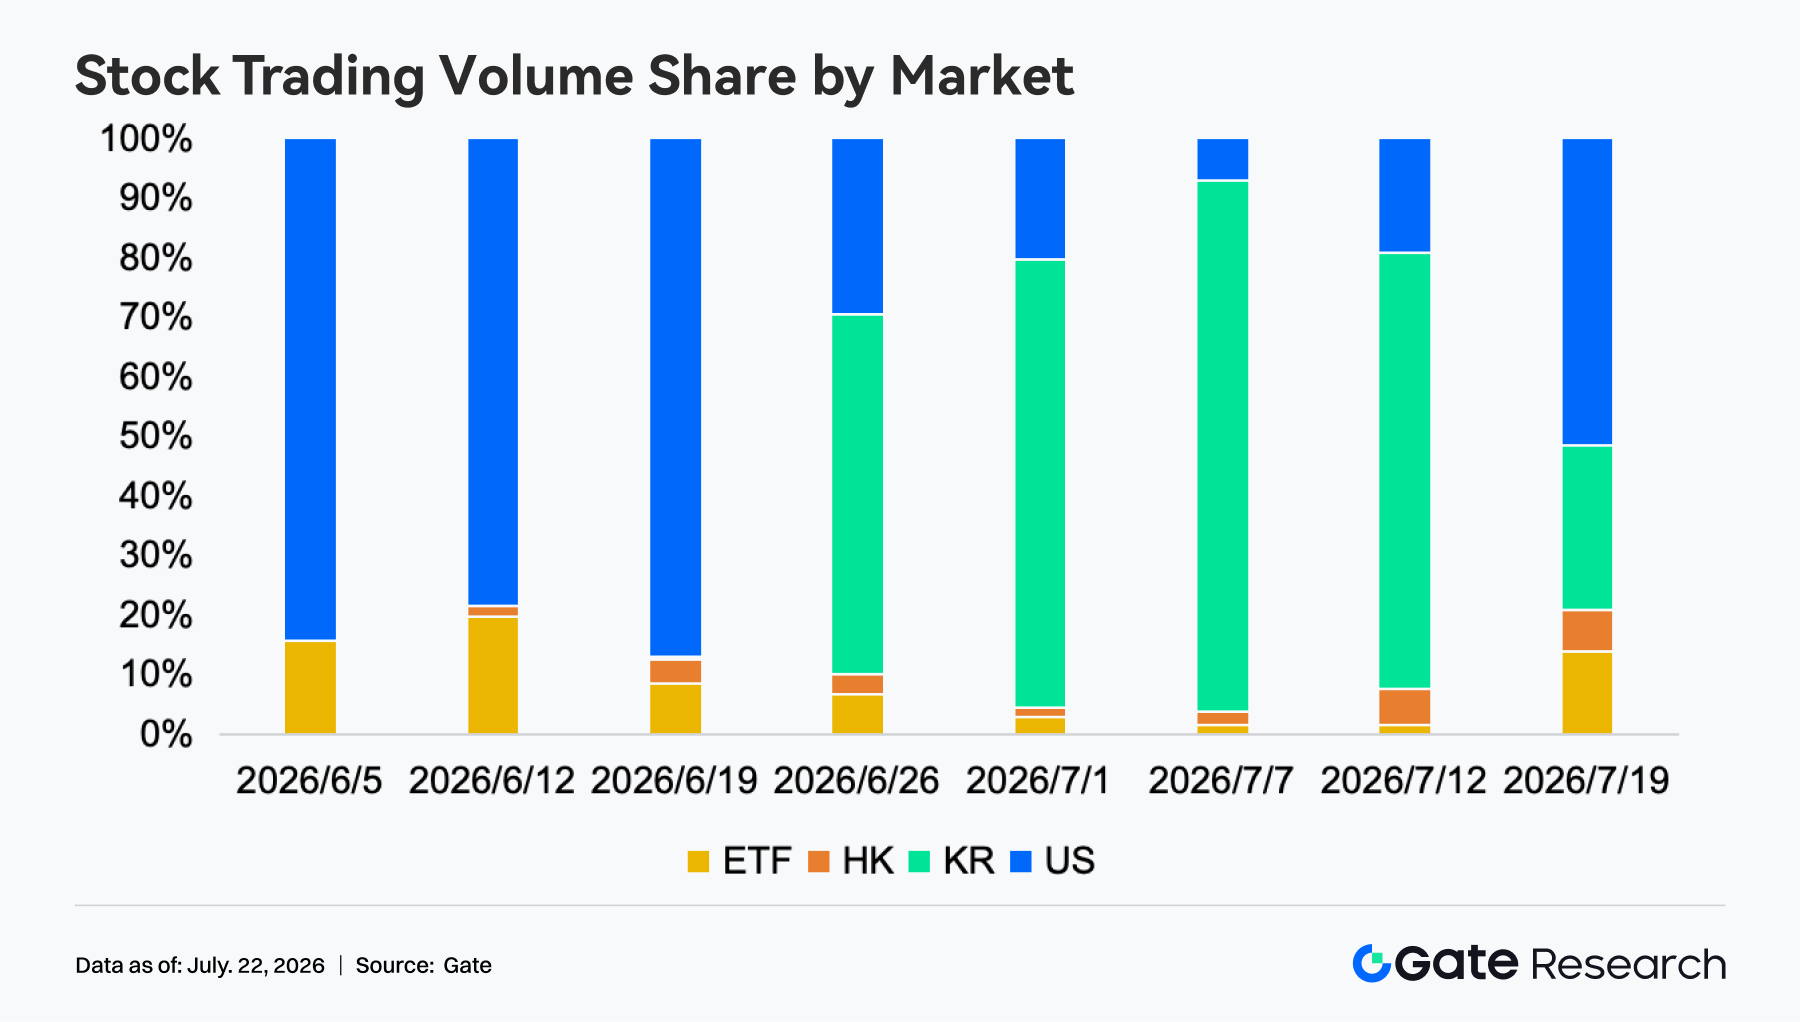
- Gate equity-asset trading volume: Over the past week, the composition of Gate’s equity assets shifted again. U.S. equities recovered to approximately 50%, South Korean equities declined to around 28%, ETFs increased to about 13%, and Hong Kong equities rose to roughly 8%. This indicates that capital was reallocating toward U.S. equities as the U.S. technology earnings season approached and market risk appetite improved, while some funds also began returning to Hong Kong equities and ETFs. Asset allocation moved away from its previous heavy concentration in South Korean equities toward a more balanced mix of U.S. equities, South Korean equities, and ETFs, resulting in a more diversified investment structure.
- TradFi order-book depth: We analyzed the order-book depth (Delta) of XAUT, the highest-volume TradFi asset. Over the past week, XAUT’s order-book depth gradually shifted from buy-side to sell-side dominance, marking a clear change in market liquidity. From July 15 to 17, order-book Delta repeatedly posted large positive readings, at times exceeding $2 million in a single hour. This showed a significant increase in bid depth, with market makers continually adding liquidity on the buy side. XAUT also remained resilient, trading around $4,000–$4,020. After July 18, however, depth declined markedly and positive Delta readings fell rapidly. On July 20, several negative Delta readings of approximately $800,000 to $1 million appeared in succession, indicating a substantial increase in ask depth and a shift in liquidity toward sellers. Although XAUT remained broadly stable near $4,000 without a notable price decline, buy-side support weakened materially from earlier in the week.
3. On-Chain Data Insights
3.1 Uniswap activity retreats from highs while users continue to grow; Robinhood Chain meme trading takes center stage
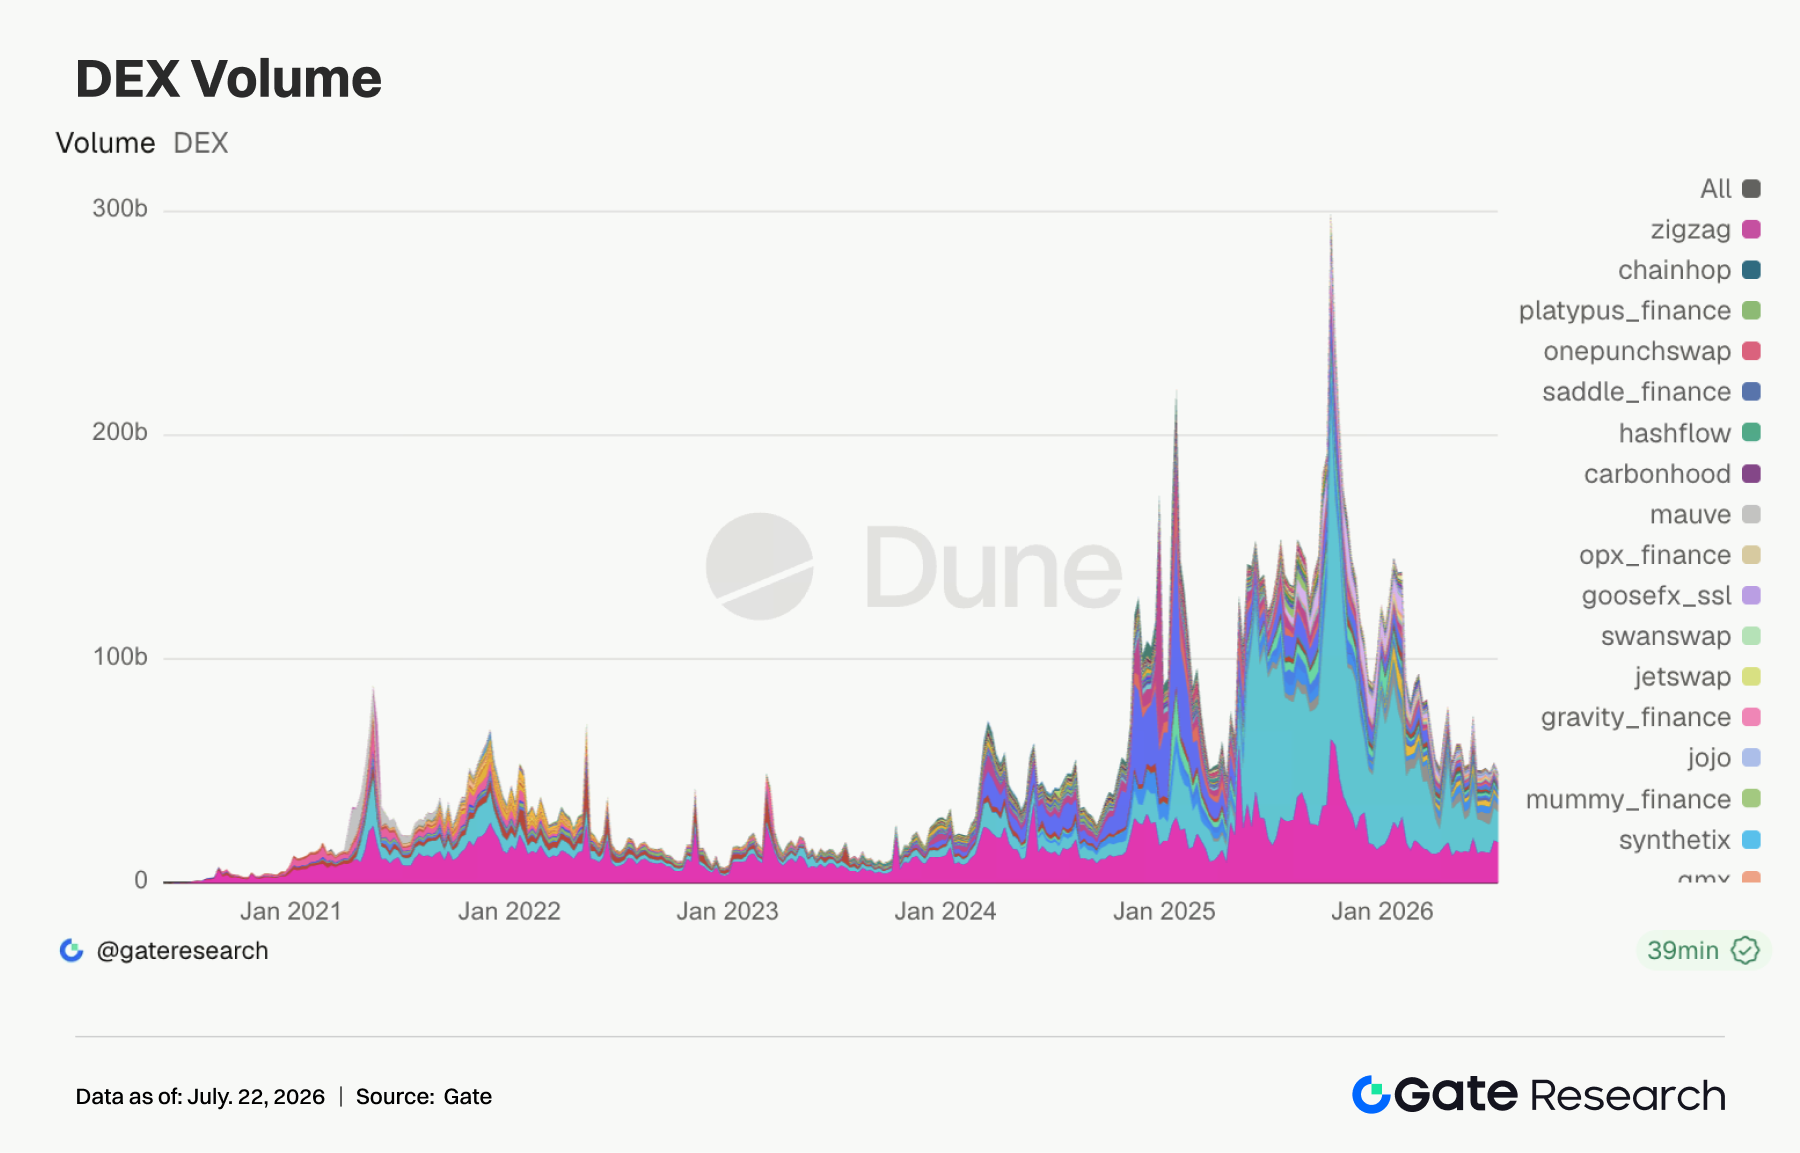
Uniswap volume edged down from the previous week, but the number of traders rose to approximately 988,000, indicating that participation broadened even as capital volume cooled. Robinhood Chain’s core narrative continued to gain momentum over the past week. Although it was initially positioned around tokenized stocks and RWAs, early activity was actually driven mainly by meme assets such as CASHCAT, and on-chain DEX volume briefly ranked among the leading Layer 2 networks. As Robinhood Chain’s launch AMM and a major Ethereum-based trading gateway, Uniswap captured this hybrid “brokerage chain + Meme + RWA” narrative. PancakeSwap, PumpSwap, Aerodrome, Raydium, and Whirlpool all declined week over week, while high-frequency speculation on BNB Chain and Solana did not continue at the same pace. Market attention shifted from Solana launchpad-style small-cap tokens toward Robinhood Chain and the narrative of bringing mainstream, readily understandable assets on-chain.
3.2 Stablecoin supply enters a new phase of stratification as Open USD and the GENIUS Act shift competition from scale to distribution and compliance
USDT was broadly flat last week, while USDC edged lower, with no significant expansion among the leading stablecoins. The notable change was structural: USDe recovered slightly to approximately $5.26 billion, PYUSD rose to around $2.2 billion, GHO increased from about $600 million to roughly $700 million, and USDGO continued to expand; meanwhile, USDS, USD1, USDG, and RLUSD declined. U.S. stablecoin regulation remained a key market focus over the past week. Implementation rules related to the GENIUS Act progressed more slowly than expected, while Visa launched a stablecoin platform integrated with Open USD. The distribution networks behind Open USD—including Visa, Stripe, Mastercard, Coinbase, and BlackRock—began to pressure USDC’s reserve-income model. Stablecoin competition has shifted toward securing genuine distribution through payment companies, brokerages, wallets, and DeFi protocols. Institutional capital will continue to favor compliant U.S. dollar assets, but revenue sharing and control of distribution channels are being repriced.
3.3 ETH LSTs continue to recover while SOL and HYPE staking assets remain under pressure
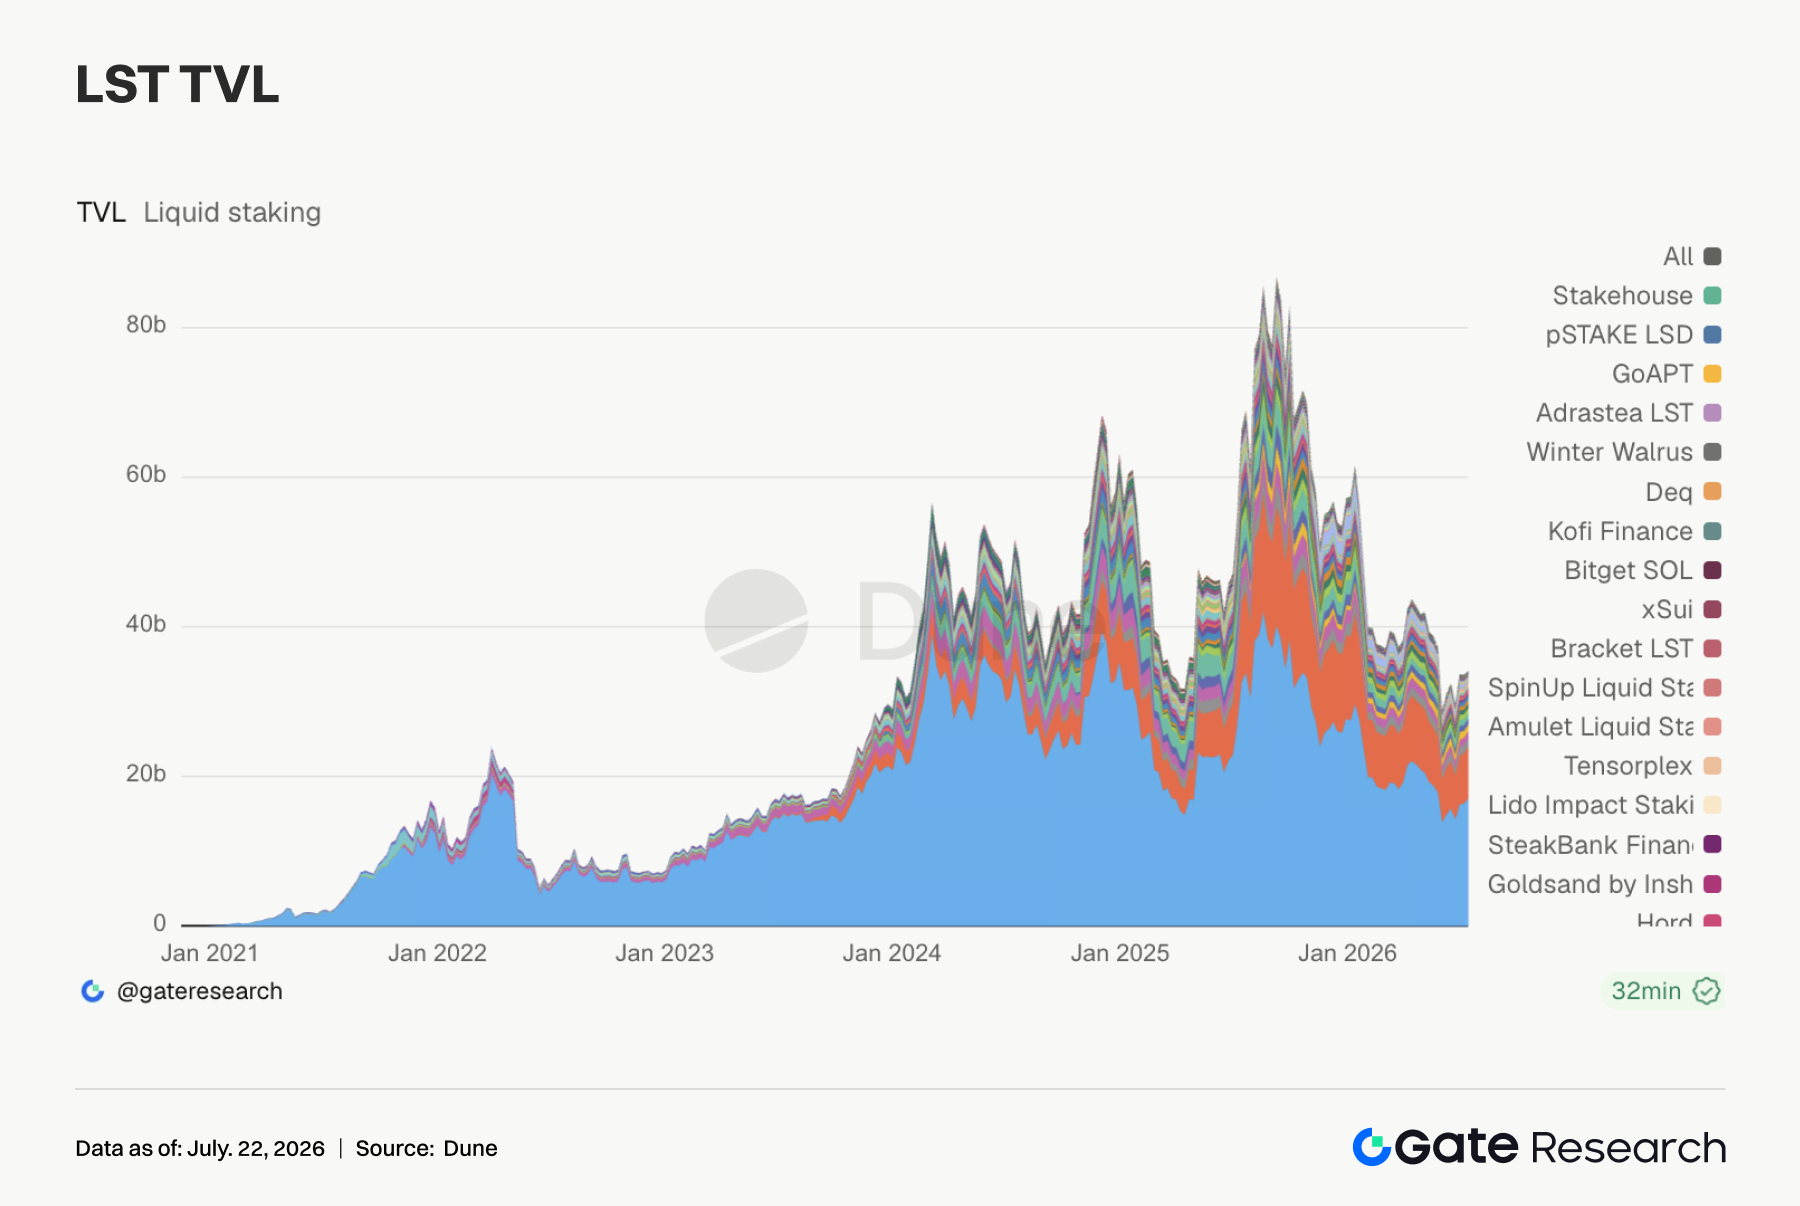
The LST sector diverged markedly last week. Major Ethereum protocols continued to expand, with Lido TVL rising to approximately $17.09 billion and Rocket Pool, StakeWise, Liquid Collective, and mETH Protocol all recording growth. ETH significantly outperformed most large-cap assets over the past week. The key catalyst was renewed inflows into spot ETH ETFs, particularly BlackRock’s product, which absorbed most of the incremental capital. Robinhood Chain also strengthened the narrative demand for ETH as a settlement and gas asset. By contrast, SOL-based staking assets underperformed. Jito, Jupiter Staked SOL, and several Solana LSTs declined, reflecting a retreat in high-beta assets as Solana meme trading cooled. Kinetiq kHYPE and stHYPE also fell, and Hyperliquid/HYPE-related staking assets did not participate in ETH’s renewed expansion.
3.4 Aave lending is driven by its core Ethereum market; Monad grows rapidly amid sharp divergence among emerging chains
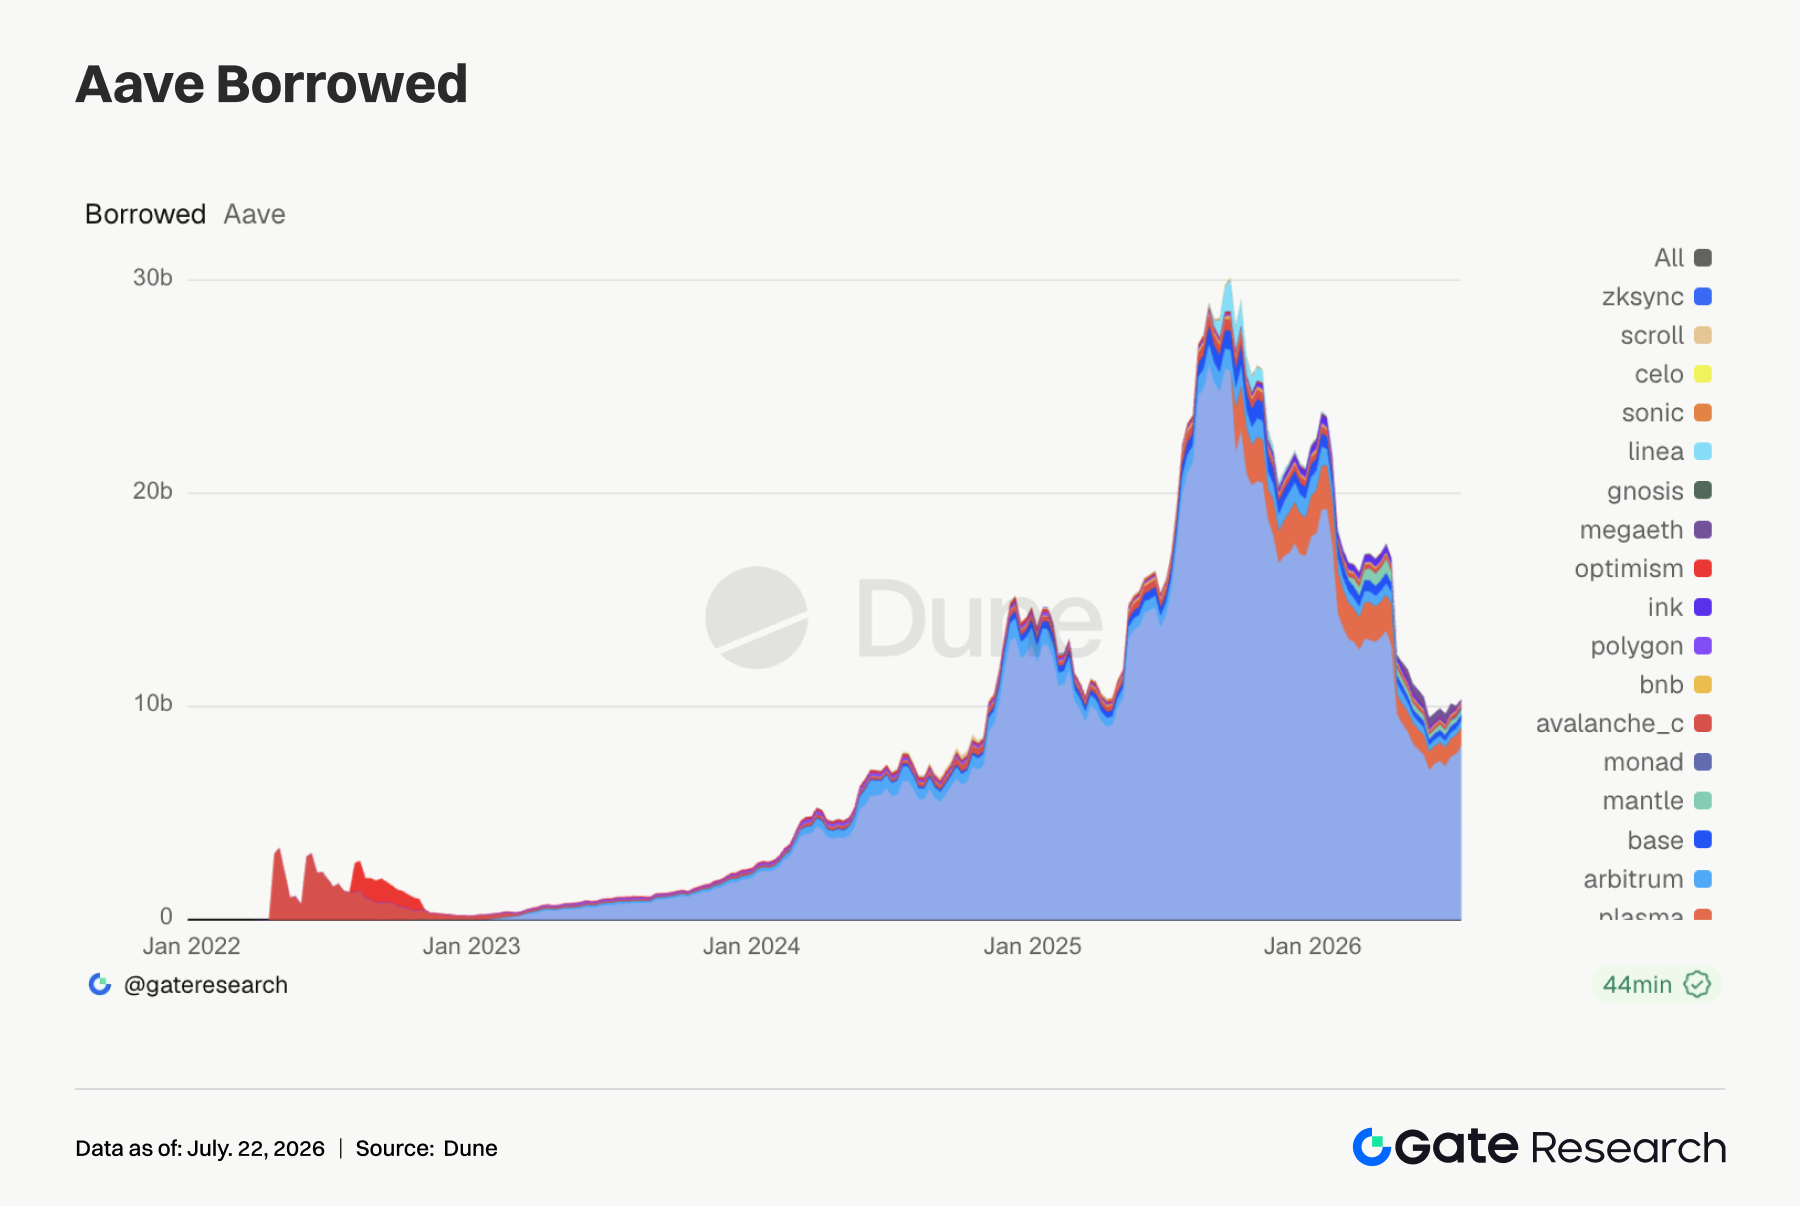
Aave lending continued to concentrate on Ethereum, where outstanding loans rose to approximately $8.18 billion, up about 5% from the previous week. This was consistent with ETH ETF inflows, ETH’s price strength, and the Ethereum-oriented risk appetite generated by the Robinhood Chain/RWA narrative. Arbitrum grew modestly, Base remained broadly stable, and Plasma declined slightly but still maintained approximately $850 million in volume. Divergence among emerging chains was more pronounced. Monad’s outstanding loans rose from about $92.05 million to roughly $170 million, showing that capital remained willing to pursue early opportunities on chains with new narratives. By contrast, MegaETH fell sharply from approximately $118 million to about $11.02 million, while Avalanche, Mantle, and Ink also declined. Lending capital increasingly concentrated only in markets with clear liquidity and incentive expectations.
3.5 Aave rates show restrained financing conditions, while tail pressure in USDC has not fully disappeared
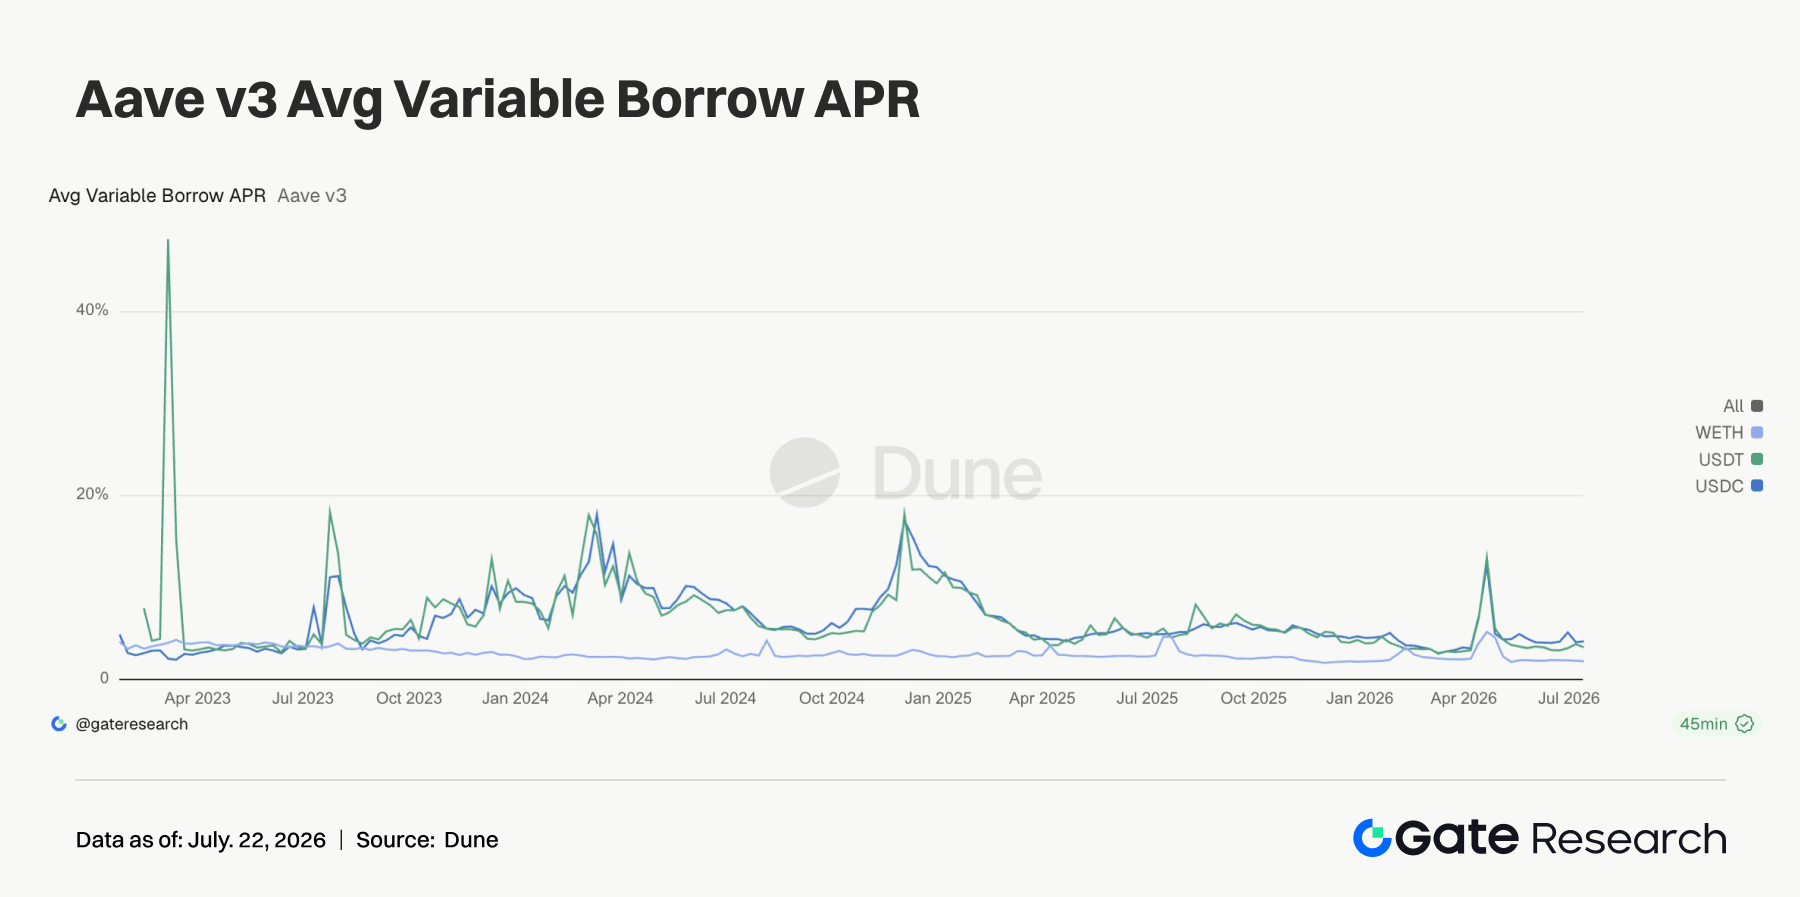
Rates in Aave’s core Ethereum market were broadly stable last week. The average USDC borrowing rate was approximately 4.19%, slightly higher than the previous week, while the weekly peak remained close to 14%. This indicates that USDC can still face brief funding stress when trading activity concentrates around popular themes. The average USDT rate fell from about 3.87% to 3.54%, while its peak rate declined from 9.37% to 3.74%, showing a marked easing of tail pressure. The average WETH rate edged down to roughly 2.02%, and growth in ETH loan balances did not translate into aggressive leveraged long positioning. ETH’s price and ETF flows provided market direction, but traders continued to limit leverage; stablecoin financing demand was driven more by short-term themes and arbitrage.
3.6 Protocol revenue fails to broaden with market narratives as cooling meme trading weighs on application-layer income
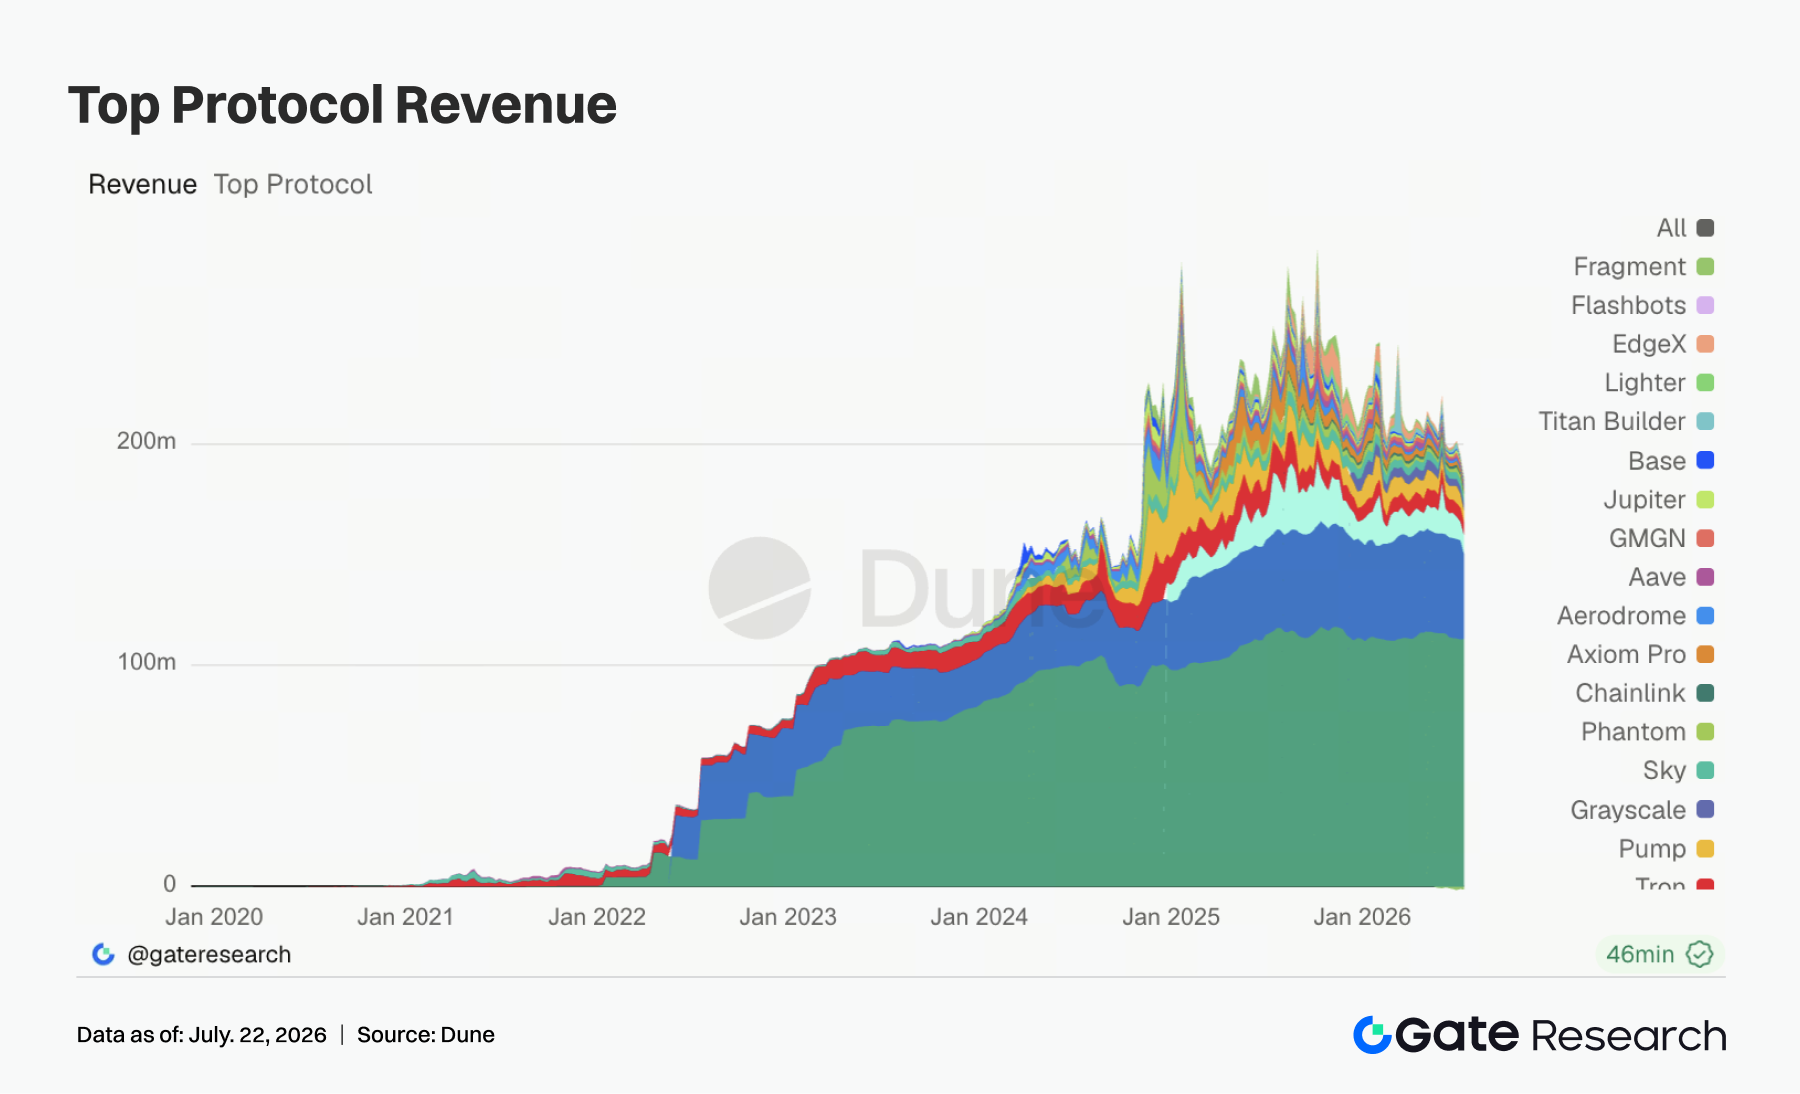
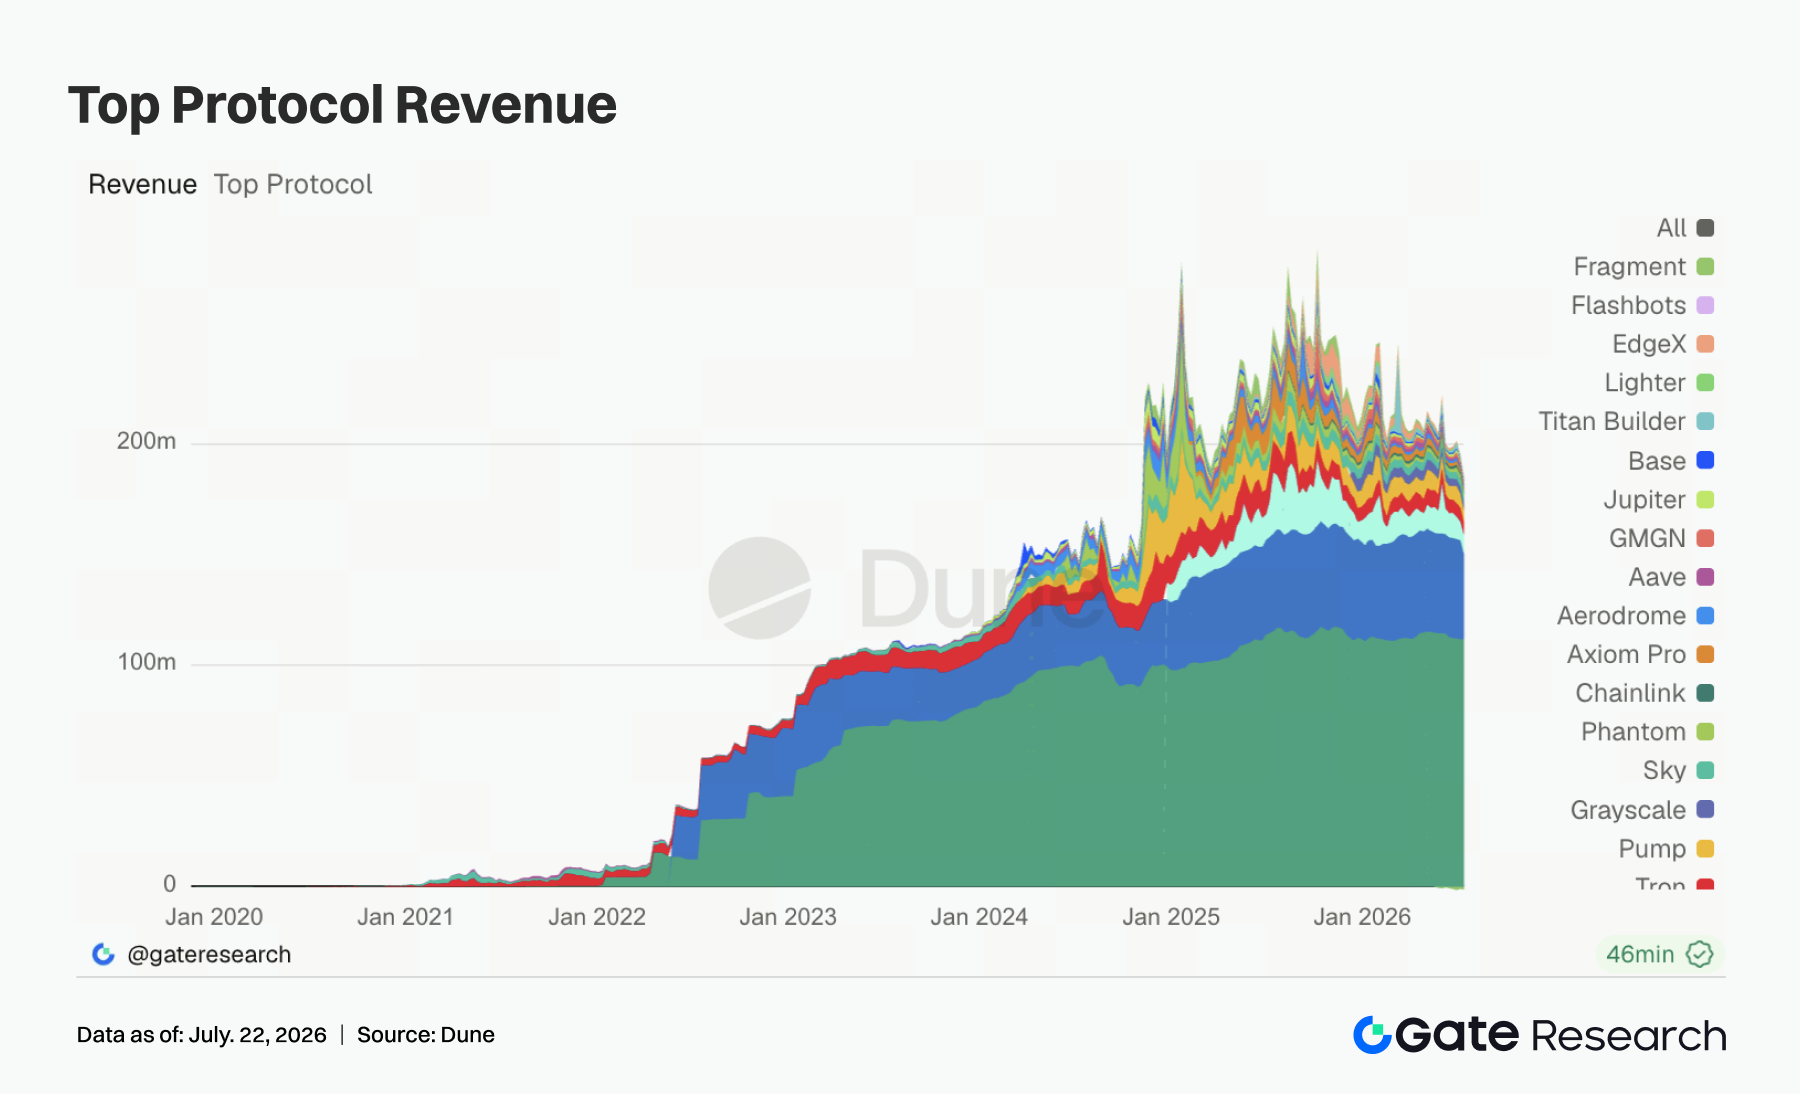
Protocol revenue last week reflected a market with numerous themes but limited profit dispersion. Tether revenue was broadly flat at approximately $112 million. Circle revenue declined to about $38.5 million, affected both by a modest contraction in supply and by competitive narratives such as Open USD. Hyperliquid revenue edged up to around $8.62 million and remained the core source of on-chain derivatives revenue, although growth was limited. Pump revenue fell from approximately $6.32 million to $5.28 million, while GMGN, Jupiter, Axiom Pro, Phantom, and EdgeX all declined significantly, showing that enthusiasm for meme trading and trading applications was cooling from the previous week’s peak. Aave revenue recovered slightly and Base revenue grew markedly, indicating that Ethereum and Layer 2 infrastructure continued to benefit from the return of mainstream narratives. Robinhood Chain, RWAs, ETH ETFs, and stablecoin policy can generate attention, but only stablecoin issuance, core lending, and leading derivatives protocols are consistently converting that attention into revenue.
4. Derivatives Tracking
4.1 BTC funding rates remain positive; prices consolidate at elevated levels while leverage expansion stays limited
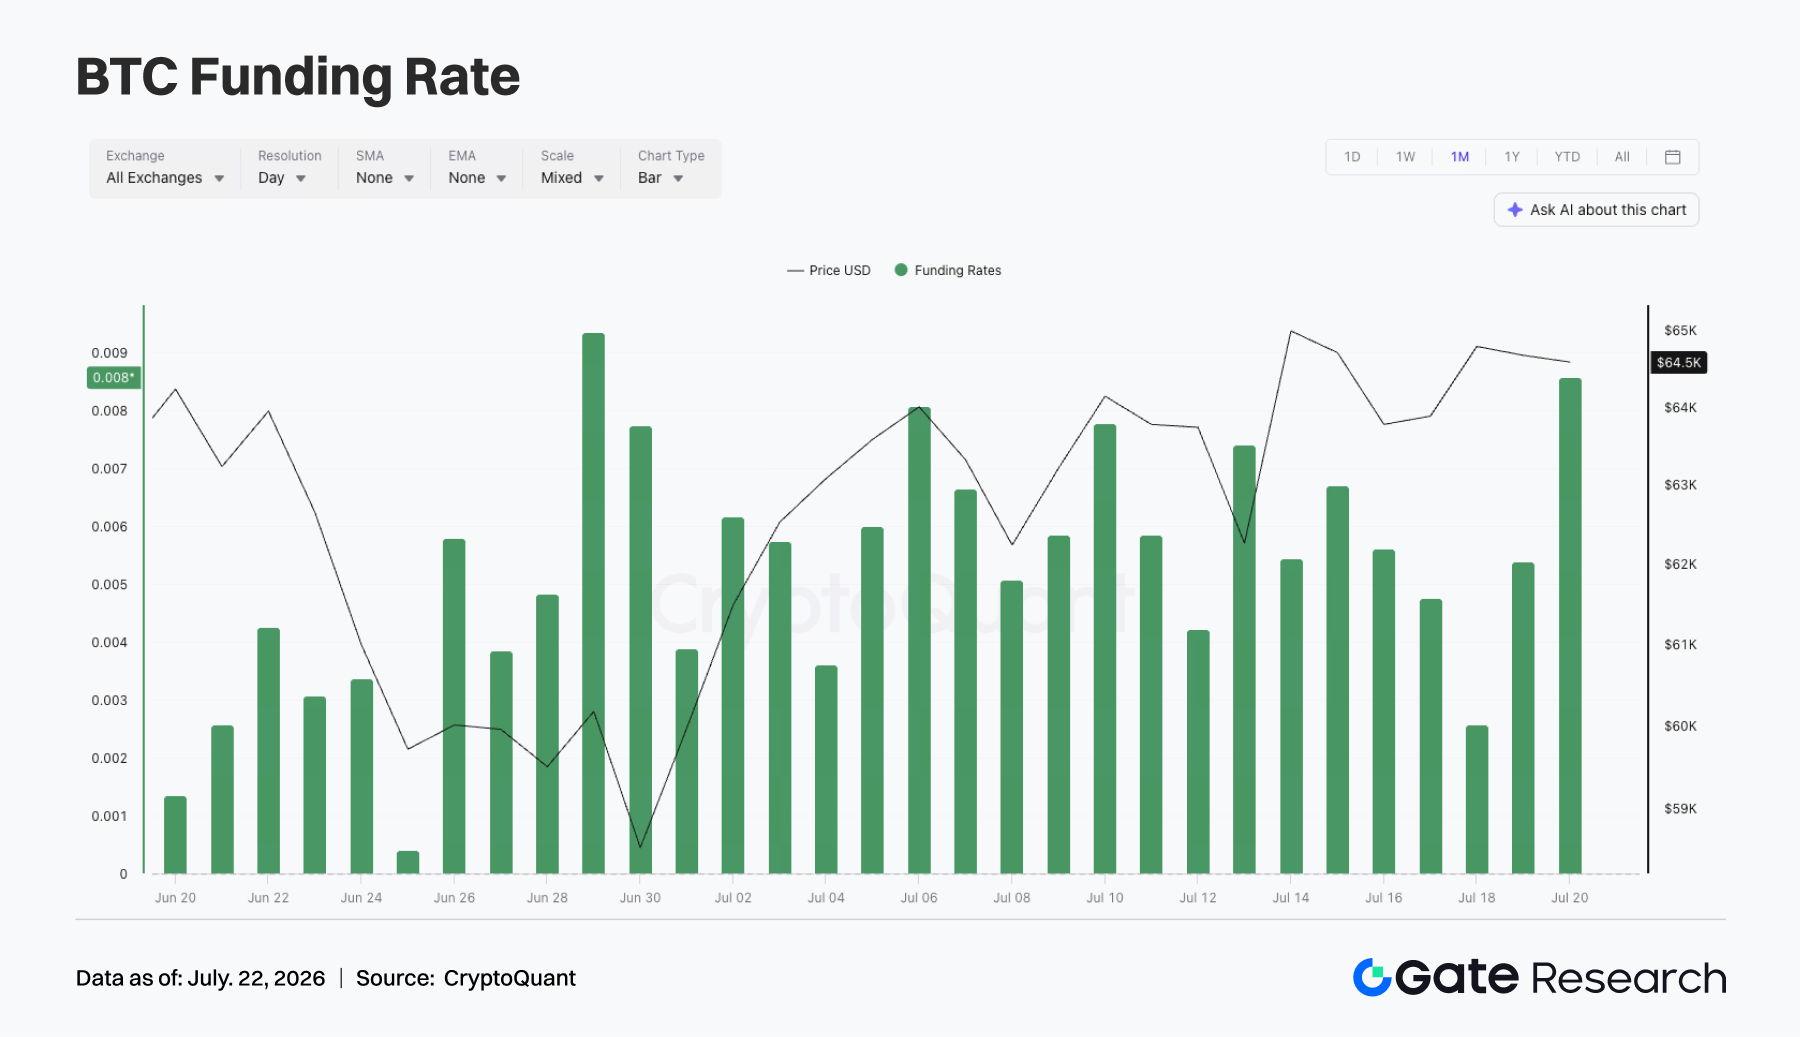
BTC remained in a choppy recovery pattern last week. It traded near $64,000 early in the week and briefly approached $65,000 on July 14, then fell back toward $63,000 around July 16 before recovering to the $64,000–$65,000 range by the weekend. Overall, the price center moved higher than in the previous week, but no one-way breakout emerged. Open interest also remained range-bound. It stood at approximately $21.4 billion around July 13, briefly rose above $22 billion alongside the price advance on July 14, then fell back toward $21.2 billion before recovering to about $21.6 billion over the weekend. Prices remained elevated, but open interest did not expand persistently, suggesting that leveraged participation recovered without creating obvious crowded momentum chasing.
Funding rates remained positive throughout the week, mostly within the 0.005–0.008 range, indicating that bullish sentiment continued to dominate. Funding rose again around July 20, suggesting strong expectations for a continued rebound. However, positive funding did not drive a rapid BTC breakout, reflecting some cost pressure on long positions. Overall, BTC derivatives last week exhibited a structure of elevated price consolidation, positive funding rates, and range-bound open interest. This was not a typical deleveraging environment, but bullish sentiment was already substantial. If BTC can hold above $65,000, leveraged capital may continue to return. If the price falls below $63,000, long positions in a positive-funding environment may face a period of drawdown pressure.
4.2 Options volume spikes intermittently while monthly contracts continue to dominate
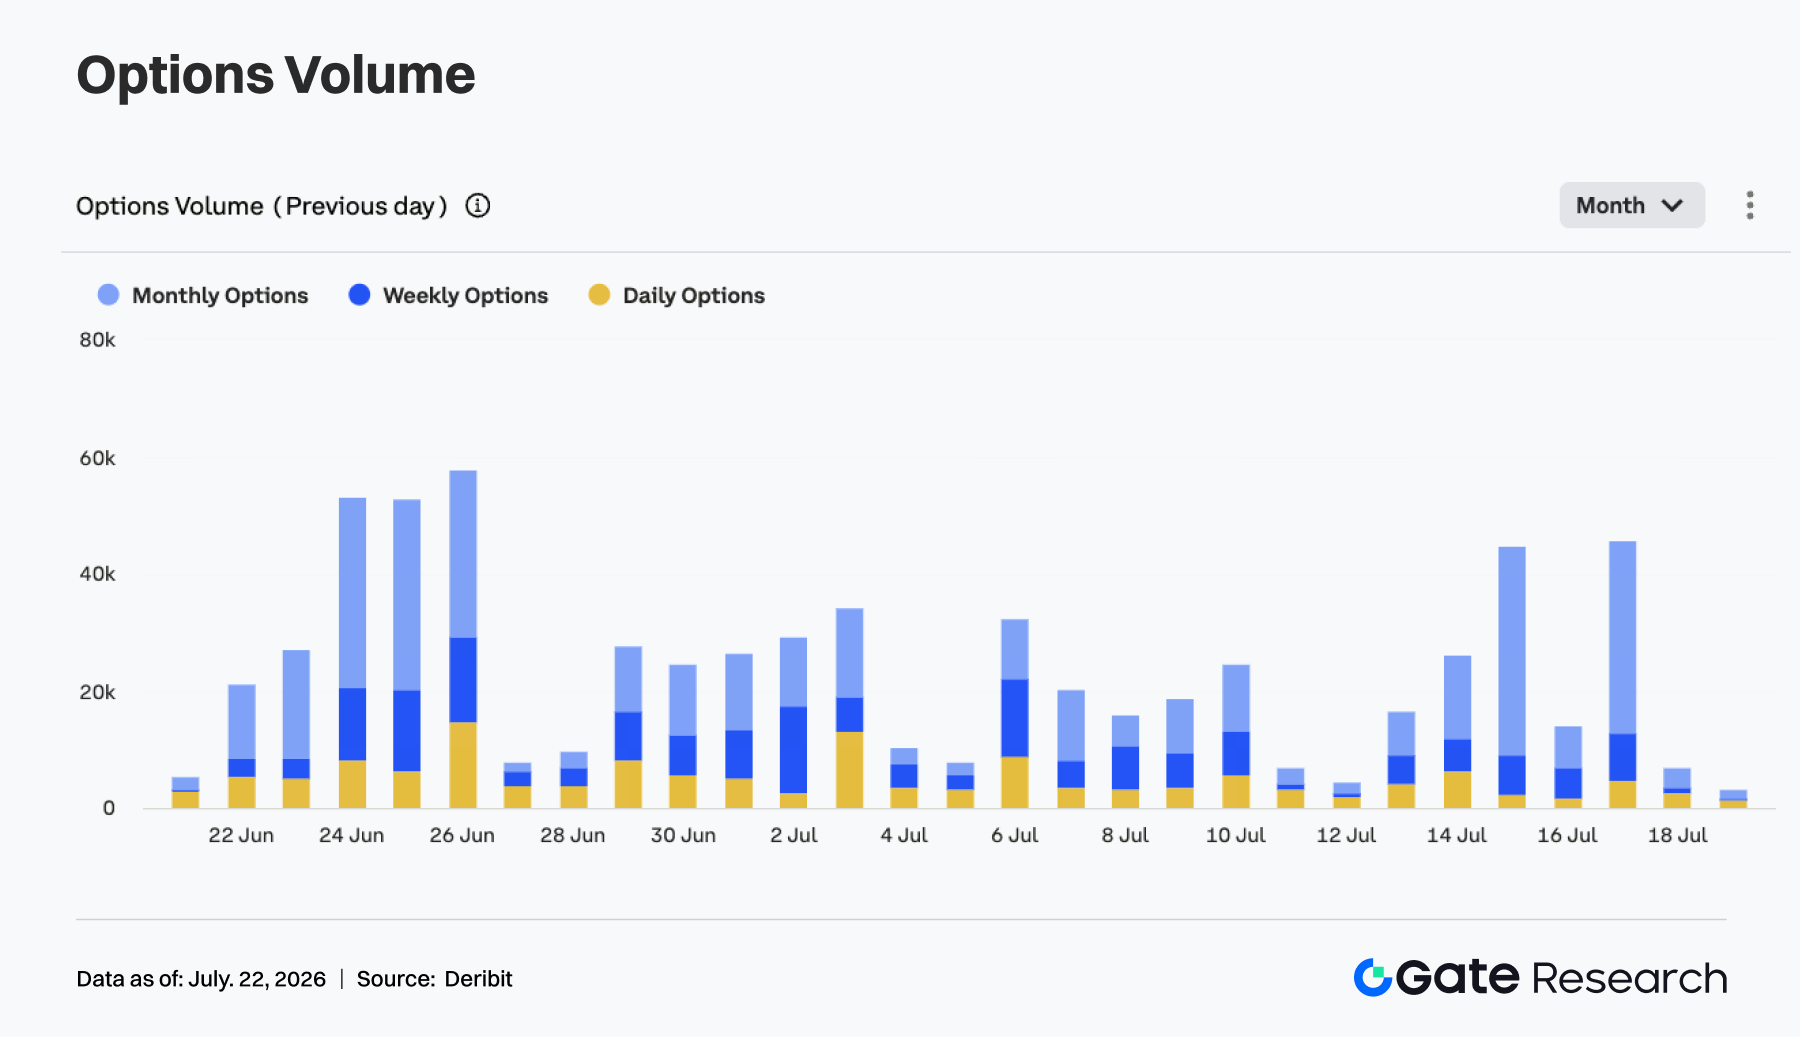
Options volume increased in bursts last week. Volume was relatively low on July 13 at around 7,000 contracts, rose to approximately 26,000 on July 14, and then expanded sharply to about 45,000 on July 15, one of the week’s peaks. Volume approached 46,000 again on July 17, indicating strong demand for position rolling and risk management while prices consolidated at elevated levels. Structurally, monthly options continued to account for most trading volume. Their share was particularly high during the volume surges on July 15 and 17, suggesting that participants remained focused on medium-term directional positioning and portfolio adjustment. Weekly options also remained active, but were used more for short-term trading and tactical hedging.
Daily options volume increased on certain trading days but remained a limited share overall, indicating that the market did not shift materially toward ultra-short-term speculation. Weekend volume quickly fell below 10,000 contracts, reflecting a clear cooling in activity after the event window. Overall, last week’s options market featured intermittent volume spikes during elevated price consolidation. The increase in volume came primarily from monthly-contract rolling and risk management, rather than sustained panic buying of protection. If BTC breaks above $65,000, options volume may expand again alongside directional trading. If it continues to move sideways, volume may remain range-bound at low levels.
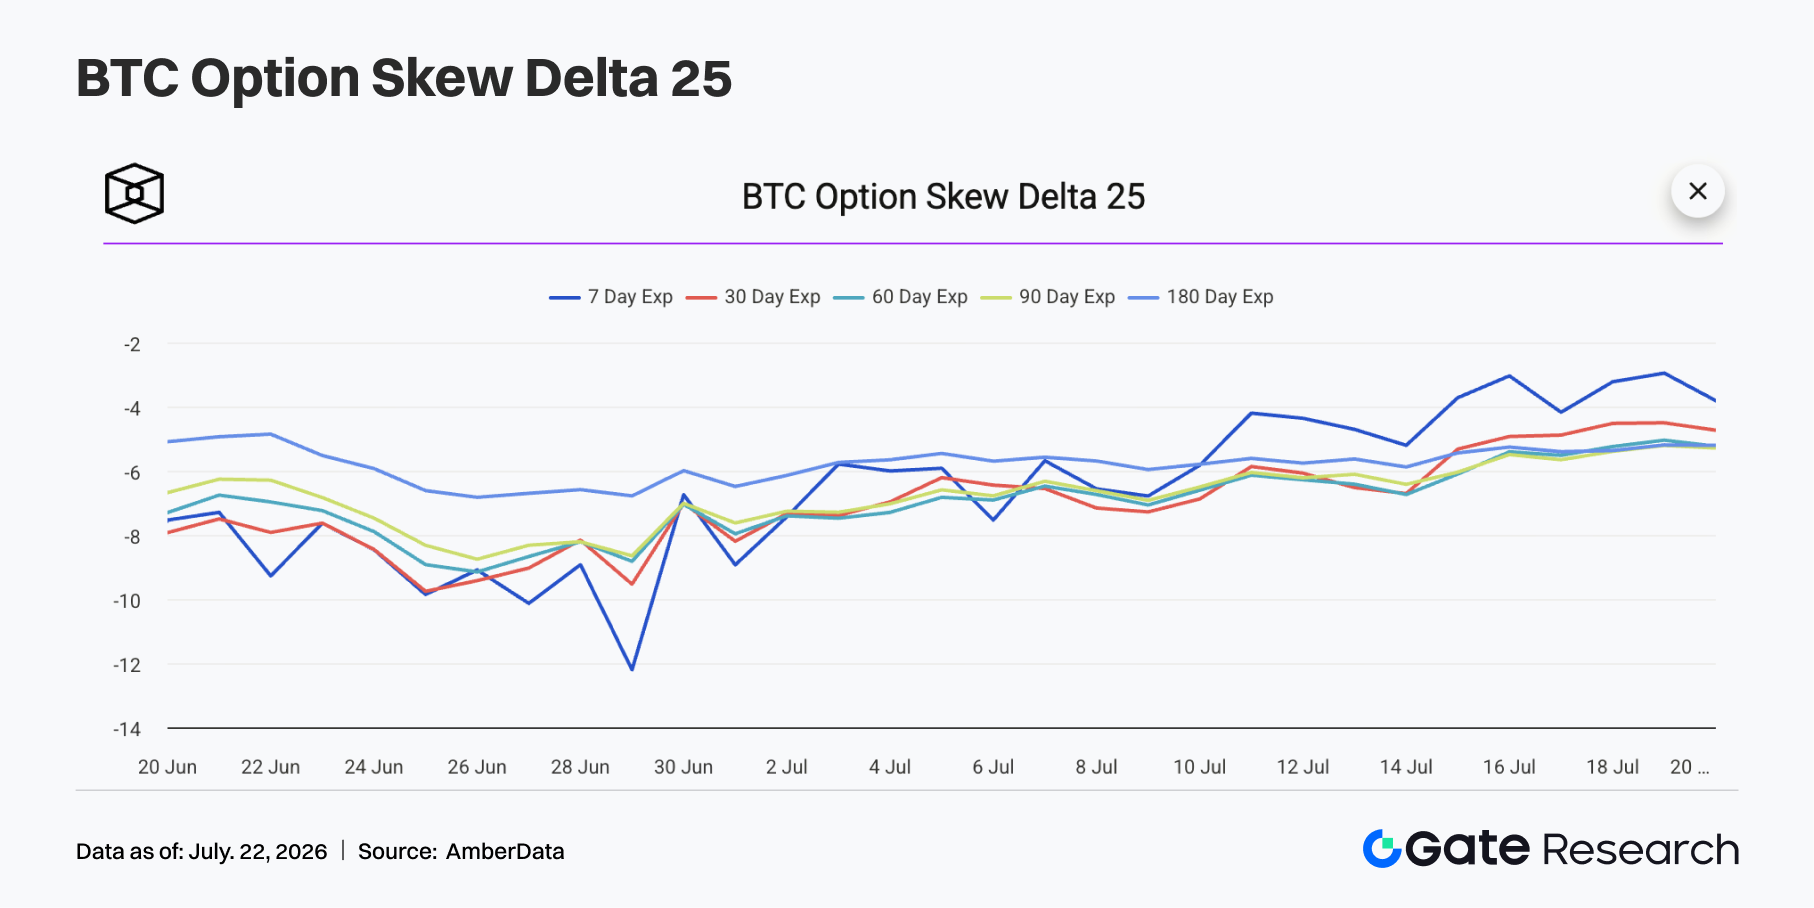
4.3 The 25D skew continues to normalize as defensive sentiment eases markedly
Across maturities, BTC’s 25D skew continued to normalize last week. Short-dated skew remained around -5 to -6 early in the week, showing that some demand for downside protection persisted. However, defensive sentiment had eased significantly compared with the deeply negative readings seen in late June. From July 15 to 17, the 7D skew recovered to around -3 at one point, clearly above other maturities, indicating a rapid decline in the premium for short-term put protection and reduced concern about an abrupt near-term selloff. The 30D, 60D, 90D, and 180D skews also improved, with most trading in the -5 to -6 range.
Within the term structure, short-dated skew improved more substantially, reflecting a clearer improvement in near-term risk pricing. Medium- and long-dated skew remained negative, indicating that although the market was no longer extremely defensive, it still assigned a premium to medium-term drawdown risk. Overall, last week’s skew structure showed a continued decline in demand for protection and more stable options sentiment than in previous weeks. If BTC holds above $65,000, short-dated skew may continue moving toward neutral. If the price falls below $63,000, demand for protection may rise again.
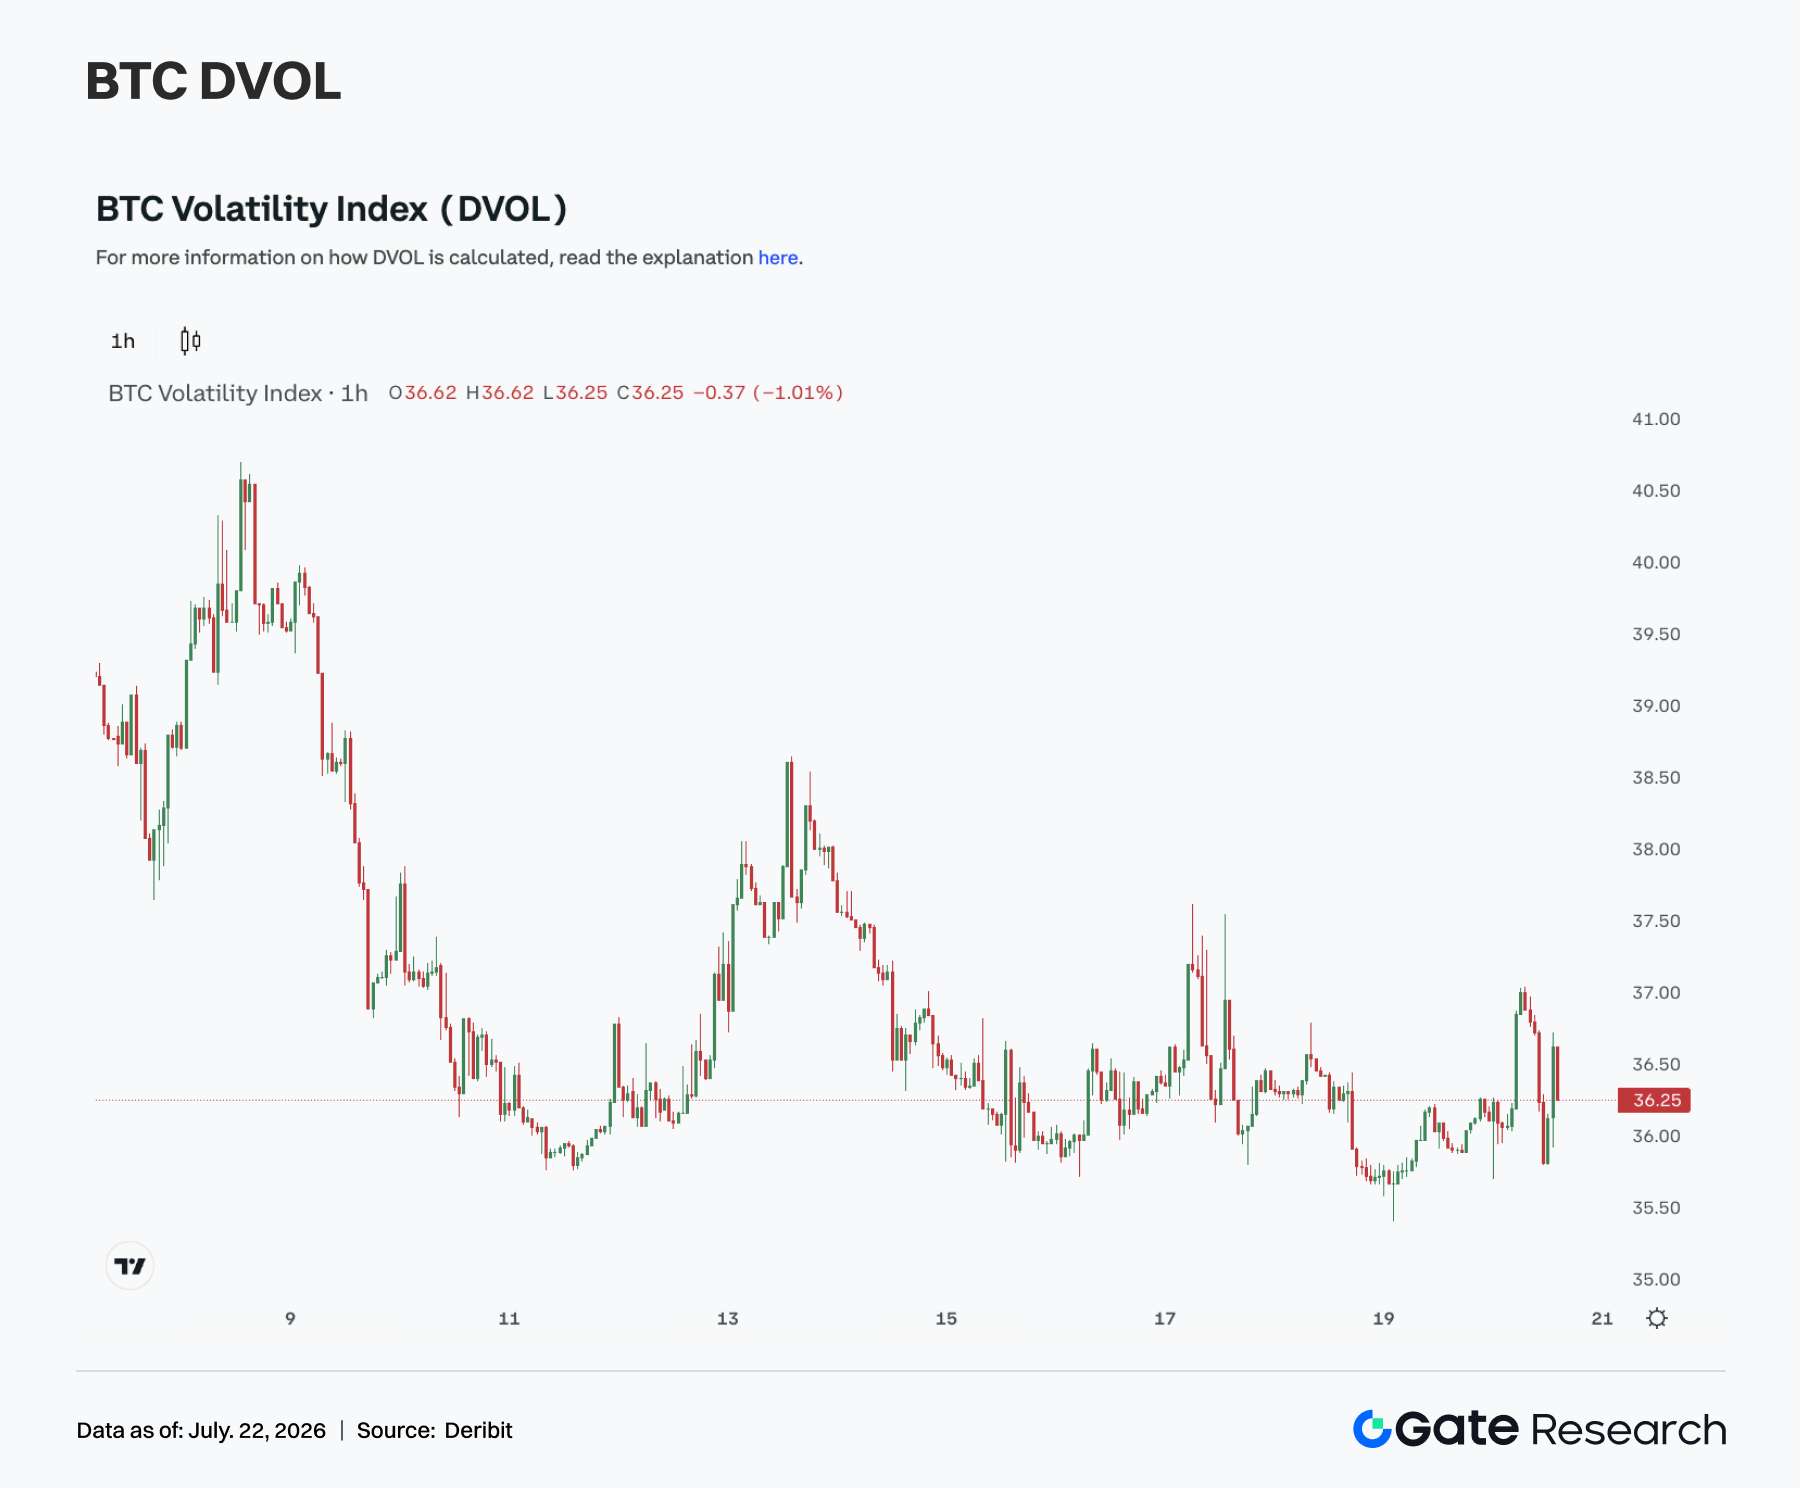
4.4 DVOL remains range-bound at low levels as volatility expectations continue to compress
In volatility markets, BTC’s DVOL index remained range-bound at low levels last week. DVOL traded near 36 early in the week. Although it staged several short-lived rebounds between July 13 and 17, it failed to break above 38, indicating restrained pricing of large market moves. With BTC consolidating at elevated levels, skew continuing to normalize, and options volume failing to expand persistently, DVOL remained within the 35.5–37 range. Compared with levels above 45 in late June, the current volatility risk premium has declined significantly.
Low DVOL indicates limited short-term market panic, but it also means volatility pricing is compressed. Once prices break out of the current range, volatility may expand again, especially with funding rates remaining positive and open interest yet to decline materially; derivatives positioning could amplify directional moves. Overall, BTC is currently in a combined state of elevated price consolidation, normalizing skew, and low DVOL. If the price remains within the $63,000–$65,000 range, DVOL may stay low. If the price breaks above or below the range, volatility could rebound rapidly.
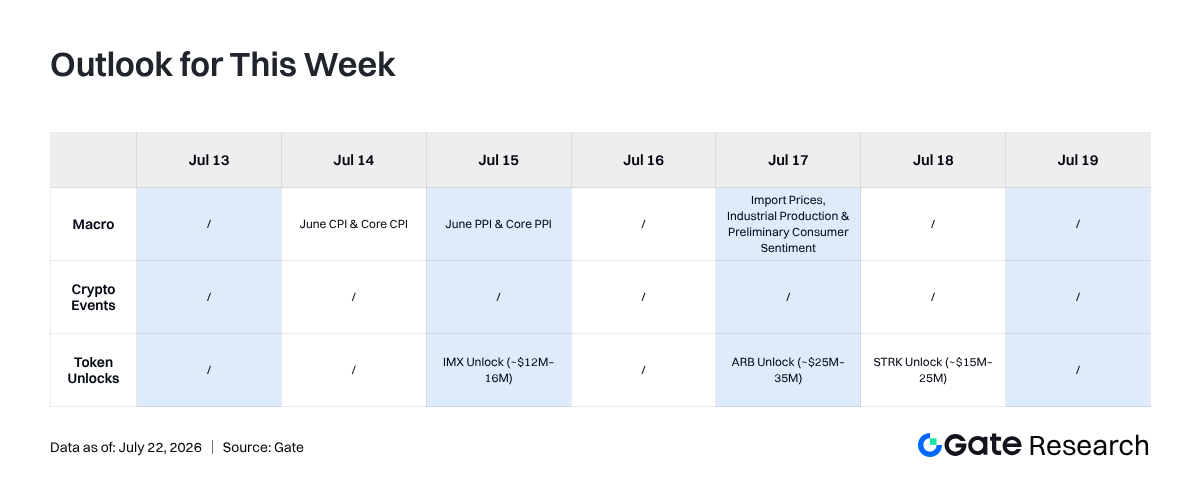
5. Outlook for This Week
Data Sources:
- Investing, https://investing.com/currencies/xau-usd-historical-data
- Gate, https://www.gate.com/trade/BTC_USDT
- CMC, https://coinmarketcap.com/real-world-assets/?type=all-tokens
- Coinglass, https://www.coinglass.com/pro/depth-delta
- Dune, https://dune.com/gateresearch/gate-tradfi#weekly-volume
- Dune, https://dune.com/gateresearch/gate-institutional-weekly-report
- Bybit, https://www.bybit.com/future-activity/en/tradfi
- Bitget, https://www.bitgettradfi.com/tradfi/XAUUSD
- CryptoQuant, https://cryptoquant.com/asset/btc/chart/derivatives
- Amberdata, https://pro.amberdata.io/options/deribit/btc/current/
Gate Research is a comprehensive blockchain and cryptocurrency research platform that provides deep content for readers, including technical analysis, market insights, industry research, trend forecasting, and macroeconomic policy analysis.
Disclaimer
Investing in cryptocurrency markets involves high risk. Users are advised to conduct their own research and fully understand the nature of the assets and products before making any investment decisions. Gate is not responsible for any losses or damages arising from such decisions.