#BTC
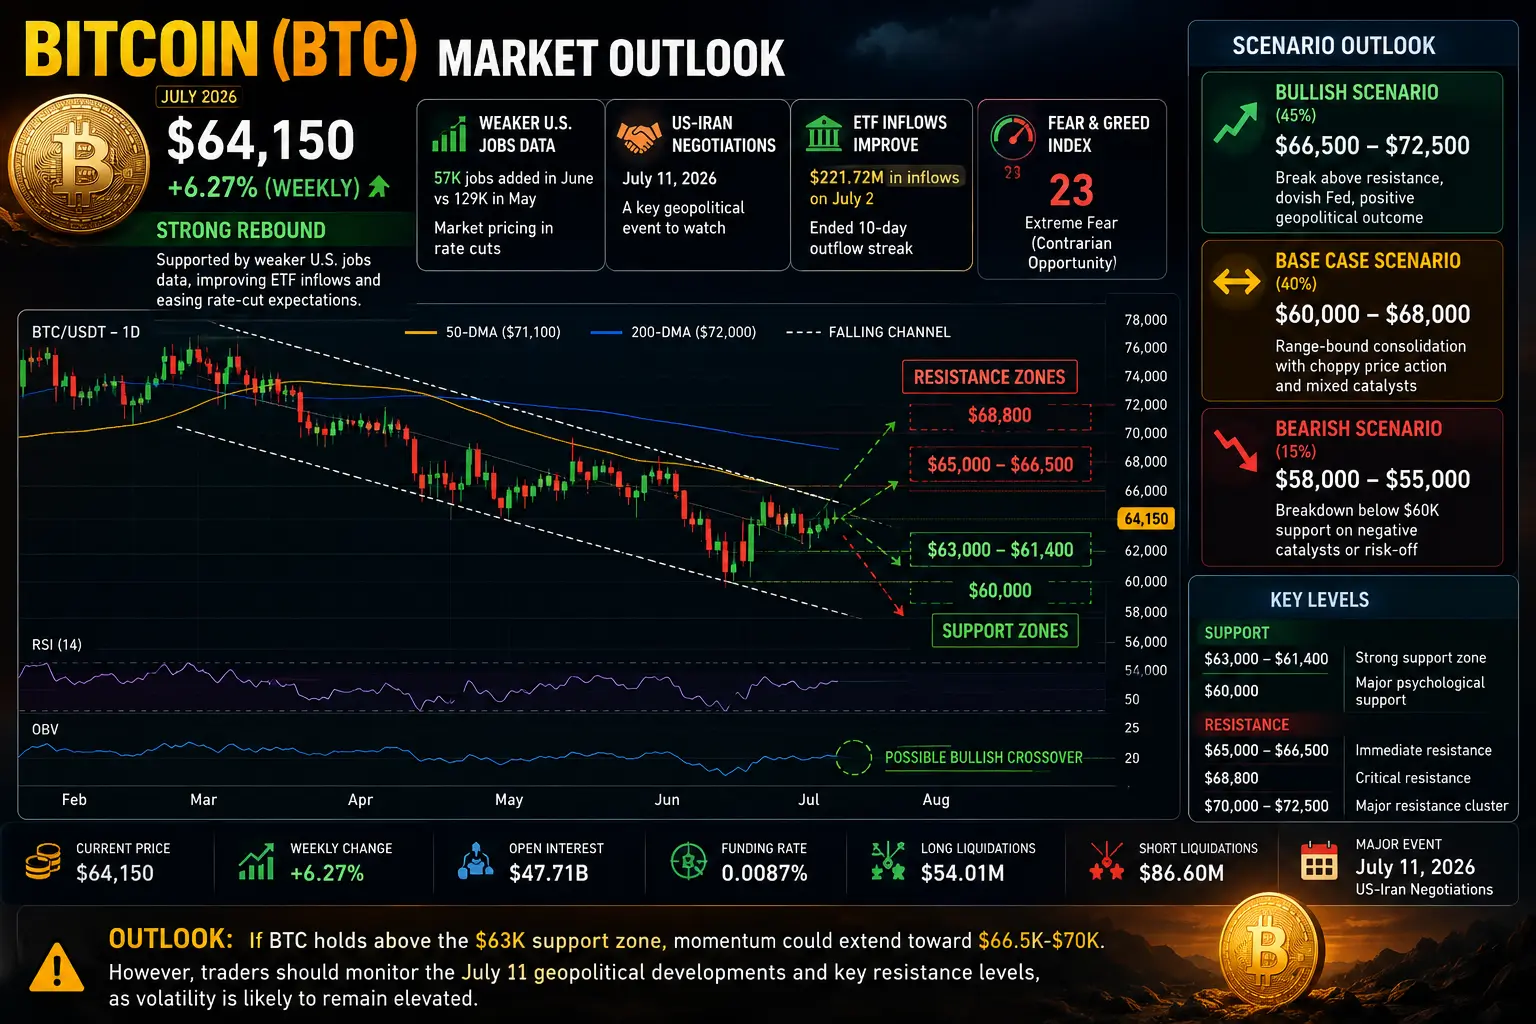
Bitcoin has demonstrated remarkable resilience in early July 2026, recovering from the $60,500 trough to reach approximately $64,150, representing a substantial 6.27% weekly gain. This recovery marks Bitcoin's best weekly performance since March 2026, signaling a potential shift in market sentiment. The cryptocurrency has successfully reclaimed critical psychological support levels, though the broader technical structure remains cautiously optimistic pending confirmation of sustained bullish momentum.
Weak Non-Farm Payroll (NFP) Data Impact
The June 2026 Non-Farm Payroll report revealed significantly weaker-than-expected labor market conditions, with the U.S. economy adding merely 57,000 jobs compared to the 129,000 recorded in May 2026. This represents a 55.81% month-over-month decline in job creation, substantially below economist expectations of 110,000 new positions. The dramatic slowdown in hiring has fundamentally altered the Federal Reserve policy outlook, with market participants now pricing in increased probability of rate cuts rather than additional tightening measures.
The employment data weakness extends beyond the headline figure. The U.S. unemployment rate technically declined, but this improvement masks underlying deterioration as approximately 720,000 individuals exited the labor force entirely. Household employment fell by 507,000 positions in June, a magnitude typically associated with recessionary conditions rather than soft landing scenarios.
Weaker employment data generally strengthens market expectations for Federal Reserve accommodation, reducing the dollar index and providing upward pressure on risk assets including cryptocurrencies. Bitcoin has historically demonstrated positive correlation with environments characterized by falling real yields and dovish central bank positioning.
US IRAN Negotiations Scheduled for July 11, 2026
Geopolitical developments surrounding the US-Iran negotiations represent a significant catalyst for Bitcoin price action. The scheduled diplomatic discussions on July 11, 2026, carry substantial implications for global risk sentiment and cryptocurrency markets. Previous negotiations have demonstrated immediate impact on Bitcoin pricing, with the cryptocurrency climbing from $63,600 to $65,800 following positive developments in prior talks.
The US-Iran deal framework encompasses multiple dimensions including reconstruction funding, asset unfreezing, and Strait of Hormuz sovereignty recognition. Iranian officials have indicated discussions regarding the unfreezing of $6 billion in financial assets, which could have cascading effects on global capital flows and risk asset pricing.
Institutional Flows and ETF Dynamics
U.S. spot Bitcoin ETFs have exhibited encouraging flow patterns, recording $221.72 million in net inflows on July 2, 2026, effectively ending a concerning 10-day outflow streak that accumulated $2.7 billion in redemptions. This reversal in institutional sentiment provides meaningful support for Bitcoin's recovery narrative. The 30-day cumulative outflow of $6.16 billion remains a headwind, but the recent positive print suggests dip-buying activity among institutional participants.
Strategy (formerly MicroStrategy) maintains holdings of 847,363 BTC acquired at an average cost basis of $75,651 per coin, representing an investment of approximately $64.1 billion. The company's first-ever Bitcoin liquidation in May 2026, totaling $216 million, marked a significant shift from previous commitments.
Market Sentiment Indicators
The Crypto Fear & Greed Index currently registers 23, indicating Extreme Fear territory. While seemingly bearish, extreme fear readings historically represent contrarian buying opportunities. The combination of rising open interest at $47.71 billion and moderate funding rates of 0.0087% indicates fresh leverage accumulation without euphoric positioning.
Current Technical Structure
Bitcoin's price action reveals a market attempting to establish bullish momentum following extended consolidation. The cryptocurrency trades below both the 50-day moving average at $71,100 and the 200-day moving average at $72,000, maintaining a bearish daily structure. However, recent price stabilization above $64,000 suggests potential for trend reversal if resistance levels are successfully reclaimed.
Critical Support Levels
Immediate support is established at the $63,000 to $60,000 zone, with the psychologically significant $60,000 level representing maximum downside protection. A breakdown below $60,000 would expose Bitcoin to deeper corrections toward the $58,000 to $55,000 range, representing potential drawdowns of 9.36% to 14.26% from current levels. The $61,400 level serves as intermediate support.
Critical Resistance Levels
Immediate resistance is encountered at the $65,000 to $66,500 zone, representing the first significant barrier to upside continuation. Successful breach of this level would open pathways toward the $68,800 resistance zone. The $70,000 to $72,500 range represents the major resistance cluster, encompassing the 50-day and 200-day moving averages.
The $70,000 target represents approximately 9.13% upside from current levels of $64,150. Achievement of this target would require sustained buying pressure and favorable macroeconomic conditions.
Bullish Scenario (Probability: 45%)
Under favorable conditions including successful US-Iran negotiations, dovish Federal Reserve guidance, and sustained institutional inflows, Bitcoin could advance toward the $70,000 to $72,500 resistance cluster. Achievement of $70,000 would represent 9.13% appreciation, while extension toward $72,500 would constitute 13.02% upside.
The bullish case is supported by historical July seasonality, with prior Bottom Year July performances in 2018 and 2022 averaging approximately 19% bounces.
Base Case Scenario (Probability: 40%)
The base case envisions continued consolidation within the $60,000 to $68,000 range, with Bitcoin attempting gradual recovery toward the $66,000 to $68,000 zone. Under this scenario, the $70,000 target remains achievable but requires extended timeframe.
Bearish Scenario (Probability: 15%)
Adverse developments could trigger renewed downside pressure, with Bitcoin risking breakdown below $60,000 support and potential extension toward $58,000 to $55,000 levels.
For Conservative Traders
Conservative market participants should await confirmation of support above $63,000 before establishing long positions. Entry targeting the $63,500 to $64,000 zone with stop-loss placement below $61,400 provides favorable risk-reward dynamics. Profit targets should be staged at $66,500 (3.65% gain), $68,800 (7.25% gain), and $70,000 (9.13% gain).
For Aggressive Traders
Aggressive traders may consider current levels for partial position establishment, with additional accumulation on any dips toward $62,000 to $63,000. Target zones at $68,800 and $72,500 offer attractive reward potential.
Risk Management Framework
All traders should implement strict position sizing discipline, with maximum single-position risk limited to 2% of trading capital. Stop-loss orders must be honored without exception.
Additional Bullish Catalysts
Regulatory clarity regarding cryptocurrency taxation and custody frameworks would reduce institutional friction. Expansion of spot ETF offerings in international markets would broaden capital access. Corporate treasury adoption by additional publicly traded companies would validate Bitcoin's store-of-value thesis.
Technological developments including Lightning Network adoption growth and layer-2 scaling solutions could improve Bitcoin's utility profile. Macroeconomic factors including dollar weakness, inflation persistence, and sovereign debt concerns may drive capital toward Bitcoin as alternative store-of-value.
Bitcoin's current positioning at $64,150 represents a critical juncture, with the cryptocurrency attempting to establish sustainable recovery following extended consolidation. The confluence of weak NFP data supporting dovish Federal Reserve expectations, scheduled US-Iran negotiations, and improving institutional flows creates a constructive backdrop for potential advancement toward the $70,000 target.
Technical analysis suggests immediate resistance at $65,000 to $66,500, with major resistance at $72,500. Support is well-established at $60,000 to $63,000. The path toward $70,000 requires approximately 9.13% appreciation from current levels, a target that appears achievable under favorable conditions.
#BTCMarketAnalysis @Gate_Square
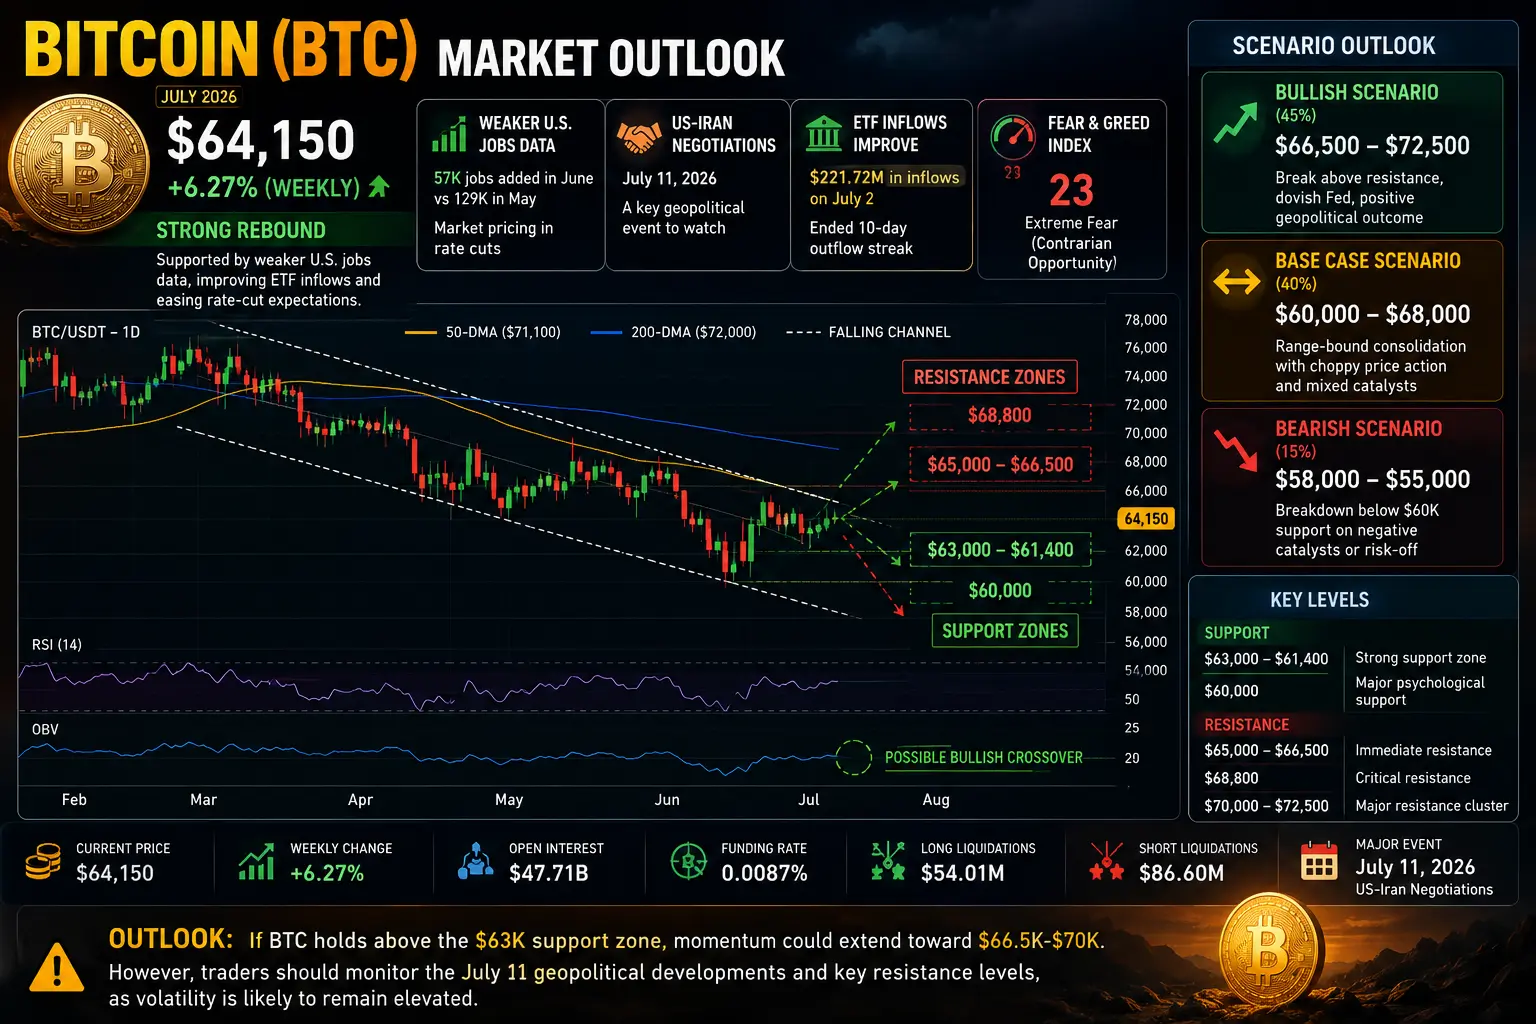
Bitcoin has demonstrated remarkable resilience in early July 2026, recovering from the $60,500 trough to reach approximately $64,150, representing a substantial 6.27% weekly gain. This recovery marks Bitcoin's best weekly performance since March 2026, signaling a potential shift in market sentiment. The cryptocurrency has successfully reclaimed critical psychological support levels, though the broader technical structure remains cautiously optimistic pending confirmation of sustained bullish momentum.
Weak Non-Farm Payroll (NFP) Data Impact
The June 2026 Non-Farm Payroll report revealed significantly weaker-than-expected labor market conditions, with the U.S. economy adding merely 57,000 jobs compared to the 129,000 recorded in May 2026. This represents a 55.81% month-over-month decline in job creation, substantially below economist expectations of 110,000 new positions. The dramatic slowdown in hiring has fundamentally altered the Federal Reserve policy outlook, with market participants now pricing in increased probability of rate cuts rather than additional tightening measures.
The employment data weakness extends beyond the headline figure. The U.S. unemployment rate technically declined, but this improvement masks underlying deterioration as approximately 720,000 individuals exited the labor force entirely. Household employment fell by 507,000 positions in June, a magnitude typically associated with recessionary conditions rather than soft landing scenarios.
Weaker employment data generally strengthens market expectations for Federal Reserve accommodation, reducing the dollar index and providing upward pressure on risk assets including cryptocurrencies. Bitcoin has historically demonstrated positive correlation with environments characterized by falling real yields and dovish central bank positioning.
US IRAN Negotiations Scheduled for July 11, 2026
Geopolitical developments surrounding the US-Iran negotiations represent a significant catalyst for Bitcoin price action. The scheduled diplomatic discussions on July 11, 2026, carry substantial implications for global risk sentiment and cryptocurrency markets. Previous negotiations have demonstrated immediate impact on Bitcoin pricing, with the cryptocurrency climbing from $63,600 to $65,800 following positive developments in prior talks.
The US-Iran deal framework encompasses multiple dimensions including reconstruction funding, asset unfreezing, and Strait of Hormuz sovereignty recognition. Iranian officials have indicated discussions regarding the unfreezing of $6 billion in financial assets, which could have cascading effects on global capital flows and risk asset pricing.
Institutional Flows and ETF Dynamics
U.S. spot Bitcoin ETFs have exhibited encouraging flow patterns, recording $221.72 million in net inflows on July 2, 2026, effectively ending a concerning 10-day outflow streak that accumulated $2.7 billion in redemptions. This reversal in institutional sentiment provides meaningful support for Bitcoin's recovery narrative. The 30-day cumulative outflow of $6.16 billion remains a headwind, but the recent positive print suggests dip-buying activity among institutional participants.
Strategy (formerly MicroStrategy) maintains holdings of 847,363 BTC acquired at an average cost basis of $75,651 per coin, representing an investment of approximately $64.1 billion. The company's first-ever Bitcoin liquidation in May 2026, totaling $216 million, marked a significant shift from previous commitments.
Market Sentiment Indicators
The Crypto Fear & Greed Index currently registers 23, indicating Extreme Fear territory. While seemingly bearish, extreme fear readings historically represent contrarian buying opportunities. The combination of rising open interest at $47.71 billion and moderate funding rates of 0.0087% indicates fresh leverage accumulation without euphoric positioning.
Current Technical Structure
Bitcoin's price action reveals a market attempting to establish bullish momentum following extended consolidation. The cryptocurrency trades below both the 50-day moving average at $71,100 and the 200-day moving average at $72,000, maintaining a bearish daily structure. However, recent price stabilization above $64,000 suggests potential for trend reversal if resistance levels are successfully reclaimed.
Critical Support Levels
Immediate support is established at the $63,000 to $60,000 zone, with the psychologically significant $60,000 level representing maximum downside protection. A breakdown below $60,000 would expose Bitcoin to deeper corrections toward the $58,000 to $55,000 range, representing potential drawdowns of 9.36% to 14.26% from current levels. The $61,400 level serves as intermediate support.
Critical Resistance Levels
Immediate resistance is encountered at the $65,000 to $66,500 zone, representing the first significant barrier to upside continuation. Successful breach of this level would open pathways toward the $68,800 resistance zone. The $70,000 to $72,500 range represents the major resistance cluster, encompassing the 50-day and 200-day moving averages.
The $70,000 target represents approximately 9.13% upside from current levels of $64,150. Achievement of this target would require sustained buying pressure and favorable macroeconomic conditions.
Bullish Scenario (Probability: 45%)
Under favorable conditions including successful US-Iran negotiations, dovish Federal Reserve guidance, and sustained institutional inflows, Bitcoin could advance toward the $70,000 to $72,500 resistance cluster. Achievement of $70,000 would represent 9.13% appreciation, while extension toward $72,500 would constitute 13.02% upside.
The bullish case is supported by historical July seasonality, with prior Bottom Year July performances in 2018 and 2022 averaging approximately 19% bounces.
Base Case Scenario (Probability: 40%)
The base case envisions continued consolidation within the $60,000 to $68,000 range, with Bitcoin attempting gradual recovery toward the $66,000 to $68,000 zone. Under this scenario, the $70,000 target remains achievable but requires extended timeframe.
Bearish Scenario (Probability: 15%)
Adverse developments could trigger renewed downside pressure, with Bitcoin risking breakdown below $60,000 support and potential extension toward $58,000 to $55,000 levels.
For Conservative Traders
Conservative market participants should await confirmation of support above $63,000 before establishing long positions. Entry targeting the $63,500 to $64,000 zone with stop-loss placement below $61,400 provides favorable risk-reward dynamics. Profit targets should be staged at $66,500 (3.65% gain), $68,800 (7.25% gain), and $70,000 (9.13% gain).
For Aggressive Traders
Aggressive traders may consider current levels for partial position establishment, with additional accumulation on any dips toward $62,000 to $63,000. Target zones at $68,800 and $72,500 offer attractive reward potential.
Risk Management Framework
All traders should implement strict position sizing discipline, with maximum single-position risk limited to 2% of trading capital. Stop-loss orders must be honored without exception.
Additional Bullish Catalysts
Regulatory clarity regarding cryptocurrency taxation and custody frameworks would reduce institutional friction. Expansion of spot ETF offerings in international markets would broaden capital access. Corporate treasury adoption by additional publicly traded companies would validate Bitcoin's store-of-value thesis.
Technological developments including Lightning Network adoption growth and layer-2 scaling solutions could improve Bitcoin's utility profile. Macroeconomic factors including dollar weakness, inflation persistence, and sovereign debt concerns may drive capital toward Bitcoin as alternative store-of-value.
Bitcoin's current positioning at $64,150 represents a critical juncture, with the cryptocurrency attempting to establish sustainable recovery following extended consolidation. The confluence of weak NFP data supporting dovish Federal Reserve expectations, scheduled US-Iran negotiations, and improving institutional flows creates a constructive backdrop for potential advancement toward the $70,000 target.
Technical analysis suggests immediate resistance at $65,000 to $66,500, with major resistance at $72,500. Support is well-established at $60,000 to $63,000. The path toward $70,000 requires approximately 9.13% appreciation from current levels, a target that appears achievable under favorable conditions.
#BTCMarketAnalysis @Gate_Square