This article offers a detailed comparison between the blockchain platforms Threshold (T) and NEAR (NEAR), focusing on their scalability and performance for crypto investors and enthusiasts. It examines price history, supply mechanisms, institutional adoption, technical development, and potential risks to help readers determine investment strategies and potential returns. Novice and experienced investors will find insights on the strengths of each platform—T's privacy focus and NEAR's scalable ecosystem. Core issues addressed include investment value, risk management, and market trends presented in an easy-to-scan format for quick decision-making.
Introduction: Investment Comparison of T vs NEAR
In the cryptocurrency market, the comparison between Threshold (T) and NEAR (NEAR) has always been an unavoidable topic for investors. The two not only have significant differences in market cap ranking, application scenarios, and price performance, but also represent different positioning in crypto assets.
Threshold (T): Since its launch, it has gained market recognition for its focus on privacy and security of digital assets on public blockchains.
NEAR (NEAR): Since its inception in 2020, it has been hailed as a highly scalable protocol, ensuring fast support for DApp operation on mobile devices.
This article will comprehensively analyze the investment value comparison between Threshold and NEAR, focusing on historical price trends, supply mechanisms, institutional adoption, technical ecosystems, and future predictions, and attempt to answer the question that investors care about most:
"Which is the better buy right now?"
I. Price History Comparison and Current Market Status
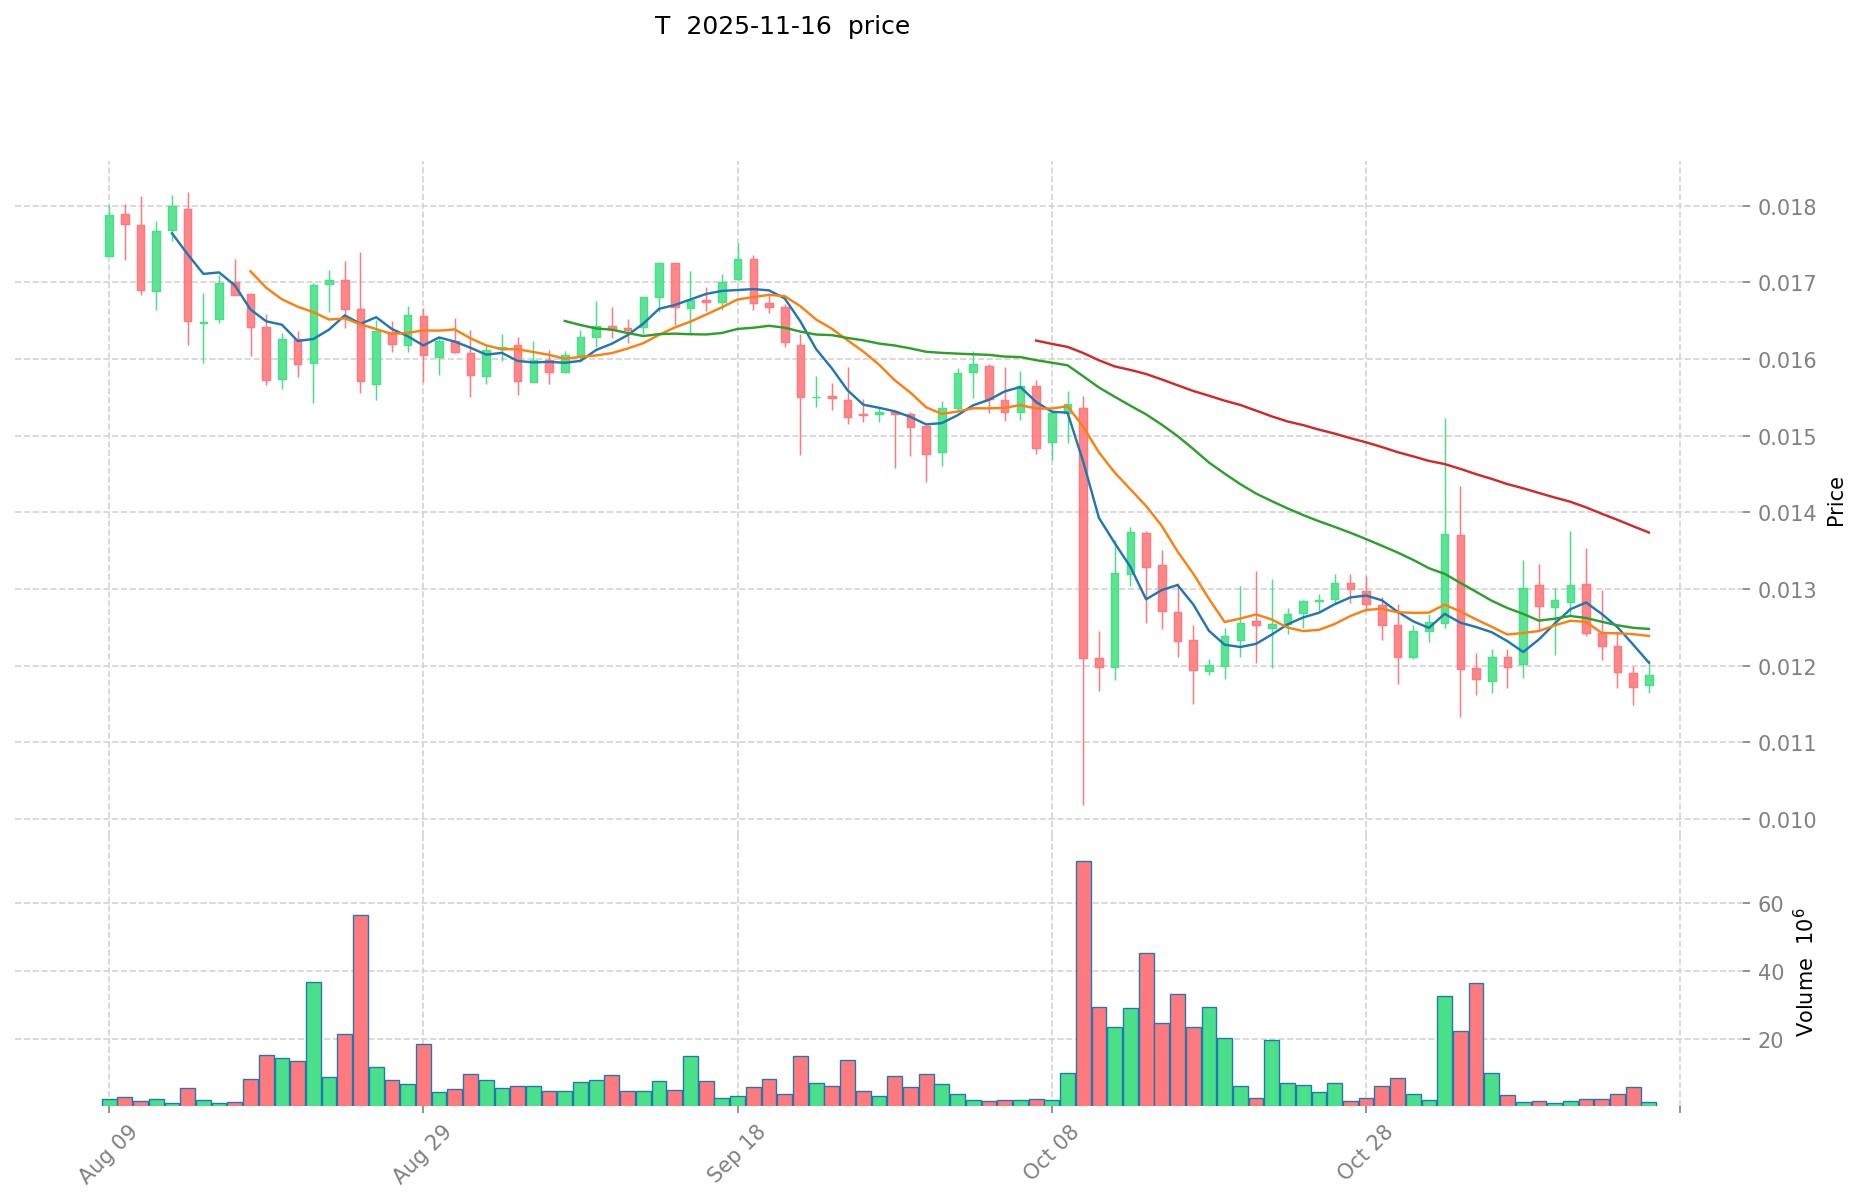
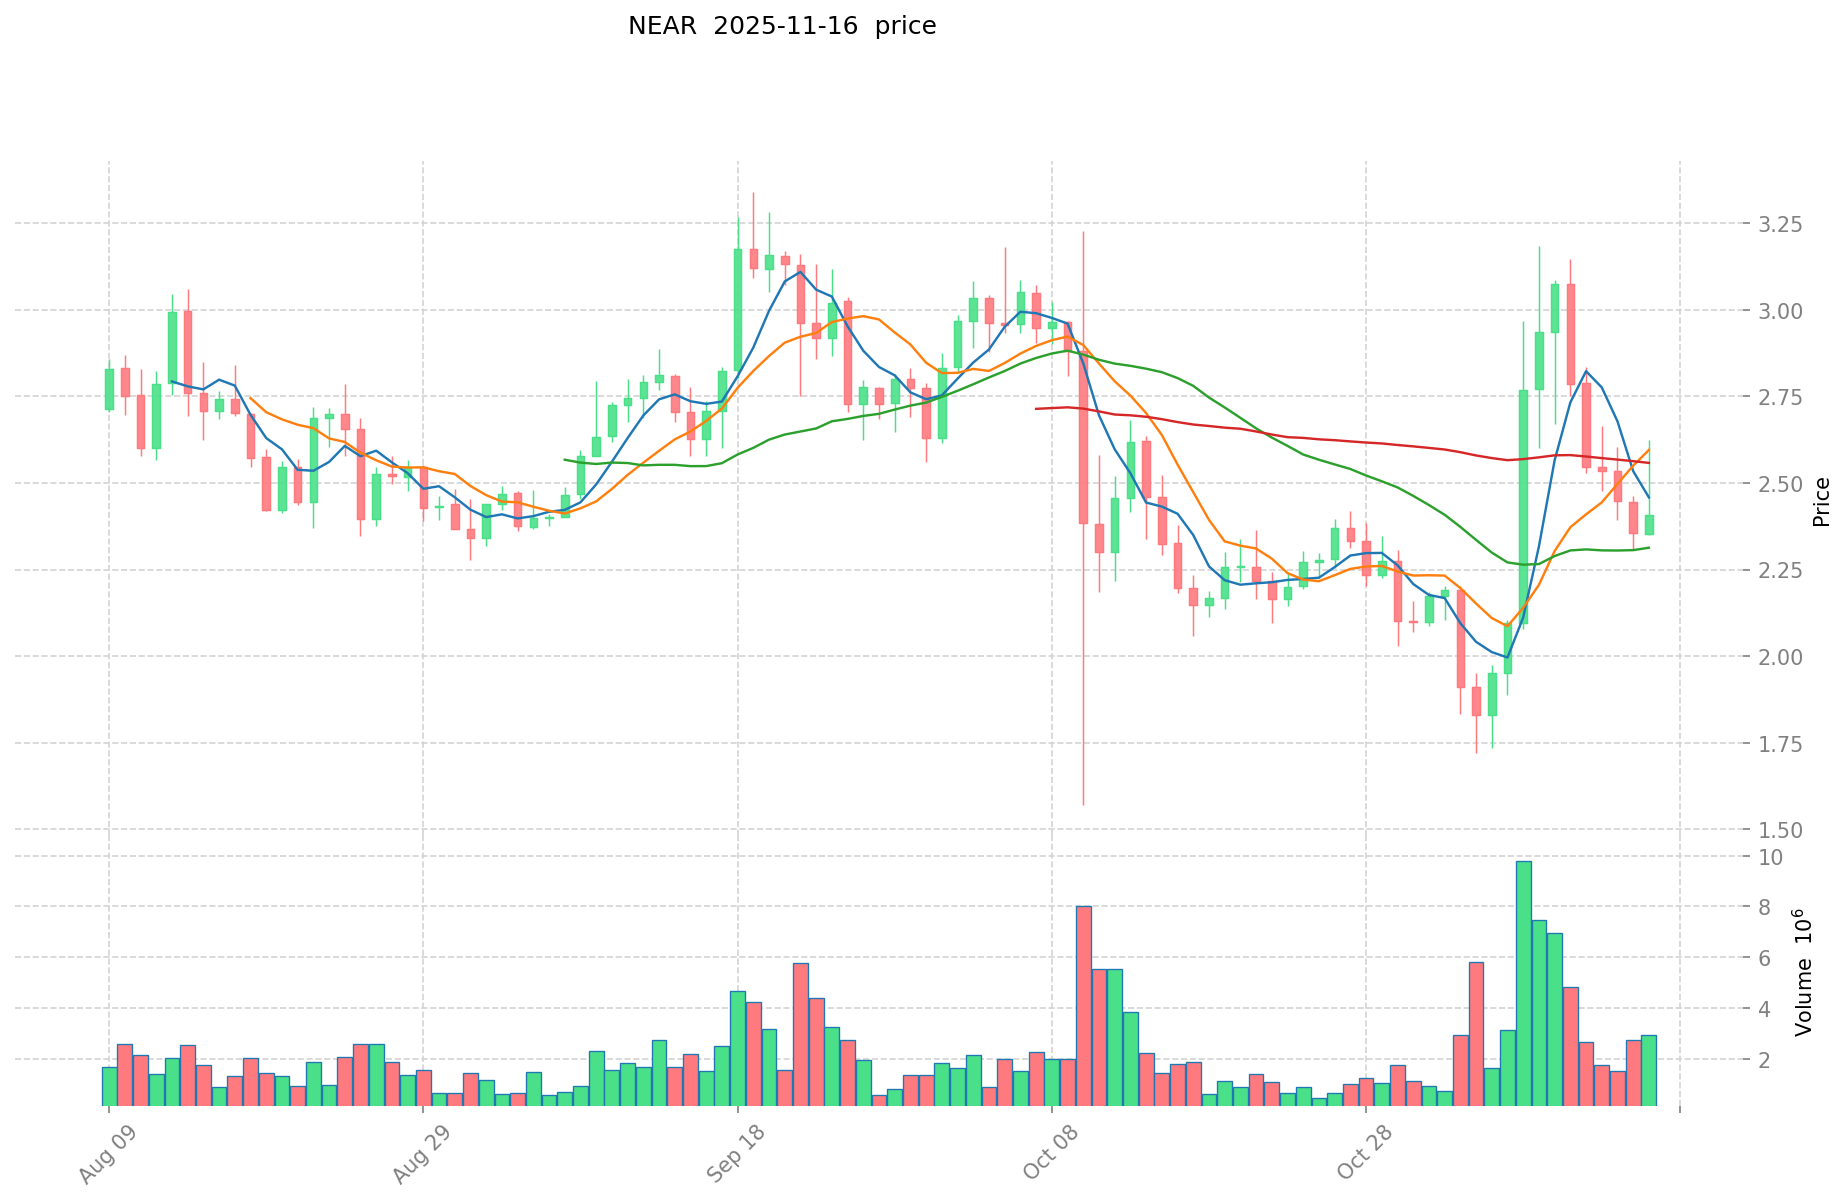
Threshold (T) and NEAR (NEAR) Historical Price Trends
- 2022: NEAR reached its all-time high of $20.44 on January 17, 2022.
- 2025: Threshold (T) hit its all-time low of $0.01101837 on October 11, 2025.
- Comparative analysis: NEAR has experienced a significant decline from its all-time high, while Threshold has recently touched its lowest point.
Current Market Situation (2025-11-16)
- Threshold (T) current price: $0.011867
- NEAR (NEAR) current price: $2.474
- 24-hour trading volume: $12,911.18 (T) vs $6,842,389.36 (NEAR)
- Market Sentiment Index (Fear & Greed Index): 10 (Extreme Fear)
Click to view real-time prices:
- Check Threshold (T) current price Market Price
- Check NEAR (NEAR) current price Market Price
II. Core Factors Influencing T vs NEAR Investment Value
Supply Mechanism Comparison (Tokenomics)
- T: Initial supply of 1 billion tokens, with a maximum supply of 4.1 billion tokens to be reached over approximately 10 years. Emissions are designed to support community growth and development.
- NEAR: Initial supply of 1 billion tokens, with inflation capped at 5% annually. Features a dynamic supply model where 30% of transaction fees are burned, potentially making it deflationary if network usage increases significantly.
- 📌 Historical Pattern: Fixed or decreasing supply models tend to create upward price pressure during bull markets, while excessive inflation can dilute token value during bear markets.
Institutional Adoption and Market Applications
- Institutional Holdings: NEAR Protocol has attracted more institutional interest, with significant backing from major crypto VCs including a16z, Coinbase Ventures, and Dragonfly Capital.
- Enterprise Adoption: NEAR has developed partnerships with web2 companies and projects like Sweatcoin, while T aims to position itself as a decentralized storage solution for enterprises.
- National Policies: Both projects face varying regulatory approaches across different jurisdictions, with neutral to positive reception in innovation-friendly countries.
Technical Development and Ecosystem Building
- T Technical Upgrades: Focuses on developing decentralized storage infrastructure with optimized consensus mechanisms for data reliability.
- NEAR Technical Development: Implements sharding technology (Nightshade) allowing for theoretical throughput of 100,000+ TPS, with a developer-friendly environment that supports multiple programming languages.
- Ecosystem Comparison: NEAR has a more developed ecosystem spanning DeFi, NFTs, and gaming applications with approximately 1,200+ projects. T's ecosystem is still in earlier stages of development with focus on storage and data solutions.
Macroeconomic and Market Cycles
- Performance in Inflationary Environments: Neither has a long enough track record to definitively assess anti-inflationary properties.
- Macroeconomic Monetary Policy: Like most crypto assets, both are generally negatively affected by rising interest rates and strengthening USD.
- Geopolitical Factors: NEAR's Aurora (EVM compatibility) provides additional utility for cross-border transactions and applications.
III. 2025-2030 Price Prediction: T vs NEAR
Short-term Prediction (2025)
- T: Conservative $0.00639954 - $0.011851 | Optimistic $0.011851 - $0.01457673
- NEAR: Conservative $1.43028 - $2.466 | Optimistic $2.466 - $3.5757
Mid-term Prediction (2027)
- T may enter a growth phase, with estimated price range $0.010655660736 - $0.019387382728
- NEAR may enter a growth phase, with estimated price range $2.76468192 - $4.05277236
- Key drivers: Institutional capital inflow, ETF, ecosystem development
Long-term Prediction (2030)
- T: Base scenario $0.0155625274055 - $0.022554387544203 | Optimistic scenario $0.022554387544203 - $0.033380493565421
- NEAR: Base scenario $2.97435912756255 - $4.7973534315525 | Optimistic scenario $4.7973534315525 - $5.9487182551251
View detailed price predictions for T and NEAR
Disclaimer
T:
| 年份 |
预测最高价 |
预测平均价格 |
预测最低价 |
涨跌幅 |
| 2025 |
0.01457673 |
0.011851 |
0.00639954 |
0 |
| 2026 |
0.0163851926 |
0.013213865 |
0.0103068147 |
11 |
| 2027 |
0.019387382728 |
0.0147995288 |
0.010655660736 |
24 |
| 2028 |
0.02410177262724 |
0.017093455764 |
0.0119654190348 |
44 |
| 2029 |
0.024511160892787 |
0.02059761419562 |
0.016890043640408 |
73 |
| 2030 |
0.033380493565421 |
0.022554387544203 |
0.0155625274055 |
90 |
NEAR:
| 年份 |
预测最高价 |
预测平均价格 |
预测最低价 |
涨跌幅 |
| 2025 |
3.5757 |
2.466 |
1.43028 |
0 |
| 2026 |
3.262518 |
3.02085 |
2.6281395 |
22 |
| 2027 |
4.05277236 |
3.141684 |
2.76468192 |
26 |
| 2028 |
4.5684797886 |
3.59722818 |
3.2734776438 |
45 |
| 2029 |
5.511852878805 |
4.0828539843 |
2.735512169481 |
65 |
| 2030 |
5.9487182551251 |
4.7973534315525 |
2.97435912756255 |
93 |
IV. Investment Strategy Comparison: T vs NEAR
Long-term vs Short-term Investment Strategy
- T: Suitable for investors focused on privacy and security solutions in blockchain
- NEAR: Suitable for investors interested in scalable platforms with robust ecosystems
Risk Management and Asset Allocation
- Conservative investors: T: 30% vs NEAR: 70%
- Aggressive investors: T: 40% vs NEAR: 60%
- Hedging tools: Stablecoin allocation, options, cross-currency portfolios
V. Potential Risk Comparison
Market Risk
- T: Lower liquidity and trading volume may lead to higher price volatility
- NEAR: Susceptible to broader market trends and competitor developments
Technical Risk
- T: Scalability, network stability
- NEAR: Potential security vulnerabilities in smart contracts, sharding implementation challenges
Regulatory Risk
- Global regulatory policies may have differing impacts on both tokens, with NEAR potentially facing more scrutiny due to its wider ecosystem
VI. Conclusion: Which Is the Better Buy?
📌 Investment Value Summary:
- T advantages: Focus on privacy and security, potential for growth in decentralized storage solutions
- NEAR advantages: Established ecosystem, institutional backing, scalability features
✅ Investment Advice:
- Novice investors: Consider a higher allocation to NEAR due to its more established ecosystem and institutional support
- Experienced investors: Balanced approach with exposure to both, leveraging T's potential in privacy solutions and NEAR's ecosystem growth
- Institutional investors: NEAR may be more attractive due to its current adoption and scalability features
⚠️ Risk Warning: The cryptocurrency market is highly volatile. This article does not constitute investment advice.
None
VII. FAQ
Q1: What are the key differences between Threshold (T) and NEAR (NEAR)?
A: Threshold (T) focuses on privacy and security of digital assets on public blockchains, while NEAR (NEAR) is known for its high scalability and fast support for DApp operation on mobile devices. NEAR has a more developed ecosystem with approximately 1,200+ projects, while T's ecosystem is in earlier stages of development, focusing on storage and data solutions.
Q2: How do the supply mechanisms of T and NEAR compare?
A: T has an initial supply of 1 billion tokens with a maximum supply of 4.1 billion to be reached over about 10 years. NEAR has an initial supply of 1 billion tokens with inflation capped at 5% annually, featuring a dynamic supply model where 30% of transaction fees are burned, potentially making it deflationary with increased network usage.
Q3: Which token has attracted more institutional interest?
A: NEAR Protocol has attracted more institutional interest, with significant backing from major crypto VCs including a16z, Coinbase Ventures, and Dragonfly Capital.
Q4: What are the price predictions for T and NEAR in 2030?
A: For T, the base scenario predicts a range of $0.0155625274055 - $0.022554387544203, with an optimistic scenario of $0.022554387544203 - $0.033380493565421. For NEAR, the base scenario predicts $2.97435912756255 - $4.7973534315525, with an optimistic scenario of $4.7973534315525 - $5.9487182551251.
Q5: How do the technical developments of T and NEAR compare?
A: T focuses on developing decentralized storage infrastructure with optimized consensus mechanisms for data reliability. NEAR implements sharding technology (Nightshade) allowing for theoretical throughput of 100,000+ TPS, with a developer-friendly environment supporting multiple programming languages.
Q6: What are the recommended investment allocations for T and NEAR?
A: For conservative investors, a suggested allocation is 30% T and 70% NEAR. For aggressive investors, the recommendation is 40% T and 60% NEAR. However, these are general guidelines and individual investors should consider their own risk tolerance and investment goals.
Q7: What are the main risks associated with investing in T and NEAR?
A: For T, risks include lower liquidity, higher price volatility, and potential scalability issues. For NEAR, risks involve susceptibility to broader market trends, potential security vulnerabilities in smart contracts, and sharding implementation challenges. Both face regulatory risks, with NEAR potentially facing more scrutiny due to its wider ecosystem.
* The information is not intended to be and does not constitute financial advice or any other recommendation of any sort offered or endorsed by Gate.