This article provides a comparative analysis of Polkadot (DOT) and Tezos (XTZ), highlighting key differences in market cap, application scenarios, and technological ecosystems. It assesses historical and current price trends, supply mechanisms, institutional adoption, and investment value, guiding readers to evaluate which cryptocurrency may be a better investment "right now." Suitable for investors interested in blockchain platforms, it addresses considerations like risk management, asset allocation, and price predictions up to 2030. The analysis offers insights into interoperability and on-chain governance, enhancing understanding of potential investment strategies.
Introduction: DOT vs XTZ Investment Comparison
In the cryptocurrency market, Polkadot vs Tezos comparison has been an unavoidable topic for investors. The two not only have significant differences in market cap ranking, application scenarios, and price performance, but also represent different positioning in the crypto asset space.
Polkadot (DOT): Since its launch in 2020, it has gained market recognition for its interoperability and scalability features.
Tezos (XTZ): Introduced in 2018, it has been hailed as a self-amending blockchain platform, focusing on on-chain governance and formal verification.
This article will comprehensively analyze the investment value comparison between Polkadot and Tezos, focusing on historical price trends, supply mechanisms, institutional adoption, technological ecosystems, and future predictions, attempting to answer the question investors care about most:
"Which is the better buy right now?"
I. Price History Comparison and Current Market Status
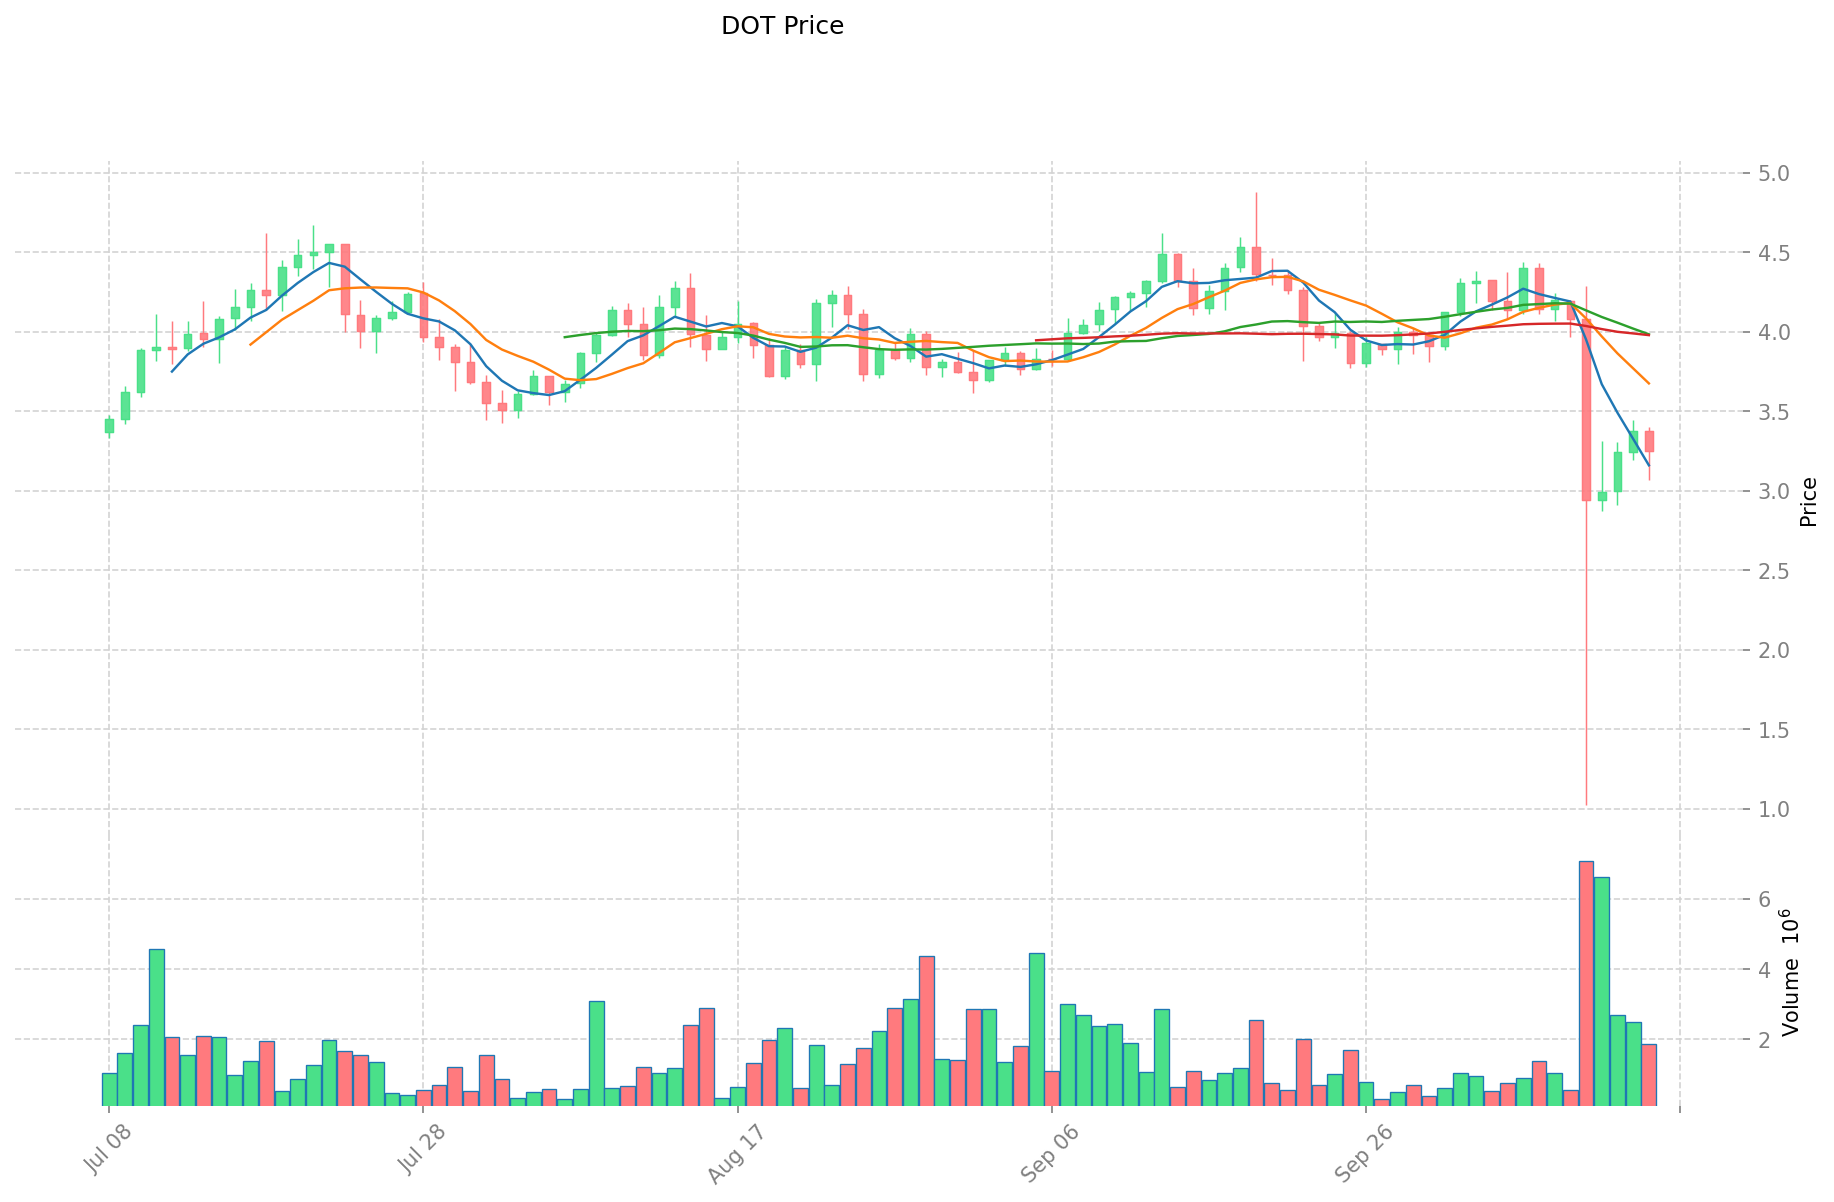
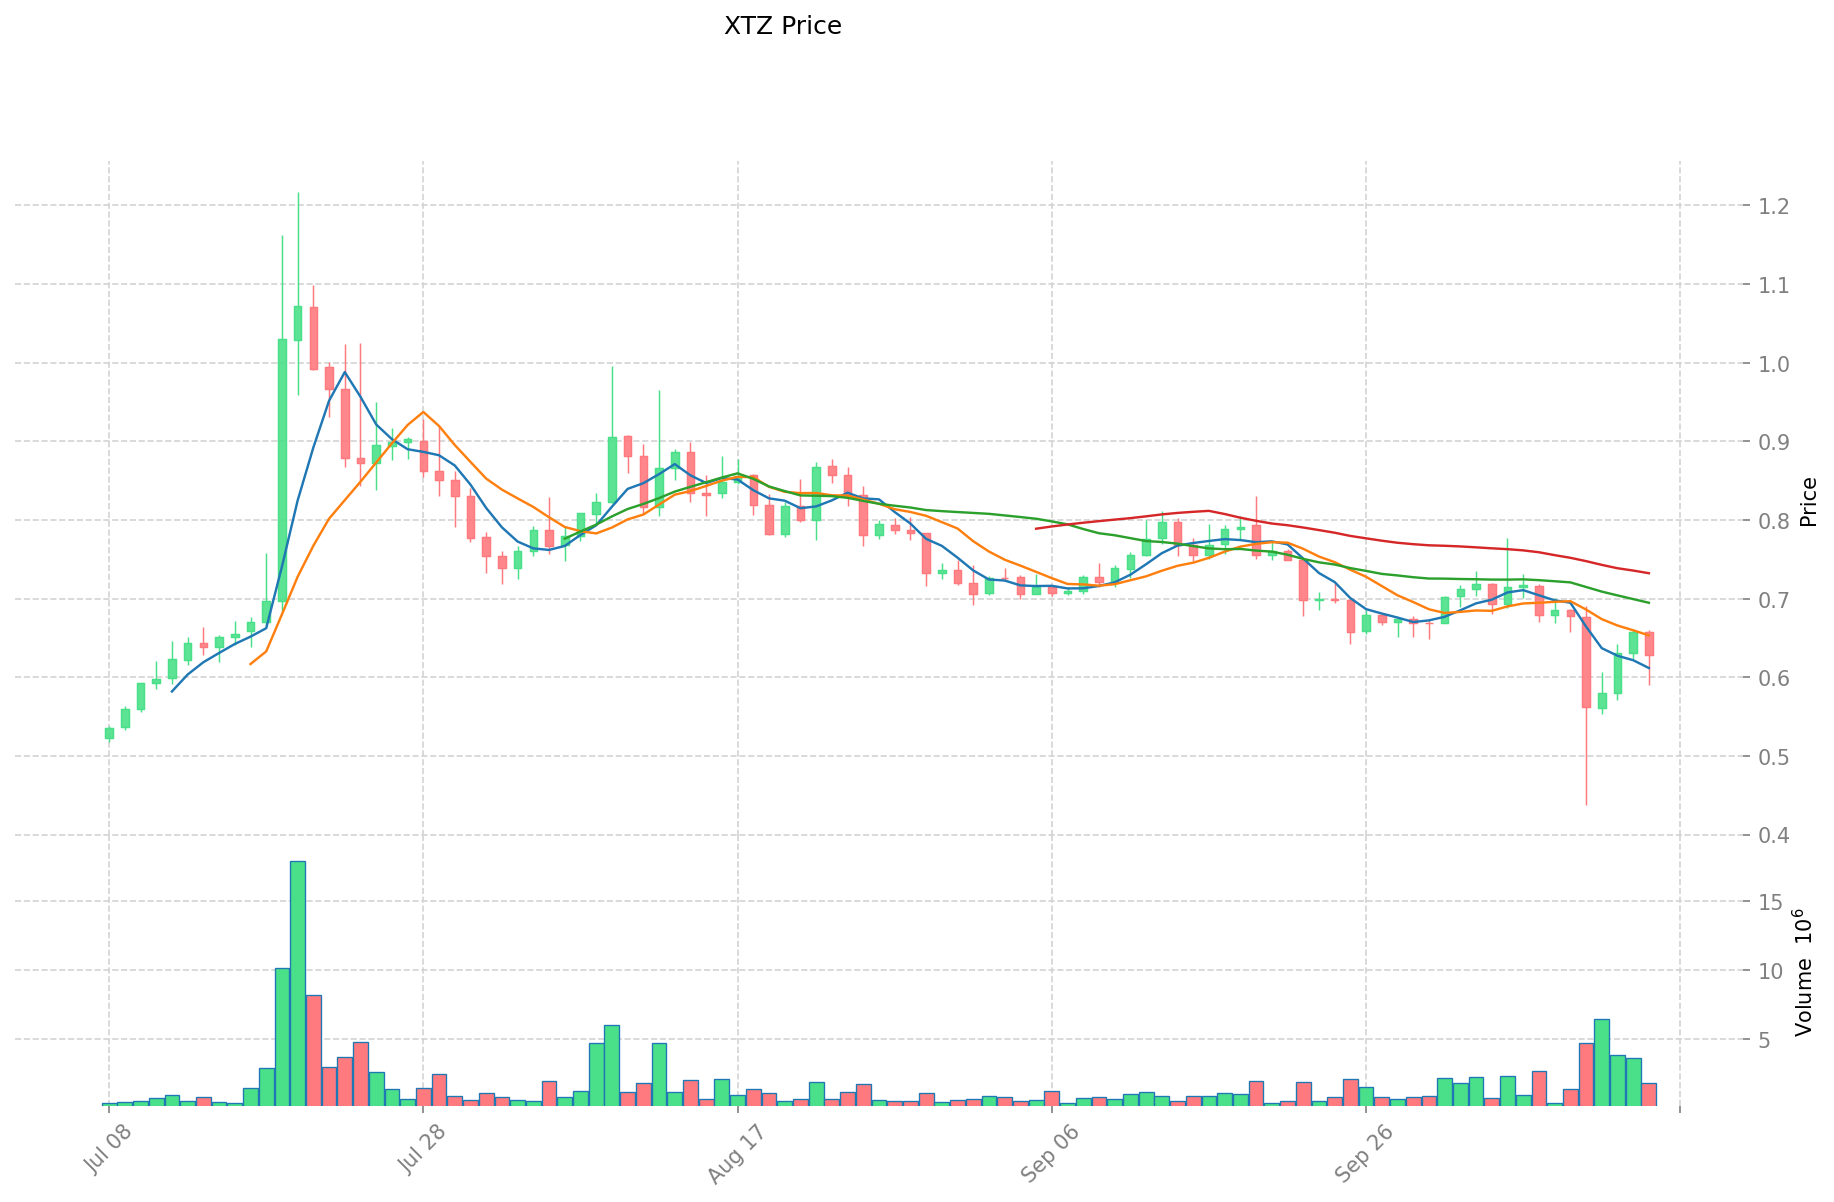
DOT and XTZ Historical Price Trends
- 2021: DOT reached an all-time high of $54.98 due to growing interest in its interoperability solutions.
- 2021: XTZ hit its peak price of $9.12, driven by increased adoption of its self-amending blockchain.
- Comparative analysis: During the 2022 bear market, DOT dropped from its high of $54.98 to a low of $3.67, while XTZ declined from $9.12 to $0.73.
Current Market Situation (2025-10-15)
- DOT current price: $3.217
- XTZ current price: $0.6203
- 24-hour trading volume: DOT $5,742,884 vs XTZ $1,123,329
- Market Sentiment Index (Fear & Greed Index): 34 (Fear)
Click to view real-time prices:
- View DOT current price Market Price
- View XTZ current price Market Price
Investment Value Analysis: DOT vs XTZ
I. Influence of Core Factors on DOT vs XTZ Investment Value
Supply Mechanism Comparison (Tokenomics)
- DOT: The 100x split dilution reduced DOT price without damaging total user asset value, helping expand the investor base and stimulating market interest.
- XTZ: Limited information available on specific tokenomics in the provided materials.
- 📌 Historical Pattern: For DOT, the split event (similar to stock splits in traditional markets) was considered positive and triggered significant price appreciation.
Institutional Adoption and Market Applications
- Institutional Holdings: Limited specific information on institutional preferences between the two.
- Enterprise Adoption: DOT showed notable market confidence following its split, reaching a market cap of $5.5 billion.
- Regulatory Attitudes: The materials mention increasing regulatory risks impacting the broader crypto market in mid-year, affecting both tokens.
Technological Development and Ecosystem Building
- DOT Technical Development: Positioned as having substantial future potential with the "equivalence principle" valuation model suggesting DOT=ADA+XTZ+ETH2.0+EOS+ATOM.
- XTZ Technical Development: When Tezos gained popularity, tools and applications failed to keep pace with demand, leading to the "ghost chain" issue that affected its growth.
- Ecosystem Comparison: Both operate as PoS chains with lower energy consumption compared to Ethereum. DOT's collaboration announcements and integration with DeFi and NFT platforms have driven market interest.
Macroeconomic and Market Cycles
- Performance in Inflationary Environments: The materials don't provide specific information on this aspect.
- Macroeconomic Monetary Policy: Bull market sentiment in the broader crypto market positively influenced both assets, though specific impacts of interest rates or USD index aren't detailed.
- Geopolitical Factors: Limited information on how geopolitical factors specifically impact DOT and XTZ.
II. Key Investment Considerations
The crypto market often temporarily ignores certain projects before suddenly embracing them enthusiastically. Both DOT and XTZ have experienced market fluctuations typical of the crypto space.
For potential investors, project fundamentals should be prioritized: whether the project addresses industry needs and contributes to exploration and development. Various economic valuation methods exist in the industry, with each investor potentially developing their own approach.
III. Price Predictions for 2025-2030: DOT vs XTZ
Short-term Predictions (2025)
- DOT: Conservative $1.80-$3.22 | Optimistic $3.22-$3.48
- XTZ: Conservative $0.55-$0.62 | Optimistic $0.62-$0.87
Mid-term Predictions (2027)
- DOT may enter a growth phase, with prices expected in the range of $2.17-$5.75
- XTZ may enter a steady growth phase, with prices expected in the range of $0.75-$1.21
- Key drivers: Institutional capital inflow, ETF developments, ecosystem growth
Long-term Predictions (2030)
- DOT: Base scenario $3.58-$6.18 | Optimistic scenario $6.18-$9.21
- XTZ: Base scenario $1.21-$1.33 | Optimistic scenario $1.33-$1.95
View detailed price predictions for DOT and XTZ
Disclaimer: The information provided is for informational purposes only and should not be considered as financial advice. Cryptocurrency markets are highly volatile and unpredictable. Always conduct your own research before making any investment decisions.
DOT:
| 年份 |
预测最高价 |
预测平均价格 |
预测最低价 |
涨跌幅 |
| 2025 |
3.47868 |
3.221 |
1.80376 |
0 |
| 2026 |
4.689776 |
3.34984 |
1.9429072 |
4 |
| 2027 |
5.74832544 |
4.019808 |
2.17069632 |
24 |
| 2028 |
6.0074020656 |
4.88406672 |
3.6142093728 |
51 |
| 2029 |
6.916082678856 |
5.4457343928 |
4.683331577808 |
69 |
| 2030 |
9.20955371838372 |
6.180908535828 |
3.58492695078024 |
92 |
XTZ:
| 年份 |
预测最高价 |
预测平均价格 |
预测最低价 |
涨跌幅 |
| 2025 |
0.87276 |
0.6234 |
0.548592 |
0 |
| 2026 |
0.9201384 |
0.74808 |
0.7256376 |
20 |
| 2027 |
1.20945834 |
0.8341092 |
0.75069828 |
34 |
| 2028 |
1.2465761994 |
1.02178377 |
0.817427016 |
64 |
| 2029 |
1.531142979345 |
1.1341799847 |
0.952711187148 |
82 |
| 2030 |
1.94568576375285 |
1.3326614820225 |
1.212721948640475 |
114 |
IV. Investment Strategy Comparison: DOT vs XTZ
Long-term vs Short-term Investment Strategies
- DOT: Suitable for investors focused on interoperability and ecosystem potential
- XTZ: Suitable for those interested in on-chain governance and formal verification
Risk Management and Asset Allocation
- Conservative investors: DOT: 60% vs XTZ: 40%
- Aggressive investors: DOT: 75% vs XTZ: 25%
- Hedging tools: Stablecoin allocation, options, cross-currency combinations
V. Potential Risk Comparison
Market Risk
- DOT: Higher volatility due to larger market cap and trading volume
- XTZ: Lower liquidity might lead to more pronounced price swings
Technical Risk
- DOT: Scalability, network stability
- XTZ: Potential "ghost chain" issues, ecosystem growth challenges
Regulatory Risk
- Global regulatory policies may impact both, with DOT potentially facing more scrutiny due to its higher profile
VI. Conclusion: Which Is the Better Buy?
📌 Investment Value Summary:
- DOT advantages: Strong interoperability features, larger ecosystem, higher institutional interest
- XTZ advantages: Focus on on-chain governance, formal verification, potential for steady growth
✅ Investment Advice:
- New investors: Consider a balanced approach, leaning towards DOT for its larger ecosystem
- Experienced investors: Evaluate based on technological preferences and risk tolerance
- Institutional investors: DOT may offer more liquidity and ecosystem opportunities
⚠️ Risk Warning: Cryptocurrency markets are highly volatile. This article does not constitute investment advice.
None
FAQ
Q1: What are the main differences between Polkadot (DOT) and Tezos (XTZ)?
A: Polkadot focuses on interoperability and scalability, while Tezos emphasizes on-chain governance and formal verification. DOT has a larger market cap and ecosystem, whereas XTZ offers a self-amending blockchain platform.
Q2: How have DOT and XTZ performed historically?
A: In 2021, DOT reached an all-time high of $54.98, while XTZ peaked at $9.12. During the 2022 bear market, DOT dropped to a low of $3.67, and XTZ declined to $0.73.
Q3: What are the price predictions for DOT and XTZ by 2030?
A: For DOT, the base scenario predicts $3.58-$6.18, with an optimistic scenario of $6.18-$9.21. For XTZ, the base scenario is $1.21-$1.33, with an optimistic scenario of $1.33-$1.95.
Q4: Which token is better suited for long-term investment?
A: DOT may be more suitable for long-term investors focused on interoperability and ecosystem potential, while XTZ might appeal to those interested in on-chain governance and formal verification.
Q5: How do institutional adoption and market applications differ between DOT and XTZ?
A: DOT has shown notable market confidence, reaching a market cap of $5.5 billion after its token split. Specific information on XTZ's institutional adoption is limited in the provided materials.
Q6: What are the main risks associated with investing in DOT and XTZ?
A: For DOT, risks include higher volatility, scalability issues, and potential regulatory scrutiny. XTZ faces risks such as lower liquidity, potential "ghost chain" issues, and ecosystem growth challenges.
Q7: How should investors allocate their assets between DOT and XTZ?
A: Conservative investors might consider a 60% DOT to 40% XTZ ratio, while aggressive investors could opt for a 75% DOT to 25% XTZ split. However, individual risk tolerance and investment goals should guide allocation decisions.
* The information is not intended to be and does not constitute financial advice or any other recommendation of any sort offered or endorsed by Gate.


